

U.S. DOLLAR ANALYSIS & TALKING POINTS
- U.S. midterm elections not reflecting as expected in financial markets.
- U.S. inflation data to dictate short-term directional bias.
- Bull flag evolving.
Trade Smarter – Sign up for the DailyFX Newsletter
Receive timely and compelling market commentary from the DailyFX team
Subscribe to Newsletter
USD FUNDAMENTAL BACKDROP
The Dollar Index (DXY) has been relatively subdued thus far this week as markets prepare for U.S. inflation later today. While the ongoing midterm elections were thought to provide a ‘red’ sweep by Republicans, this has not been the case up until now however, the House looks likely to be controlled by the Republicans which may limit President Joe Bidens and the Democrats future proposals. The expected dominance by Republicans had the dollar trading marginally softer leading up to the elections but the key metric for markets this week is the CPI print (see economic calendar below).

Recommended by Warren Venketas
Get Your Free USD Forecast
ECONOMIC CALENDAR
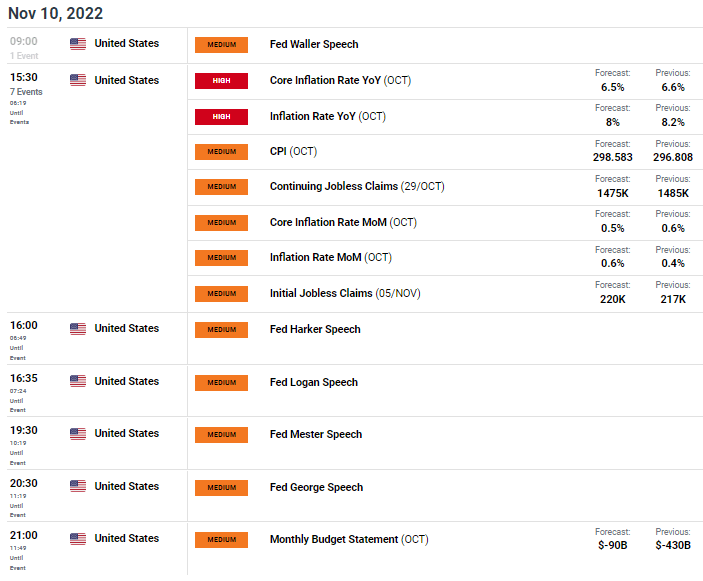
Source: DailyFX economic calendar
Both headline and core inflation which excludes food and energy (the Fed’s preferred measure) are projected lower yet still elevated should the actual figure match estimates. Anything higher than 8% and 6.5% respectively could end the recent USD downtrend, maintaining hawkish bets for the Fed.
Peak rates for the Fed in 2023 has come down since last week’s FOMC meet, closer to the 5% level from 5.1%.
FEDERAL RESERVE INTEREST RATE PROBABILITIES
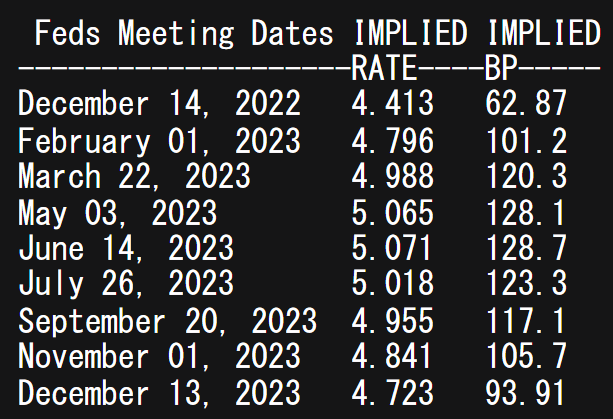
Source: Refinitiv
After U.S. CPI, the calendar is riddled with a slew of Fed speakers who will likely react in accordance with the inflation read.
TECHNICAL ANALYSIS
U.S. DOLLAR INDEX DAILY CHART
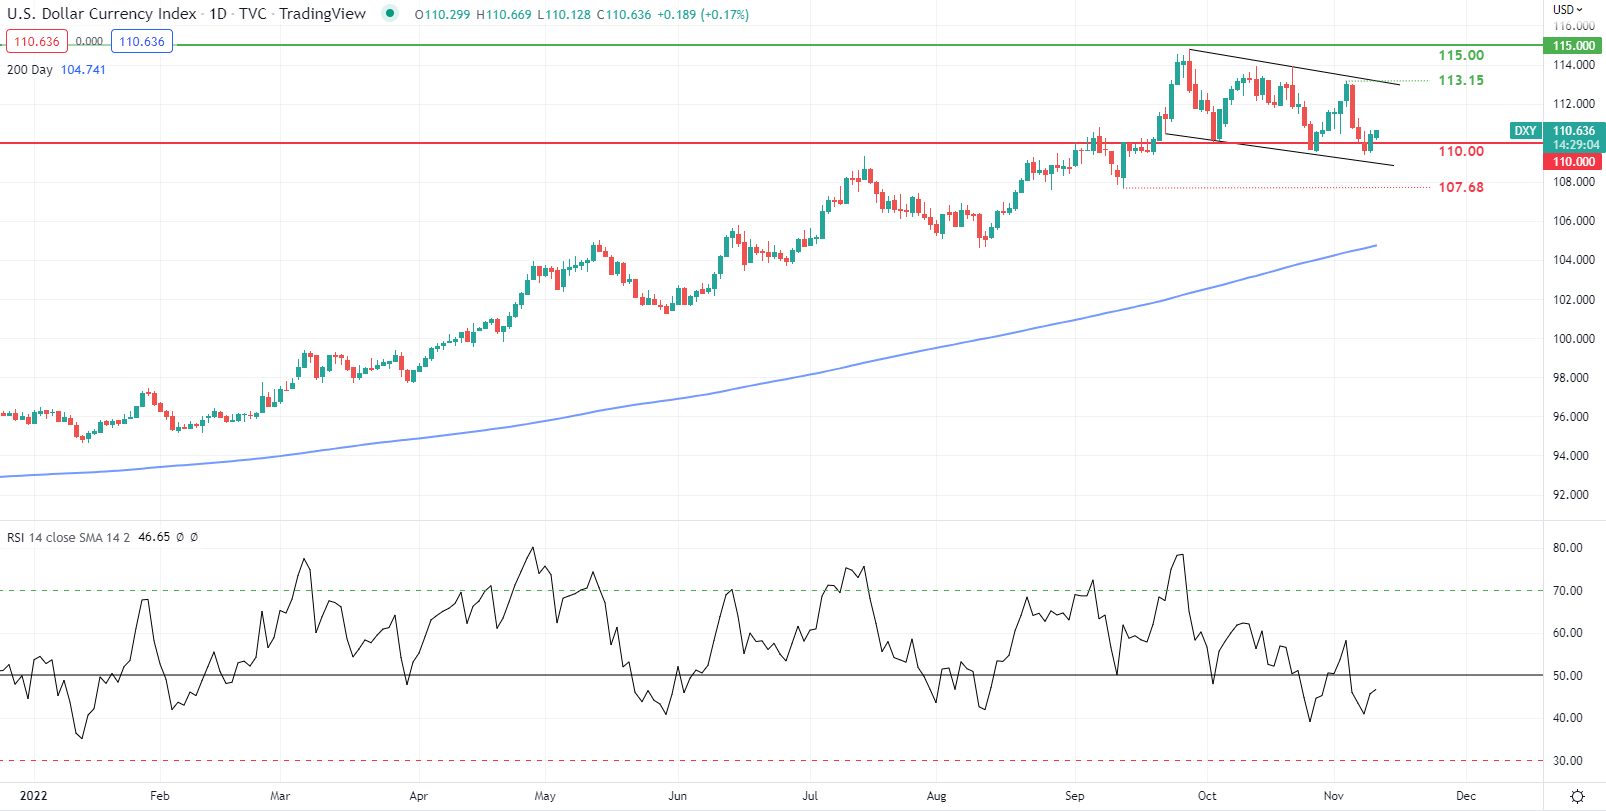
Chart prepared by Warren Venketas, IG
Daily DXY price action suggests a brewing bullish breakout via the developing bull flag chart pattern (black). The psychological 110.00 support level will be key for both a daily candle close and weekly. The Relative Strength Index (RSI) remains skewed to the downside, but considering the weak eurozone outlook (DXY comprised of 57.6% euro weighting), the dollar should remain elevated especially after the recent correction.
Resistance levels:
- 115.00
- 113.15
Support levels:
- 110.00
- Flag support
Introduction to Technical Analysis
Technical Analysis Chart Patterns
Recommended by Warren Venketas
Contact and followWarrenon Twitter:@WVenketas
Be the first to comment