cemagraphics
This article continues on from last week’s publication when the S&P 500 was on the verge of a bullish breakout. It was close, but the breakout failed and this lead to a large move lower. So what now?
In an attempt to answer that, a variety of technical analysis techniques will be used to look at probable moves for the S&P 500 (SPY) in the week ahead. Just like last week, the market will be viewed in probable outcomes using inflection points – if it is going down, where is it likely to go? If it is going up, where is it likely to test?
The S&P 500 chart will be analyzed on monthly, weekly and daily timeframes, then the information collated into an actionable summary at the end.
The Market Narrative
While the focus of this article is primarily on technical analysis, a more complete picture combines it with fundamental and sentiment studies.
Last week’s drop was partially driven by more weak data in the form of retail sales (the largest drop in a year) and manufacturing output (the largest drop in nearly two years). Notably, this was a change to the previous dichotomy where bad news was good for the market (as it increased the chances of a Fed pivot). With inflation already trending lower and the Fed nearly done with their hiking cycle, wage growth is the only hurdle to a dovish Fed and bulls now want to see data on the stronger side. The ‘Goldilocks’ narrative has both the US economy avoiding a recession and the Fed slowing, pausing and then cutting later this year. Perhaps this is asking too much.
While earnings season is still in the early stages, the data is mixed at best. EPS has beaten estimates only 64% of the time and missed 33%. Compared to the Q3 numbers of 71% beats and 25% misses, with Q2 at 78% and 18%, it suggests the bar was set too high (if you can call a -2.9% estimate for Q4 earnings growth ‘high’). The overall trend so far is negative despite some bright spots from most of the big banks and Netflix (NFLX).
S&P 500 Monthly
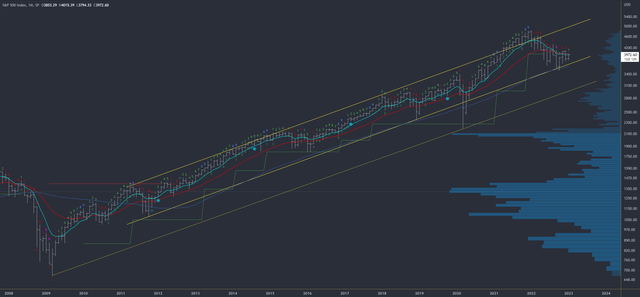
The monthly chart allows us to see the bigger picture and the trend from the 2009 low. While price has held the upper channel, the drop in 2022 broke the green trend support level (derived from Demark indicators) for the first time since the 2009 low. There is therefore some evidence the trend is now over and has flipped neutral / down.
In relation to next week, the monthly chart has resistance at the range high of 4101 and beyond that, 4325 at the high of August. Support is at December’s low of 3764, the 50ma at 3610 and the 3491 low.
There are no exhaustion signals in either direction (using Demark methods).
S&P 500 Weekly
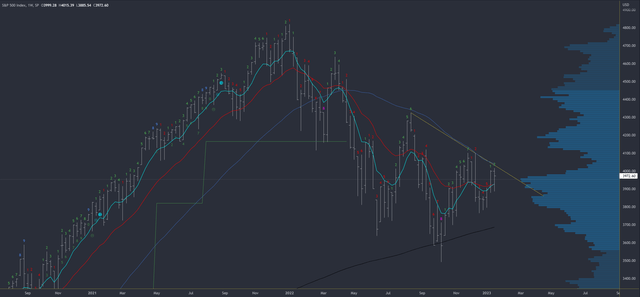
Last week’s action had the potential to form a reversal bar on the weekly, but it would have had to close near the lows of the week. Friday’s rally managed to negate the reversal and flip the weekly bar back neutral.
Resistance is again at the 50ma and the trendline which will drop to around 4020-25 next week. If this area is broken, 4101 is the next resistance, then 4203 at the large weekly gap. Support is at the 3764 pivot low and the 200ma will be around 3690.
Again, there are no exhaustion signals in either direction.
The trend is down (lower lows and lower highs).
S&P 500 Daily
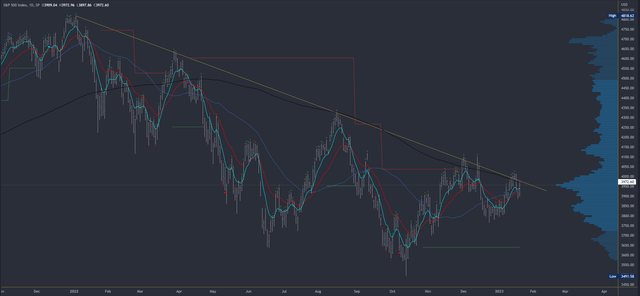
Last week’s attempted break of the trendline failed and set up a sharp move lower. This held 3877 support with a bottom at 3885 on Thursday.
In many ways the view is similar to last week’s as the strong close on Friday at the highs of the session gives a bullish bias early in the week to at least take out Friday’s 3973 high. Once over 3973, it could well reverse and would need to take out 4015 and last week’s high, plus the 4025 weekly resistance to cement a bullish move.
Price is again in the vicinity of the 200dma (3966 on Monday) and the trendline (3976 on Monday). With so many tests of these resistance points, their importance is perhaps eroding and 4015-25 is more relevant resistance.
Support is at 3877-3885, then 3764. An undercut of 3764 could fill the gap at 3748.
A downside exhaustion count is underway but would only be active with further drops into Friday 27th January.
Scenarios for Next Week
Bullish
Bulls want momentum from Friday to continue with more strong closes and a push past 4015-4025. This should lead to 4101, followed by 4203 should it break.
Bearish
A move through 3877-3885 targets 3764, and could perhaps undercut for 3748.
Conclusion
The S&P 500 is again near the much-eyed trendline now around 3976. With so much chopping around this resistance, it is best to widen the bullish inflection and 4015-4025 would need to be cleared to cement a bullish look. GDP data on Thursday and earnings are possible catalysts and would need to come in strong. Should 4015-4025 hold, bears will target 3877-3885, then 3764.


Be the first to comment