

DNY59
By Miles Li & Luke Lu, Yield Book Research
As global markets face prolonged macroeconomic headwinds and a potential recession, institutional investors are turning more attention to manager performance as a guidance for investments in the Collateralized Loan Obligation (CLO) market, whose unique feature is active management of underlying collateral assets.
During the reinvestment period, experienced managers with a strong credit selection skillset and a sound risk framework can add significant value by taking advantage of market volatility. In times of uncertainty, investors are also more selective with their choice of managers.
So, how should we view CLO managers when the markets are under pressure? What are the factors to track when evaluating manager performance?
In the Yield Book CLO Market Overview monthly publication, launched recently, we proposed looking at manager performance from four major aspects, including size, collateral quality, equity favour, and active management. We focused on the broadly syndicated loan (BSL) CLO managers only as this is the vast majority of the market.
In particular, we dissected manager performance through 11 different metrics, covering assets under management (AUM), WAS/WARF, Diversity, Junior OC cushion, Caa/CCC %, Second Lien %, Defaulted %, WAP, Notional Par Build, Equity Cash on Cash %, and Equity Market Value NAV. Below we showcase the results of three metrics as examples of our approach, touching on collateral market movement, risk/reward and collateralization aspects.
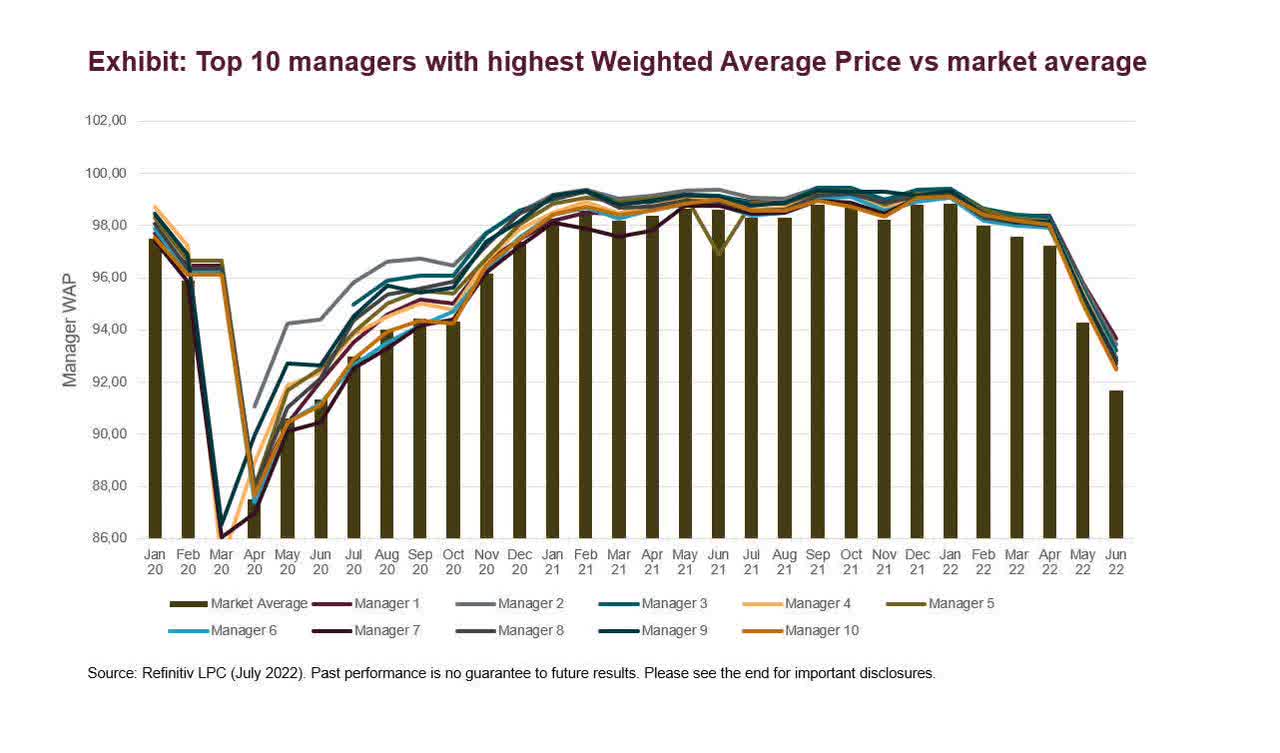
Amid the recent market turbulence, the weighted average market price for CLO collateral loans fell to 91.7 in June month-end, hitting the lowest spot since July 2020. Even the top managers have average loan prices falling below 94. That said, the current environment can present opportunities for active CLO managers to pick credits and build par by buying deeply discounted loans.
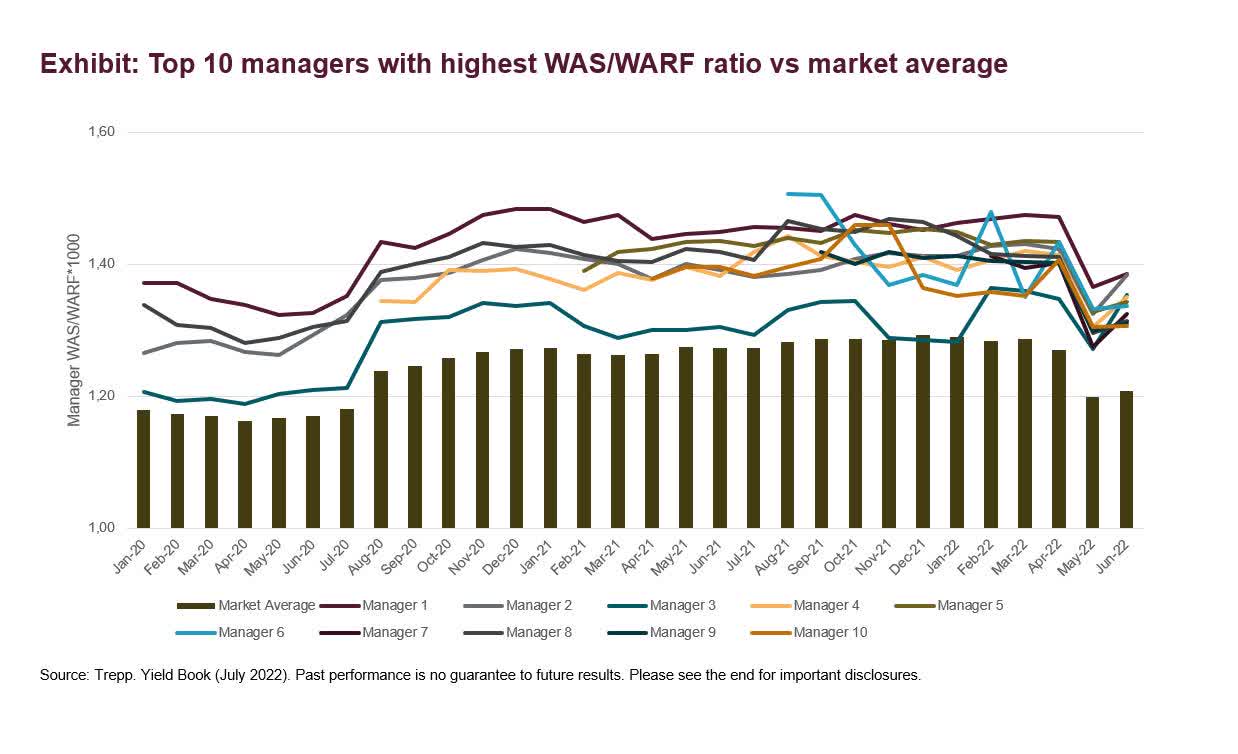
The risk/reward trade-off is always at the core of credit selection. To measure this, we have chosen the WAS/WARF ratio as one of the credit selection differentiators. The top performing managers typically are able to pick up excess spreads without sacrificing too much in loan quality. The chart below shows the WAS/WARF ratio of the market average (bars) and top 10 managers with the highest WAS/WARF ratio calculated by the most recent trustee reports (lines) for period from January 2020 to June 2022.
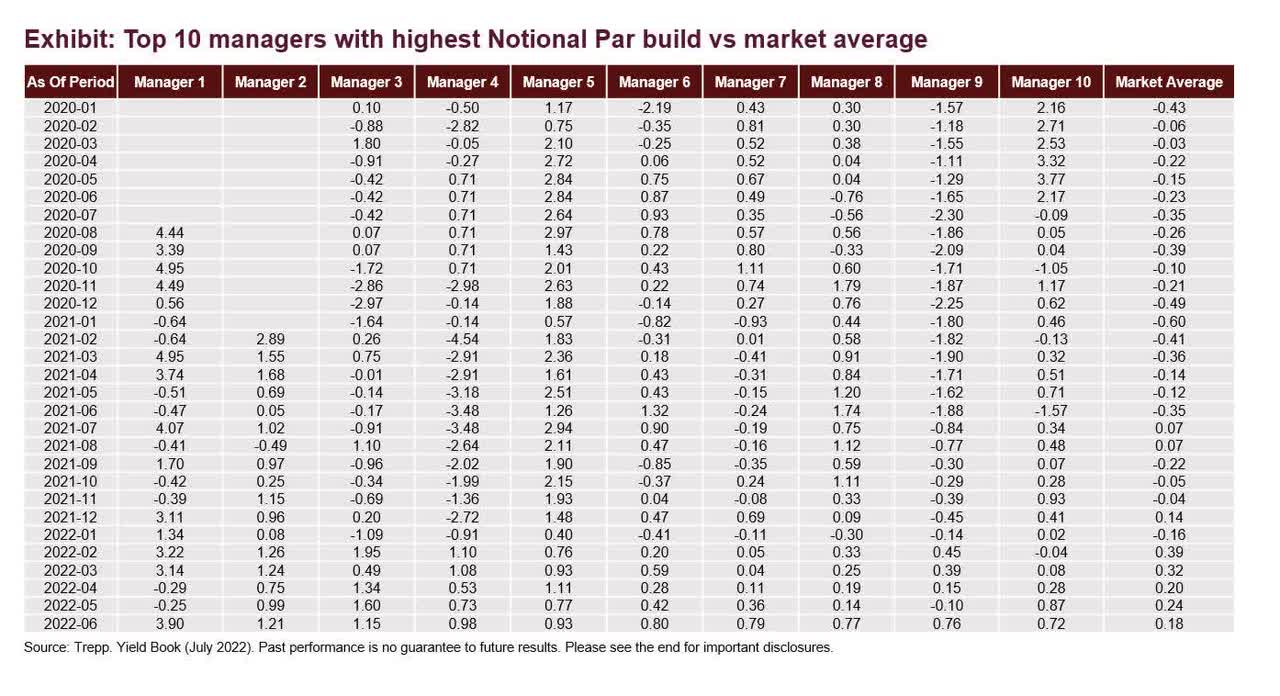
Separately, we employed Notional Par Build to evaluate managers’ ability to strengthen collateralization, by comparing the current excess par amount to the initial excess par as of effective date. Illustrated by the table below, the top 10 managers were all able to achieve a notional par build over 0.7% vs. the market average of 0.18% in June.
© 2022 London Stock Exchange Group plc and its applicable group undertakings (the “LSE Group”). The LSE Group includes (1) FTSE International Limited (“FTSE”), (2) Frank Russell Company (“Russell”), (3) FTSE Global Debt Capital Markets Inc. and FTSE Global Debt Capital Markets Limited (together, “FTSE Canada”), (4) FTSE Fixed Income Europe Limited (“FTSE FI Europe”), (5) FTSE Fixed Income LLC (“FTSE FI”), (6) The Yield Book Inc (“YB”) and (7) Beyond Ratings S.A.S. (“BR”). All rights reserved.
FTSE Russell® is a trading name of FTSE, Russell, FTSE Canada, FTSE FI, FTSE FI Europe, YB and BR. “FTSE®”, “Russell®”, “FTSE Russell®”, “FTSE4Good®”, “ICB®”, “The Yield Book®”, “Beyond Ratings®” and all other trademarks and service marks used herein (whether registered or unregistered) are trademarks and/or service marks owned or licensed by the applicable member of the LSE Group or their respective licensors and are owned, or used under licence, by FTSE, Russell, FTSE Canada, FTSE FI, FTSE FI Europe, YB or BR. FTSE International Limited is authorised and regulated by the Financial Conduct Authority as a benchmark administrator.
All information is provided for information purposes only. All information and data contained in this publication is obtained by the LSE Group, from sources believed by it to be accurate and reliable. Because of the possibility of human and mechanical error as well as other factors, however, such information and data is provided “as is” without warranty of any kind. No member of the LSE Group nor their respective directors, officers, employees, partners or licensors make any claim, prediction, warranty or representation whatsoever, expressly or impliedly, either as to the accuracy, timeliness, completeness, merchantability of any information or of results to be obtained from the use of FTSE Russell products, including but not limited to indexes, data and analytics, or the fitness or suitability of the FTSE Russell products for any particular purpose to which they might be put. Any representation of historical data accessible through FTSE Russell products is provided for information purposes only and is not a reliable indicator of future performance.
No responsibility or liability can be accepted by any member of the LSE Group nor their respective directors, officers, employees, partners or licensors for (a) any loss or damage in whole or in part caused by, resulting from, or relating to any error (negligent or otherwise) or other circumstance involved in procuring, collecting, compiling, interpreting, analysing, editing, transcribing, transmitting, communicating or delivering any such information or data or from use of this document or links to this document or (b) any direct, indirect, special, consequential or incidental damages whatsoever, even if any member of the LSE Group is advised in advance of the possibility of such damages, resulting from the use of, or inability to use, such information.
No member of the LSE Group nor their respective directors, officers, employees, partners or licensors provide investment advice and nothing in this document should be taken as constituting financial or investment advice. No member of the LSE Group nor their respective directors, officers, employees, partners or licensors make any representation regarding the advisability of investing in any asset or whether such investment creates any legal or compliance risks for the investor. A decision to invest in any such asset should not be made in reliance on any information herein. Indexes cannot be invested in directly. Inclusion of an asset in an index is not a recommendation to buy, sell or hold that asset nor confirmation that any particular investor may lawfully buy, sell or hold the asset or an index containing the asset. The general information contained in this publication should not be acted upon without obtaining specific legal, tax, and investment advice from a licensed professional.
Past performance is no guarantee of future results. Charts and graphs are provided for illustrative purposes only. Index returns shown may not represent the results of the actual trading of investable assets. Certain returns shown may reflect back-tested performance. All performance presented prior to the index inception date is back-tested performance. Back-tested performance is not actual performance, but is hypothetical. The back-test calculations are based on the same methodology that was in effect when the index was officially launched. However, back-tested data may reflect the application of the index methodology with the benefit of hindsight, and the historic calculations of an index may change from month to month based on revisions to the underlying economic data used in the calculation of the index.
This document may contain forward-looking assessments. These are based upon a number of assumptions concerning future conditions that ultimately may prove to be inaccurate. Such forward-looking assessments are subject to risks and uncertainties and may be affected by various factors that may cause actual results to differ materially. No member of the LSE Group nor their licensors assume any duty to and do not undertake to update forward-looking assessments.
No part of this information may be reproduced, stored in a retrieval system or transmitted in any form or by any means, electronic, mechanical, photocopying, recording or otherwise, without prior written permission of the applicable member of the LSE Group. Use and distribution of the LSE Group data requires a licence from FTSE, Russell, FTSE Canada, FTSE FI, FTSE FI Europe, YB, BR and/or their respective licensors.
Editor’s Note: The summary bullets for this article were chosen by Seeking Alpha editors.
Be the first to comment