

Shangarey/iStock via Getty Images
Aerospace & defense equities have been a rare spot of green in a sea of red when glancing at the 1-year ETF heat map. While the iShares U.S. Aerospace & Defense ETF (ITA) gets all the buzz, one lesser-known play offers exposure to smaller stocks in the industry.
Aerospace & Defense Lifts Off YoY
Finviz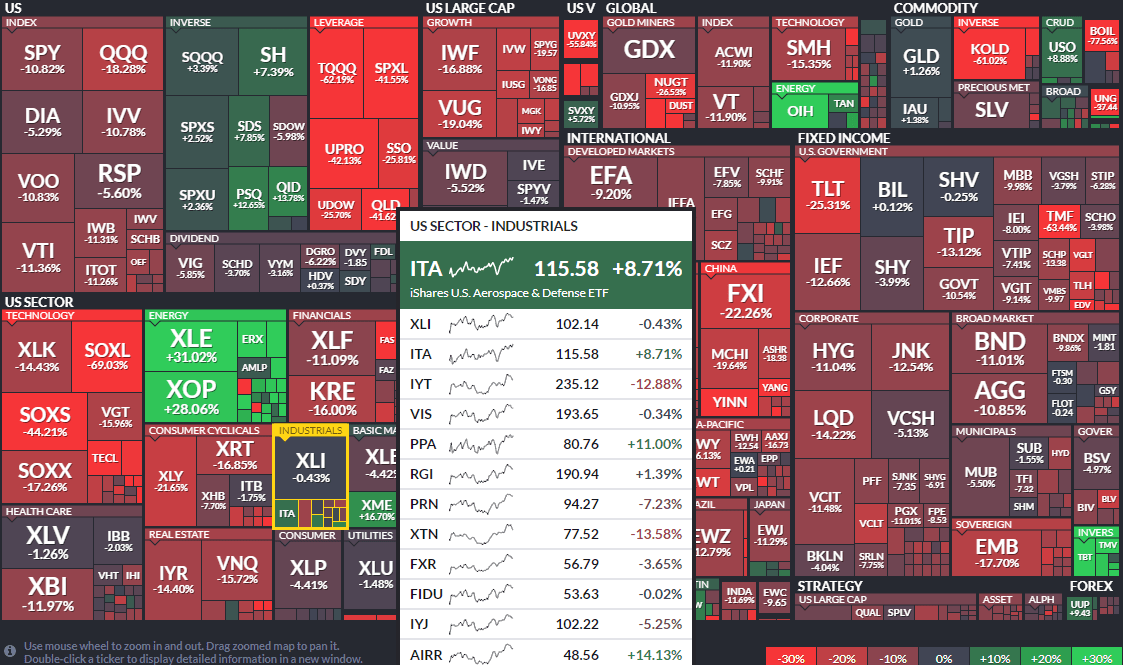
XAR vs ITA: A broken Relative Downtrend?
Stockcharts.com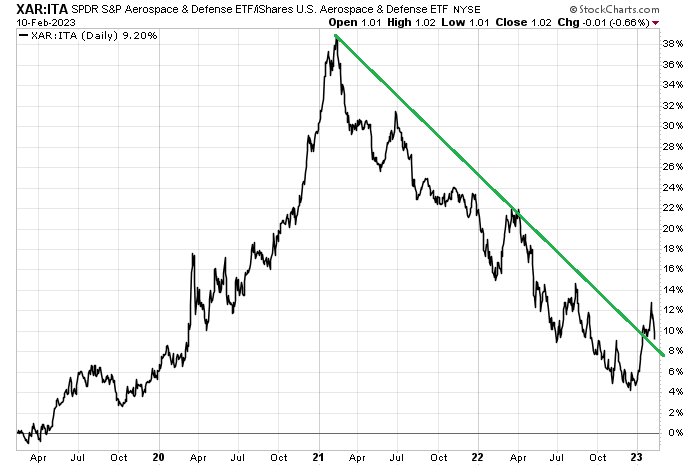
According to SSGA Funds, the SPDR S&P Aerospace & Defense ETF (NYSEARCA:XAR) offers investors exposure to the Aerospace & Defense segment of the S&P TMI, which comprises the following sub-industries: Aerospace & Defense. It tracks a modified equal-weighted index which provides the potential for unconcentrated industry exposure across large, mid, and small-cap stocks.
XAR has a reasonable 0.35% annual gross expense ratio and has a track record dating back more than a decade to its 2011 inception.
The fund holds 33 stocks and the noted 3-5 year EPS growth rate is strong at 13.0% per the issuer. With a price-to-book ratio of the portfolio above 3, though, it is not overly cheap on that metric. Moreover, the forward operating earnings multiple on XAR is high at 25.4.
The ETF also does not offer income investors much to write home about as the index’s dividend yield is just 0.67%. Still, with a median market cap of $4.6 billion, there’s exposure to potentially fast-growing small and mid-sized defense names. Finally, there’s solid liquidity and tradability with XAR – the median 30-day bid/ask spread is 8 basis points though daily volume is low at just 11,439 shares.
XAR is somewhat concentrated, but the equal-weight nature helps mitigate against a few stocks taking the fund lower in a single event.
XAR Top Holdings
SSGA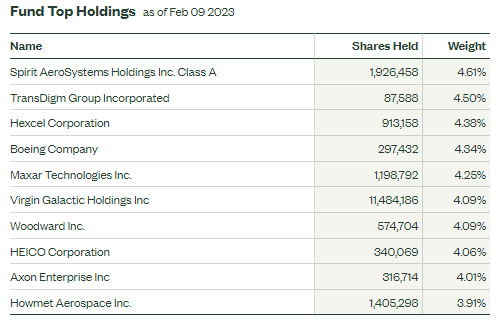
Digging further into the portfolio, you will see that it acts like a mid-cap blend fund and has a high P/E according to Morningstar with a slight bent toward the growth style.
It’s actually a low-quality ETF but features above-average momentum and liquidity. Risk-seeking investors can go with XAR while a slightly less volatile play could be done with the ITA which is cap-weighted.
XAR Portfolio X-Ray
Morningstar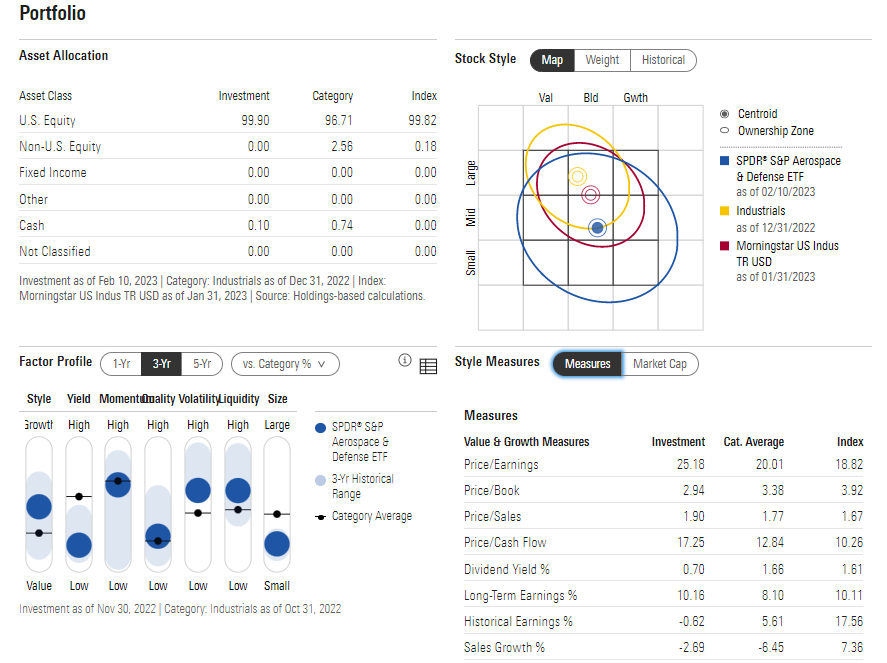
The Technical Take
With a premium valuation and decent earnings growth, how does the chart look? Notice in the graph below that XAR is peeking above a downtrend resistance line off the high from early to mid-2021. Also, I see shares as having some support at a horizontal line near $115. A long play here with a stop under $105 (the November to December range lows and flat 200-day moving average) looks good.
But also take note of a high amount of volume by price in the $115 to $125 area – that is a challenge for the bulls right now, but I think it can eventually climb above that zone since RSI momentum remains in a bullish zone between 40 and 75. You can even make the case that a bullish cup and handle pattern broke out earlier this year – yielding a bullish measured move price objective to the low $130s.
XAR: Going For A Breakout
Stockcharts.com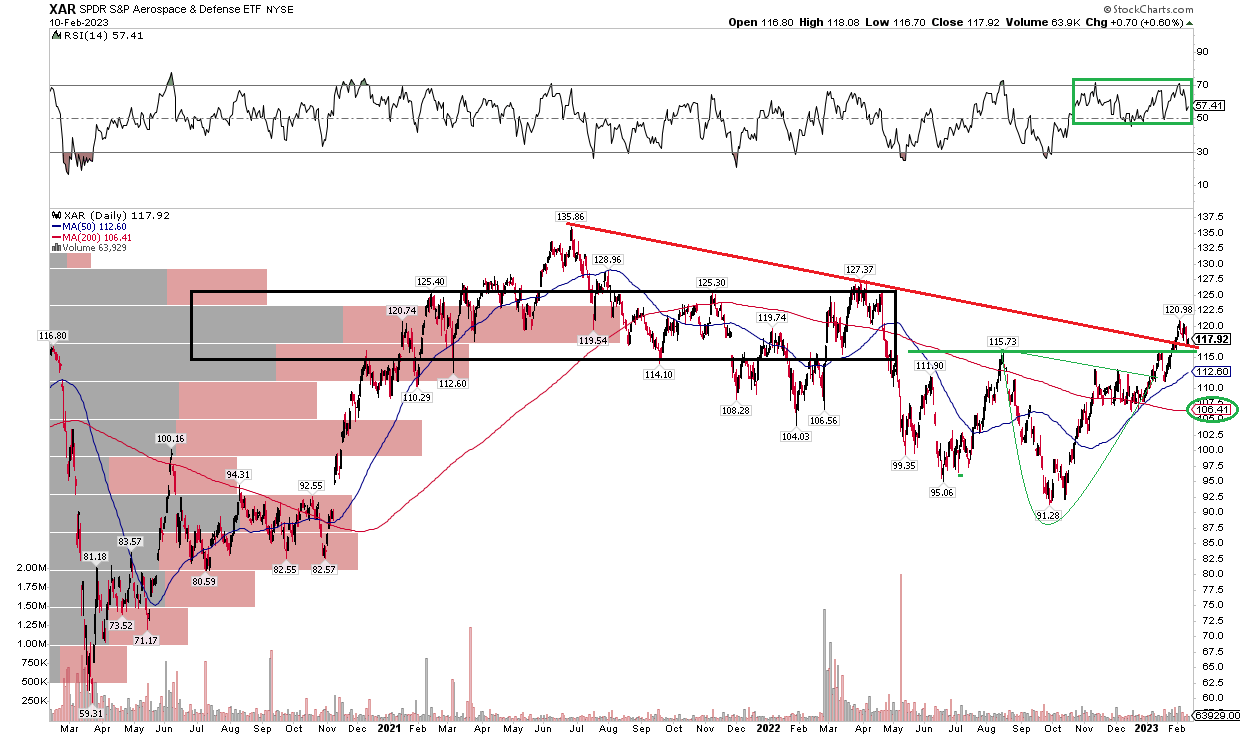
The Bottom Line
Aerospace & Defense continues to work despite some recent shakiness among other Industrials sector stocks. With strong upward momentum, the trend favors the bulls while fundamental investors might scoff at XAR’s high PEG ratio. In this case, I think price action overrules the valuation. I see XAR as having more room to run to the upside.
Be the first to comment