

piranka
Invesco S&P 500 Equal Weight Technology ETF (NYSEARCA:RYT) is an exchange-traded fund that invests in accord with its chosen benchmark, the S&P 500 Equal Weight Information Technology Index. The fund’s task is essentially to maintain a portfolio that reflects an equal-weighted portfolio of information technology companies that exist within the broader S&P 500 U.S. equity index. The total expense ratio is 0.40%, and assets under management were circa $1.89 billion as of November 10, 2022. That follows negative net fund flows over the past year of about -$350 million (see below).
ETFDB.COM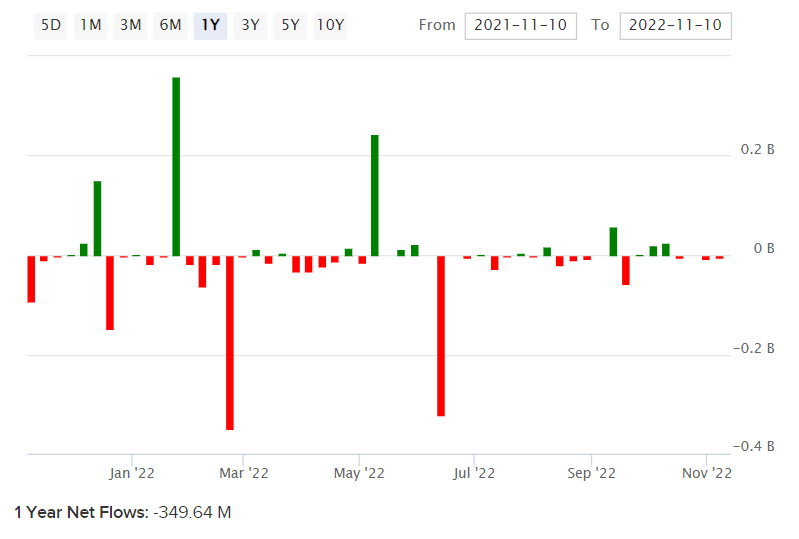
Investor appetite for riskier tech stocks has soured in recent times on the back of elevated inflationary pressures, which have resulted in tighter monetary policy. The economic environment has been weakening, with recessionary risks mounting. With markets leading the economy anywhere from 6-12 months on average, this has resulted in a turn in risk sentiment firmly to the downside. However, with inflationary pressures potentially easing now, it is possible that the market has already formed a local bottom in this cycle.
RYT’s equal-weighted methodology enables investors to get exposure to economically sensitive technology stocks without having to worry about high concentration risk. RYT’s benchmark index, which it seeks to replicate, had 75 constituents per the benchmark’s most recent factsheet as of October 31, 2022. However, each position represented less than 2% of the index, and similarly, even the largest positions within RYT’s portfolio represent less than 2% of the fund.
RYT is therefore a “cleaner” play on U.S. technology, and with the average recession perhaps being imminent as of Q4 2022 (see Fidelity research below, which I think is instructive) and being less than 12 months in duration on average, it is possible that technology stocks will be a strong place to be over the next 12 months. Markets tend to lead the real economy by 6-12 months.
Fidelity.com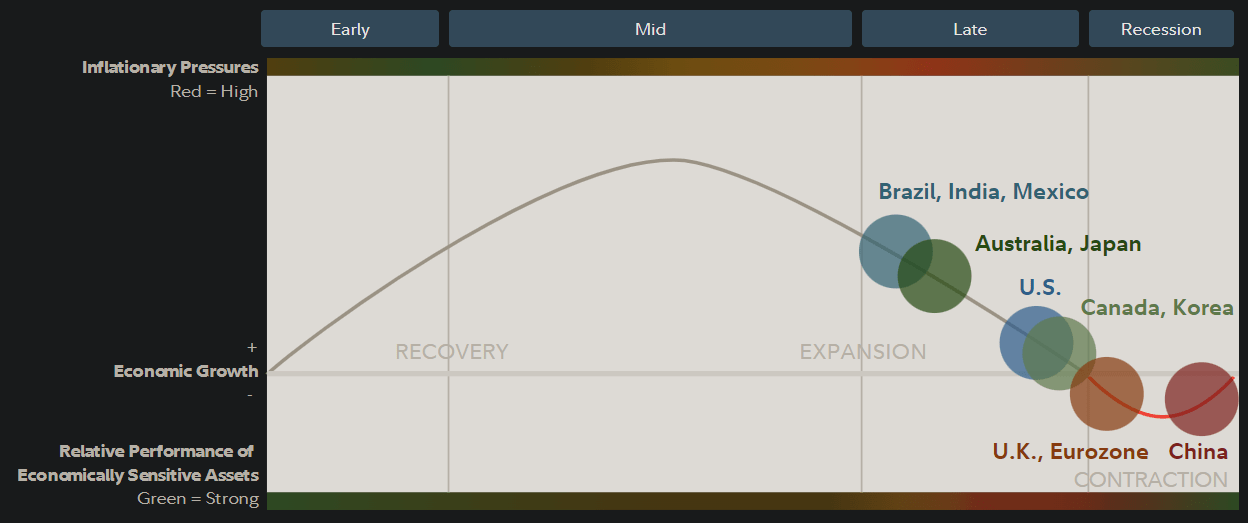
Using RYT’s benchmark as a proxy, with figures to October 2022 month-end, the portfolio’s trailing and forward price/earnings ratios were a reported 20.97x and 17.62x, respectively. The price/book ratio was 4.64x, with a dividend yield of 1.17%. This implies a forward return on equity of roughly 26%, and a dividend distribution rate of almost 25%. Morningstar provide us with a three- to five-year earnings growth rate of 10.63%.
While I usually either assume no buybacks or buyback rates on par with the broader index (about 58% as of recent), I decided to fact-check the buyback rate for RYT looking at the portfolio’s top 10 positions as below. The average buyback rate relative to operating income is about 47% on a total basis (median: 43%).
Author’s Calculations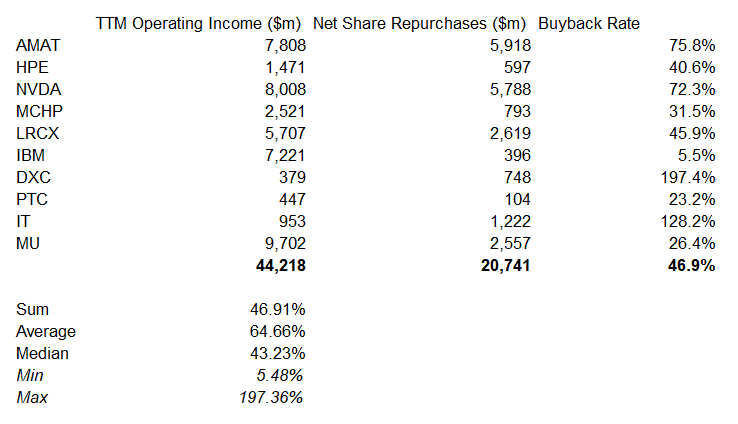
However, smaller companies in the portfolio are likely to have (on average) lower buyback rates (i.e., companies well underneath the top 10), while buyback programs will change over time and are inherently unpredictable in the long run. Therefore, I am going to assume a buyback rate of about 30%, which seems fair. Further, I will assume the average return on equity matures, dropping from the current 26% to about 20% by year six. The result is that my three- to five-year average earnings growth rate is about 8-10%, vs. Morningstar’s consensus of 10.63%, making my forecast possibly slightly conservative but roughly in line with analyst estimates. The projected IRR on these assumptions is just over 9%.
Author’s Calculations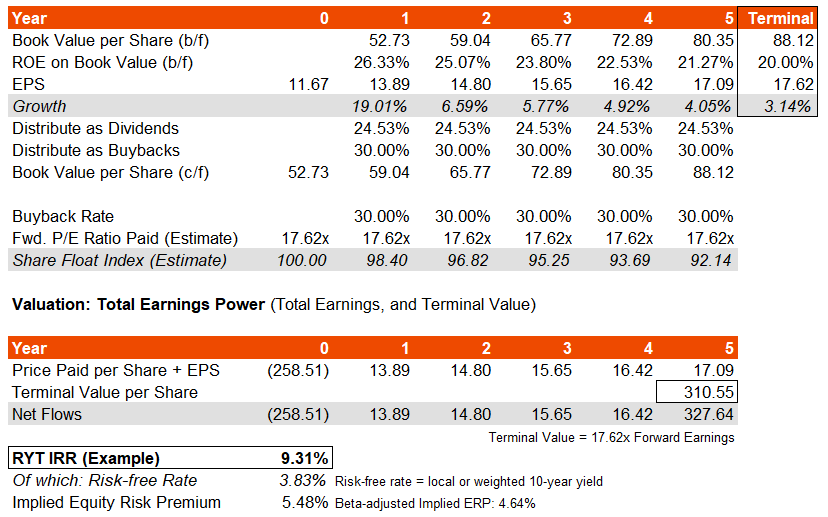
With a U.S. 10-year yield of about 3.83%, this suggests a healthy underlying equity risk premium of about 5.48%, or 4.64% on a beta-adjusted basis (RYT’s historical beta is about 1.18x). I would suggest that RYT looks fairly valued. Tech stocks do however often fetch stronger earnings multiples (i.e., lower equity risk premiums), and therefore I would suggest that the cost of equity might be lower than 9.31% (my IRR estimate above); perhaps something closer to an ERP of 4.2-5.5% without a beta adjustment. That would imply upside of between 0-15% or so on valuation alone, coupled with a base IRR potential of just over 9% per annum over the next few years.
Tech stocks have historically performed well, and RYT’s equal-weighting methodology is lower risk than the more conventionally popular tech stock ETFs. Being able to buy into a tech stock portfolio at a fair valuation for the long run seems attractive, especially if the market has potentially just passed a long-term bottoming process prior to the next business cycle. Therefore, while I would not take an extremely bullish view, I think it makes sense to take a bullish stance for the long run at this current juncture in November 2022.
Be the first to comment