

Baris-Ozer/iStock via Getty Images
I’ve covered several covered call ETFs in the recent past. In this article, I’ll be comparing two of the more popular of these, the Global X S&P 500 Covered Call ETF (NYSEARCA:XYLD) and the Global X Russell 2000 Covered Call ETF (NYSEARCA:RYLD).
Both are broadly similar choices, offering investors strong distribution yields and potential outperformance during flat markets, but suffering from comparatively weak capital gains, and should underperform during bull markets, and in the very long-run. Both are reasonable investment opportunities, and particularly appropriate for income investors and retirees willing to forego long-term total returns for strong distributions.
Although both are broadly similar choices, RLYD’s stronger distribution yield and cheaper valuation make the fund a slightly stronger investment opportunity, in my opinion at least.
Strategy Comparison – Tie
Both funds have broadly similar strategies.
XYLD invests in S&P 500 constituents, and sells covered calls on the entirety of its holdings.
RYLD invests in Russell 2000 constituents, and sells covered calls on the entirety of its holdings.
Selling a covered means selling most potential capital gains for cash, which is then returned to shareholders in the form of dividends. Potential capital losses remain unchanged.
Selling covered calls has significant implications for the funds, their characteristics, and expected performance. As both funds sell covered calls on the entirety of their respective holdings, the implications are mostly same for both funds. As such, both funds are broadly similar investment opportunities, with broadly similar characteristics. There are some differences, these are not identical funds, but the similarities outweigh said differences.
Holdings Comparison – XYLD Clear Winner
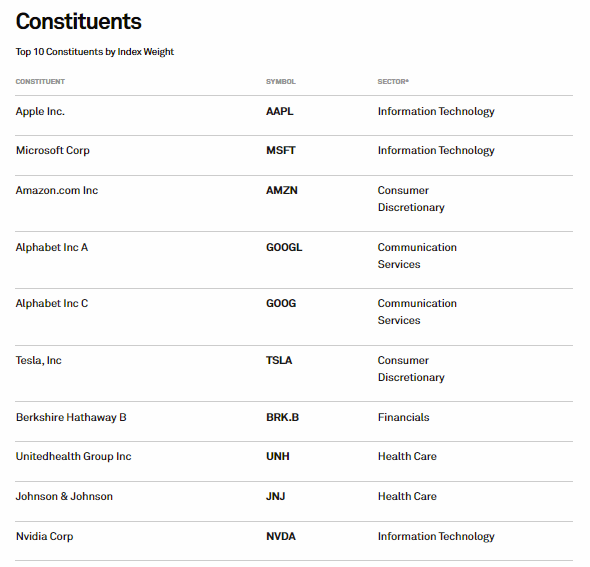
XYLD invests in S&P 500 constituents. The S&P 500 index is the most well-known U.S. equity market index, and includes the 500 largest U.S. equities subject to a basic set of quantitative criteria. The index is incredibly well-diversified, with exposure to all relevant industry segments, and to most of the investable equity market by market-cap. Importantly, the index does not include small-caps, and is overweight tech mega-cap stocks, including Apple (AAPL) and Microsoft (MSFT). Sector weights and largest holdings are as follows.
S&P Indices S&P Indices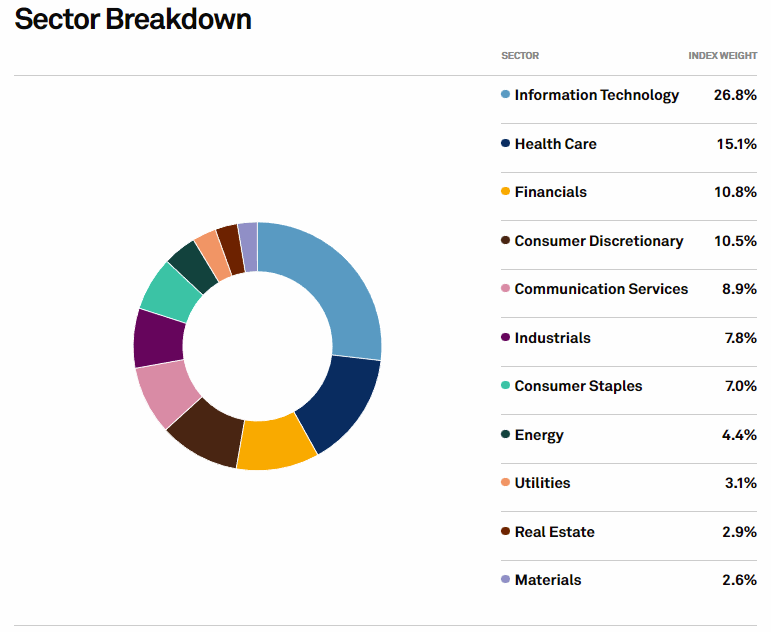
RYLD invests in Russell 2000 constituents. The Russell 2000 index is a U.S. small-cap equity segment benchmark. The index starting universe is the 3000 largest U.S. equities by market-cap, subject to a basic set of quantitative inclusion criteria. The index excludes the largest 1000 of these 3000 equities, and includes the bottom 2000. The end result is 2000 small-cap U.S. equities, from all relevant industry segments. The index specifically excludes all relevant large-cap equities, and most relevant mid-cap equities. These account for most of the U.S. equity market by market-cap. As such, the index cannot be said to track the performance of the broader U.S. equity market. It only includes small-caps, which are not necessarily reflective of the broader market. Sector weights and largest holdings are as follows.
FTSE Russell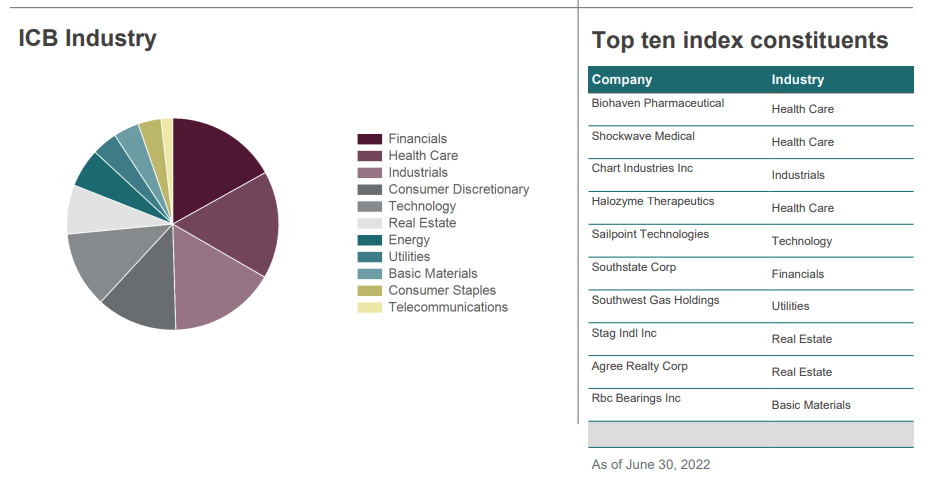
As should be clear from the above, although both funds are reasonably well-diversified, the S&P 500 is a broader, more diversified index, and much more reflective of U.S. equity markets than the Russell 2000 index. S&P 500 constituents are also generally safer, higher-quality holdings than Russell 2000 constituents, as larger corporations tend to have stronger financials and balance sheets, proven business models, and more diversified revenue streams. XYLD tracks the broader S&P 500 index, while RYLD tracks the narrower Russell 2000 index.
Due to the above, the S&P 500 index tends to be more stable, less volatile than the Russell 2000 index. The same applies for XYLD and RYLD.
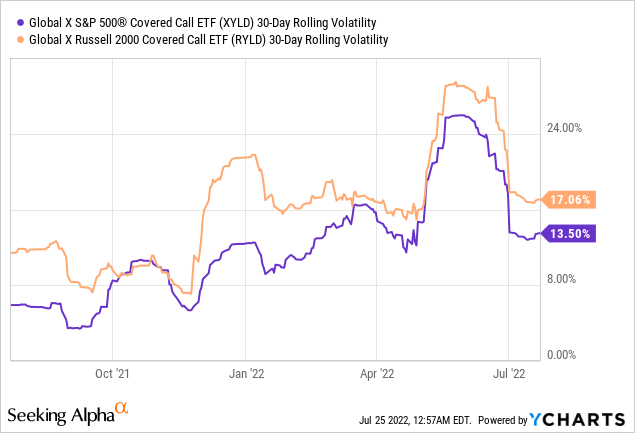
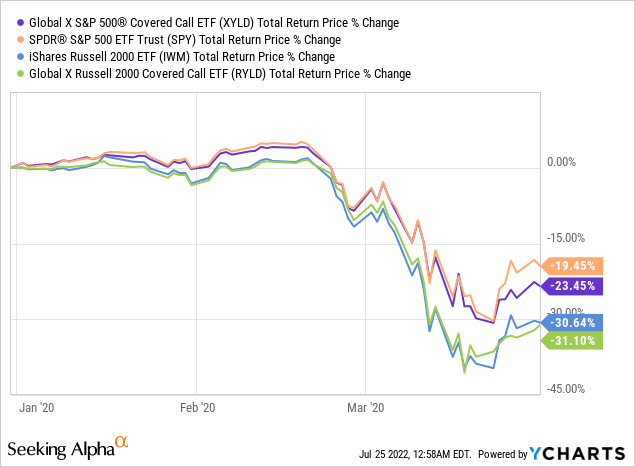
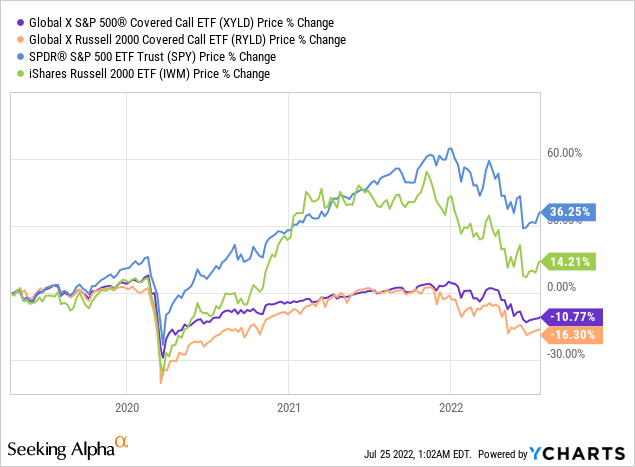
At the same time, the S&P 500 index tends to outperform the Russell 2000 index during downturns and recessions. That was the case during 1Q2020, the onset of the coronavirus pandemic, for both the indexes and the funds in question.
XYLD’s more diversified holdings is the fund’s most significant advantage relative to RYLD, and an important benefit for shareholders. In my opinion, RYLD is still the broadly superior investment, although some investors might choose to focus on XYLD on diversification and risk-reduction grounds.
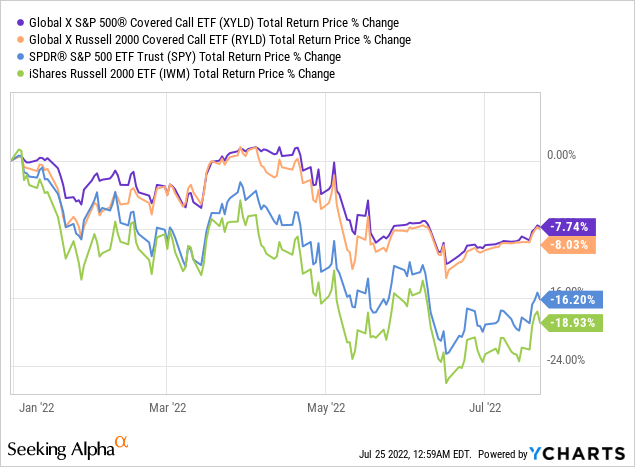
As a final point, as XYLD focuses on the S&P 500 index, it outperforms when said index outperforms, as has been the case YTD.
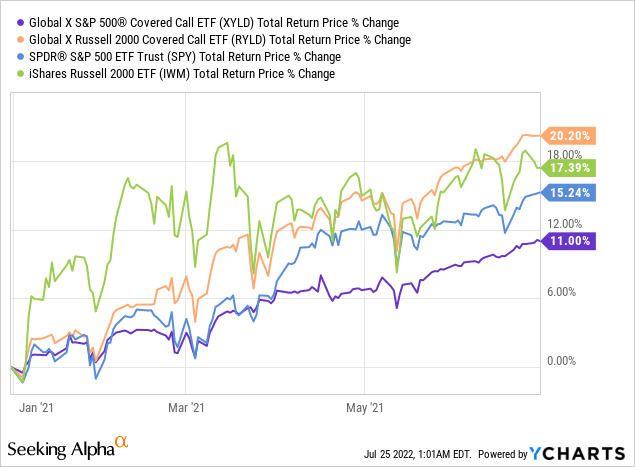
At the same time, RYLD outperforms when the Russell 2000 index outperforms, as was the case during the first half of 2021.
Capital Gains and Losses Comparison – Tie
Selling a covered means selling most potential capital gains for cash, while downside potential remains unchanged. As such, both funds should see little in capital gains during bull markets, but average capital losses during bear markets. The combination means share prices should steadily drift downwards, while most equity indexes see long-term capital gains. This has been the case since inception for both funds, as expected. RYLD’s losses were moderately higher, as small-caps have underperformed for quite a few years.
Both see comparatively low capital gains during bear markets, and consistent, albeit low, long-term capital losses. These are significant negatives for both funds and their shareholders. Although RYLD’s capital losses have been moderately higher than those of XYLD since inception, I have no reason to believe that this will continue to be the case moving forward. As such, both funds score equally as badly in this regard, at least on a forwards-looking basis.
Distribution Yield Comparison – RYLD Winner
Selling a covered means selling most potential capital gains for cash, which is then distributed to shareholders as dividends. Selling covered calls generates a lot of cash, which significantly boosts yields for both funds. RYLD currently yields 12.2%, while XYLD yields 11.7%. Both are strong yields, much higher than those of most broad-based equity indexes, and significant benefits for the funds and their shareholders.
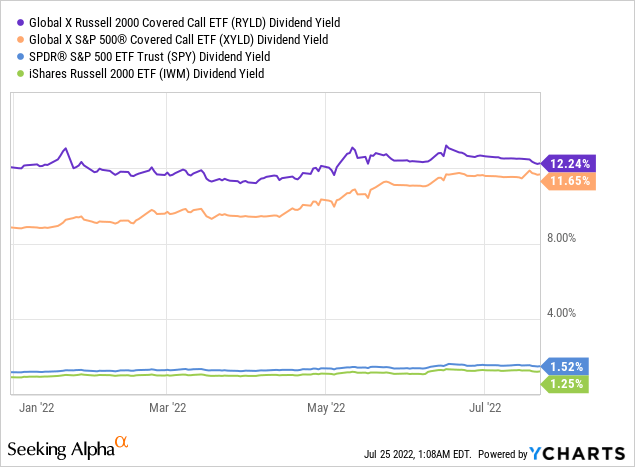
RYLD consistently yields a bit more than XYLD, for two reasons.
First, is the fact that small-cap equities are very volatile, and investors are willing to pay higher premiums for options with more volatile underlying (higher volatility = larger price movements = greater potential profits). Options on the Russell 2000 index could plausibly see outsized gains if investors rotated into small-caps, and investors are willing to pay premium prices for these potential outsized gains. Options on the S&P 500 could obviously see significant gains too, but this is a more remote possibility, as most S&P 500 companies are simply too mature and large to see wild price swings, Tesla (TSLA) notwithstanding.
Second, is the fact that options on the S&P 500 index tend to be a bit cheaper than expected from index fundamentals, as there are quite a few funds and investors selling covered calls on the S&P 500 index, due to the popularity of said index.
RYLD’s comparatively strong 12.2% distribution yield is a significant benefit for the fund and its shareholders, and a small advantage relative to XYLD.
Performance Track-Record – Tie
Both funds have similar total return performance track-records, with functionally identical performance since inception. RYLD underperformed in early 2020, as small-caps underperformed during the coronavirus pandemic. RYLD then outperformed during 2021, as small-caps recovered. It has underperformed for the past few months, as small-caps have underperformed. The net effect of these movements has been functionally zero.
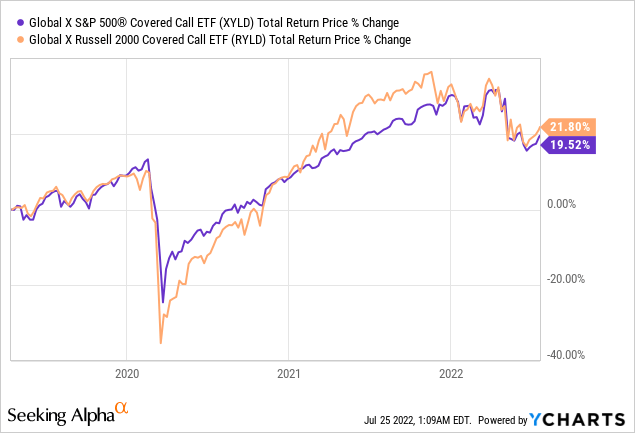
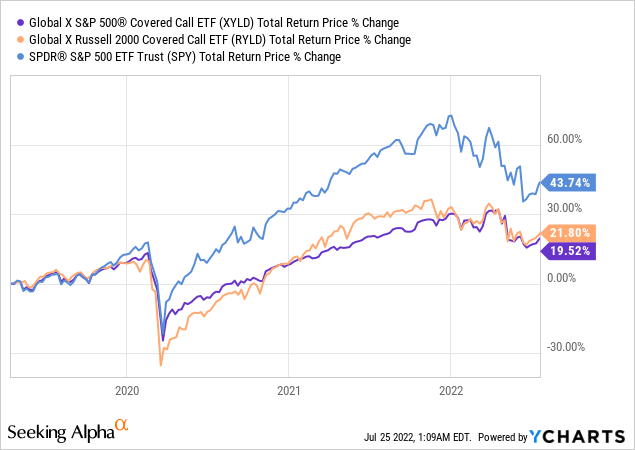
On a more negative note, both funds have underperformed relative to the S&P 500 since inception. In general terms, both funds underperform when capital gains are high, and equity capital gains have been incredibly high for the past couple of years. Equities tend to see strong long-term capital gains, so investors should expect both funds to underperform long-term, a significant negative for both funds and their shareholders.
On a more positive note, both funds have significantly outperformed YTD, as there strong yields help to counteract equity market losses. Share prices are down across the board, capital losses are mounting, but RYLD and XYLD continue to make distribution payments to shareholders, which help cushion the blow of these losses.
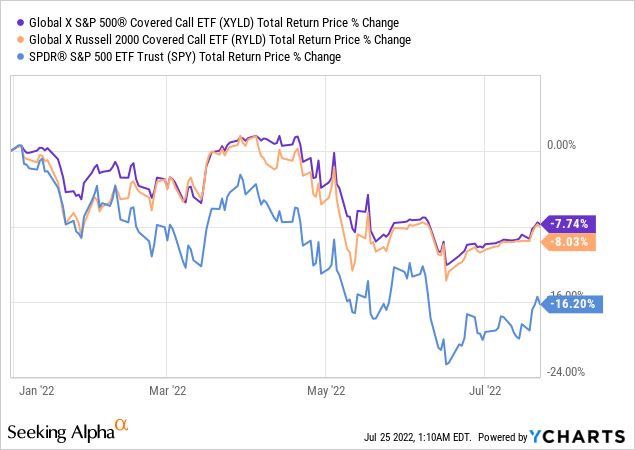
RYLD and XYLD should both continue to outperform if market conditions remain broadly negative, a significant benefit for both funds and their shareholders.
Performance Relative to Index – RYLD Winner
XYLD and RYLD have similar performance track-records relative to each other, but their performance does markedly differ when comparing each fund to its underlying index. XYLD generally underperforms relative to the S&P 500, while RYLD generally outperforms relative to the Russell 2000. This is a subtle, but incredibly important point, and a clear indication that selling covered calls on the Russell 2000 is broadly more effective than doing the same on the S&P 500.
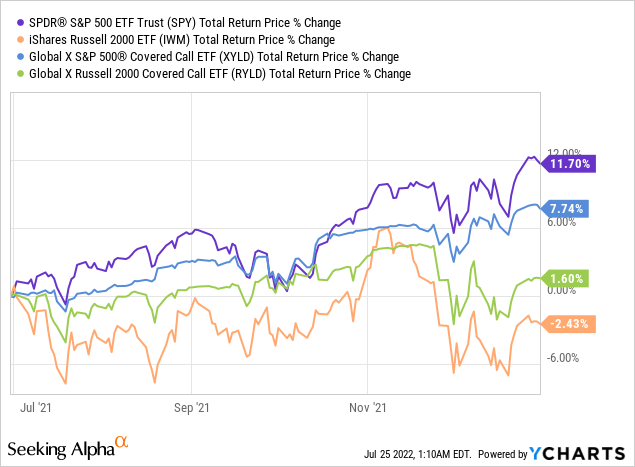
In general terms, the above is true for most market scenarios. As an example, during the second half of 2021 the S&P 500 outperformed relative to the Russell 2000 index. XYLD underperformed relative to the S&P 500, while RYLD outperformed relative to the Russell 2000. RYLD’s performance relative to its index was quite a bit stronger than that of XYLD.
During the first half of 2021, the Russell 2000 index outperformed relative to the S&P 500. XYLD underperformed relative to the S&P 500, while RYLD outperformed relative to the Russell 2000. RYLD’s performance relative to its index was quite a bit stronger than that of XYLD.
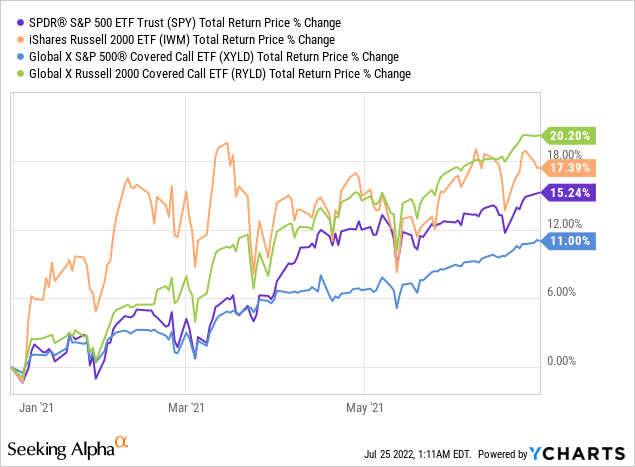
In both cases, XYLD underperformed relative to the S&P 500, its underlying index. Blue line below purple line.
In both cases, RYLD outperformed relative to the Russell 2000, its underlying index. Green line above orange line.
The above has a relatively simple explanation.
XYLD’s covered calls are sold for comparatively low prices, as there are lots of funds and investors selling calls on the S&P 500 index, due to the popularity of said index. XYLD’s covered calls generate relatively little in cash, which results in the fund’s comparatively low distribution yield, and consistent underperformance relative to its index.
RYLD’s covered calls are sold for comparatively high prices, as investors are willing to pay premium prices for options of volatile securities / indexes, due to the potential for outsized profits, and due to the relatively low supply of options on the Russell 2000 index. RYLD’s covered calls generate above-average cash, which results in the fund’s comparatively greater distribution yield, and consistent outperformance relative to its index.
The above is a significant positive for RYLD and its investors, but has, in practice, had a muted impact on the fund’s performance, as small-caps have significantly underperformed for years. RYLD has still managed to match the performance of XYLD since inception, outstanding results considering underlying index performance.
In my opinion, insofar as the Russell 2000 at least matches the performance of the S&P 500, RYLD should outperform relative to XYLD.
Valuation Comparison – RYLD Winner
Finally, RYLD’s valuation is quite a bit cheaper than that of XYLD. RYLD sports a PE ratio of 12.8x and a PB ratio of 1.9x, both moderately cheaper than XYLD’s 17.0x and 3.2x ratios, respectively.
Index Providers – Chart by author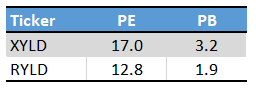
In most cases, small-caps trade with cheaper valuations than large-caps, due to their greater level of risk. Nevertheless, as per J.P. Morgan, small-caps currently trade with slightly cheaper valuations than their historical average, while large-caps trade with moderately more expensive valuations than their historical average. Small-caps are generally cheaper than large-caps, but the gap is quite a bit larger today than in the past.
J.P. Morgan Guide to the Markets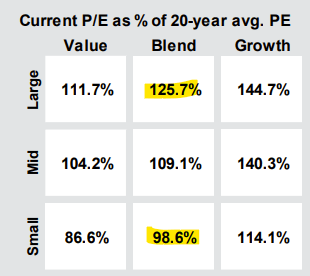
RYLD’s competitive valuation is a key advantage relative to XYLD, and one which could lead to significant, market-beating returns in the coming months.
Conclusion – Similar Choices, but RYLD is Stronger
RYLD and XYLD are both covered call index ETFs. Both funds offer investors strong distribution yields and potential outperformance during flat markets, but suffer from comparatively low long-term capital gains, total returns, and significant underperformance during bull markets. Although the funds are quite similar, RYLD’s stronger yield and cheaper valuation make it the broadly superior investment, in my opinion at least.
Be the first to comment