

Daniele Schneider/Photononstop via Getty Images
The Dow Jones Global ex-U.S. Select Real Estate Securities Index (NYSEARCA:RWX) is a passively managed vehicle designed for those investors who are for whatever reason skeptical of the U.S. REITs and prefer larger exposure to international real estate, principally to Japan, the U.K., and Singapore in the current version.
Though the theme might seem exceedingly lucrative over the long term and worth buying into, while real estate closer home is under strain and U.S. investors have reasons to look elsewhere for value, there are reasons to steer clear of RWX and its peers.
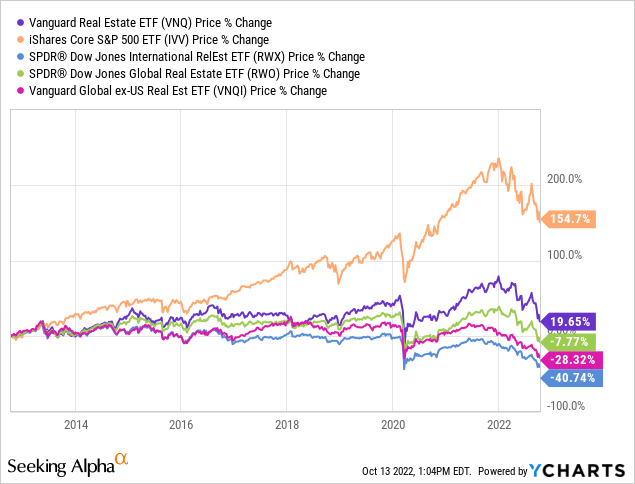
- First, RWX was not an especially robust investment in the past, with the 10-year total returns being below both the iShares Core S&P 500 ETF (IVV) and Vanguard U.S. Real Estate ETF (VNQ), with steeper drawdowns, partly owing to FX headwinds.
- Second, the FX factor, capital scarcity (due to higher interest rates), and recession risks can make its already lackluster performance this year even worse. Just recently, fresh U.S. CPI data was released. And these figures spell trouble for RWX. More on that shortly.
A closer look at the RWX strategy
RWX’s investment strategy is based on the Dow Jones Global ex-U.S. Select Real Estate Securities Index, which is a small fraction of the S&P Global Broad Market Index. The selection universe for the benchmark consists of both REITs and REOCs (real estate operating companies) except for the U.S. based ones. Owing to float-adjusted market cap weighting, the most generously valued players tend to climb to the very top of the index and RWX basket. Though the benchmark is reviewed quarterly, the fund has a rock-bottom turnover of just 8%, which investors who prefer to own more homogeneous portfolios would likely appreciate.
Risks are aplenty
So what are the risks investors should consider at this juncture? In short, they are the ripple effects of inflation in the U.S. and across the globe manifesting in higher rates and weaker currencies that stifle investment, U.K. economic turmoil, the ultra-weak yen, etc.
As I have already warned in my recent article on the Invesco MSCI Sustainable Future ETF (ERTH), U.S. inflation surprises could send shockwaves through risky investments. Yet staid and boring assets could also face devaluation, as inflation means higher interest rates necessary to tame it, and rate-sensitive industries that depend on influxes of fresh (and, ideally, cheap) capital would inevitably suffer. And with a U.S. core CPI at a 40-year high, a 75 bps hike is in the cards.
Turning to the portfolio holdings, RWX currently has around $453 million in AUM and 141 holdings, with REOCs accounting for more than a quarter of the net assets, followed by industrial & office REITs like Britain’s SEGRO plc (OTCPK:SEGXF).
Created by the author using the data from the fund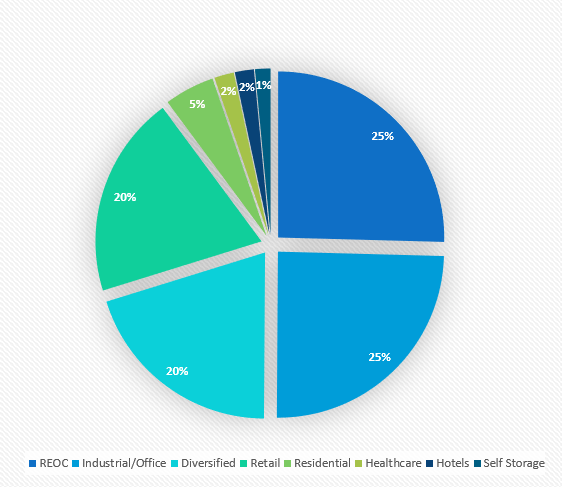
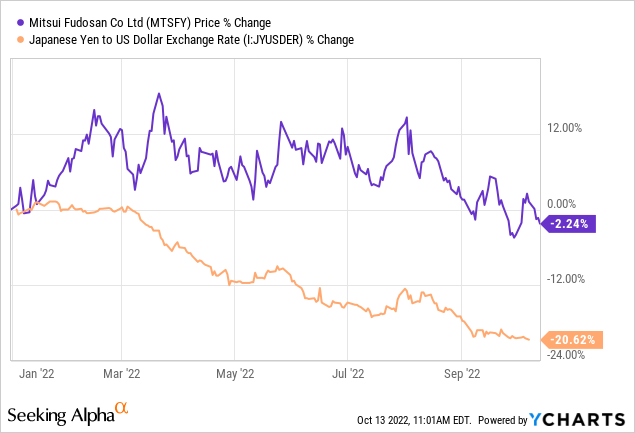
Tokyo-listed Mitsui Fudosan (OTCPK:MTSFY), a heavyweight real estate developer, is the fund’s largest investment at the moment, with ~5.3% of the net assets. It should be noted that the company has a versatile, globally diversified portfolio; for example, its U.K. subsidiary will contribute to the transformation of the ‘South Molton Triangle’ in London’s Mayfair by partnering with Grosvenor, an established name in Britain’s real estate development. Overall, the company has a target to increase its overseas income to 30% by around 2025 from 12.4% in FY2021.
Anyway, Japan accounts for close to 34% of RWX’s net assets, thus exposing the ETF to the meaningful yen risk. Mitsui Fudosan has rewarded its investors generously this year, with the price return being in excess of 24% in Tokyo. Yet when it comes to the FX factor, adjusted for JPY/USD rates, the results look less compelling. Investors in MTSFY, the U.S.-quoted ADR, are down by almost 2%, which is the direct consequence of the Bank of Japan’s reluctance to raise rates to prop up the ailing national currency. And there is no guarantee the JPY has bottomed.
Next, the U.K. question.
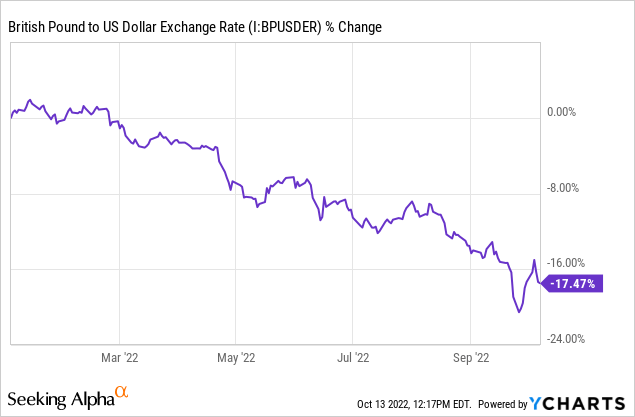
The economic turmoil in the country partly supervening from the energy crisis has not only resulted in the pound sterling depreciating steeply but has also taken its toll on Britain’s typically staid property market, which was one of the most attractive and safest investing destinations for decades, especially when it comes to London’s luxury segment. Yet even the high-end property demand and prices are reflecting the repercussions of the crisis, as the recent report from LonRes has revealed.
RWX is overweight British real estate companies, with around 12.3% allocated and SEGRO plc being the top investment from the country (~2.7%). Speaking of this property developer, its price has dropped by almost 50% YTD, with red-hot inflation in the country, its impact on interest rates (hence, the cost of capital for developers and the like), and the recession risk (especially assuming the U.K. economy surprisingly contracted in August) being the primary reasons for the decline. Assuming that the pound is down ~17.5% vs. the USD this year, all these have had detrimental effects on the ETF’s returns.
All of the above does not imply the rest of the world is immune, except for a few bright spots, like the Brazilian real which has performed comparatively strongly thanks to the country’s commodity-heavy exports and commitment to the hawkish policy. Yet the fund’s allocation to Brazil is a measly 1.1%.
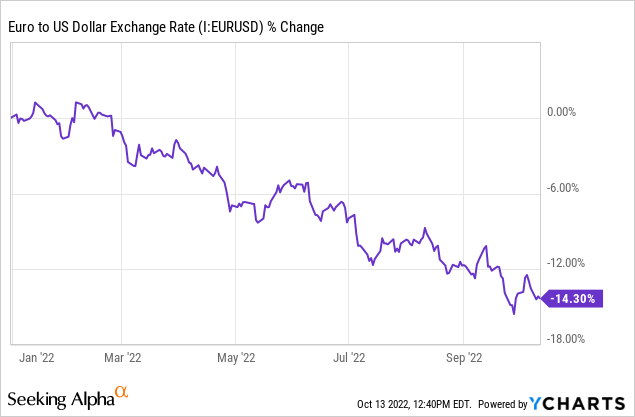
Besides, RWX has meaningful exposure to the euro and all the depreciation risks U.S. inflation spawns for it due to its German (like Deutsche Wohnen), Belgian, French, and other investments.
For better context, the pie chart below demonstrates other countries in the mix.
Created by the author using data from the fund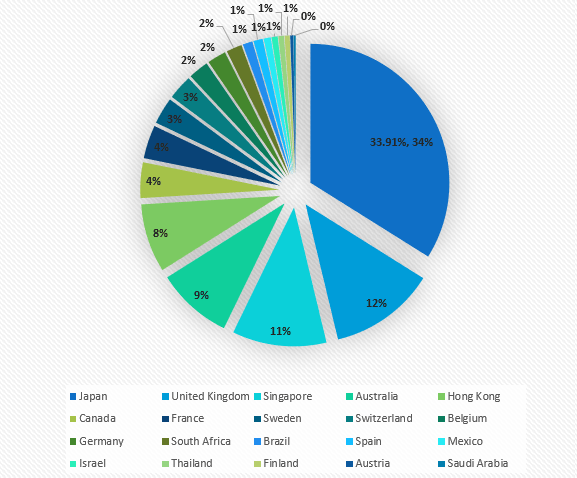
Final thoughts
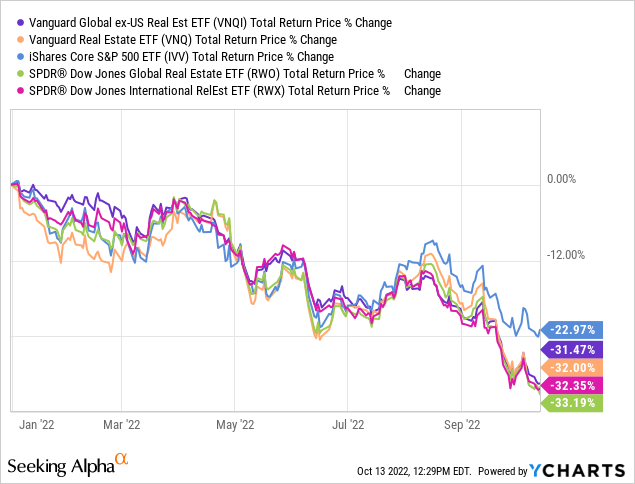
So far, 2022 has been a rough ride for global real estate, with hawkishness and the energy crisis, two interconnected issues, being the major bearish factors. RWX is down by more than 32%.
And U.S. players are certainly no exception. To corroborate, amongst 153 real estate sector players with a Quant rating, just three names have eked out a small gain since the beginning of the year, namely Farmland Partners (FPI), LTC Properties (LTC), and VICI Properties (VICI), while 116 are down by more than 20% as of writing this article.
Does this mean softness in RWX creates a buying opportunity? It should be noted that passive investing in global real estate was not particularly lucrative in the past. Let us look at the November 2010 – September 2022 data, for instance. In the table below, I combined figures for RWX, as well as a few of its peers like the Vanguard Global ex-US Real Est ETF (VNQI) and SPDR Dow Jones Global Real Estate ETF (RWO) and added IVV and VNQ for better context. As can be seen, RWX has the weakest results in the group.
Created by the author using data from Portfolio Visualizer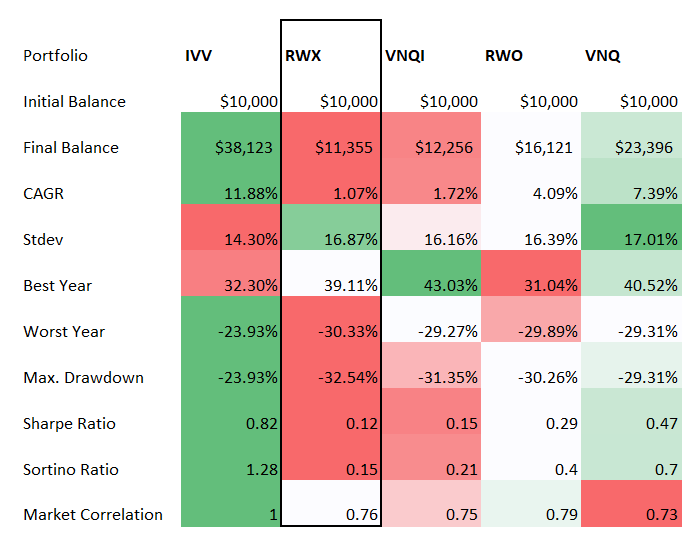
Speaking about the 10-year returns, only VNQ is in the green.
Contrarians most likely would riposte here that the phenomenally strong USD together with sluggishness in real estate supervening from higher rates offers a multi-year opportunity. I concur, an opportunity might exist, but only for risk-tolerant investors prepared to endure more losses in case the market continues pricing in burdensome rate hikes since U.S. inflation has surprised to the upside once again. In this regard, I opt for a Hold rating.
Be the first to comment