


Kwarkot
(This article was co-produced with Hoya Capital Real Estate)
Introduction
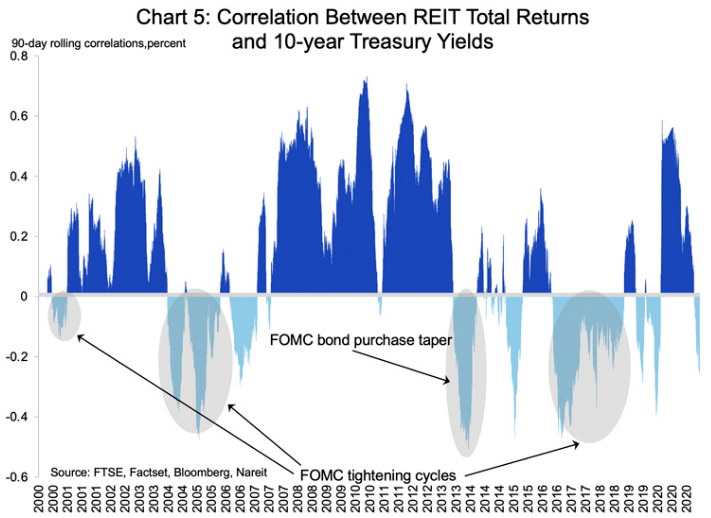
I have been reviewing various REIT ETF investment philosophies recently as I have a desire to increase my exposure to this asset class for both its income potential and inflation-protection possibilities. My supporting reasons for believing REITs are a good investment currently were covered in my ICF Vs. VNQ: It Might Come Down To Manager Preference article, so I will show just one additional chart in support of that supposition. Readers can glean the other article for more details.
reit.com
The data ends in the spring of 2021. If the FOMC continues to tighten, for which some is still expected, it might be early to the REITs party, but being prepared applies to investors too, not just the Boy Scouts!
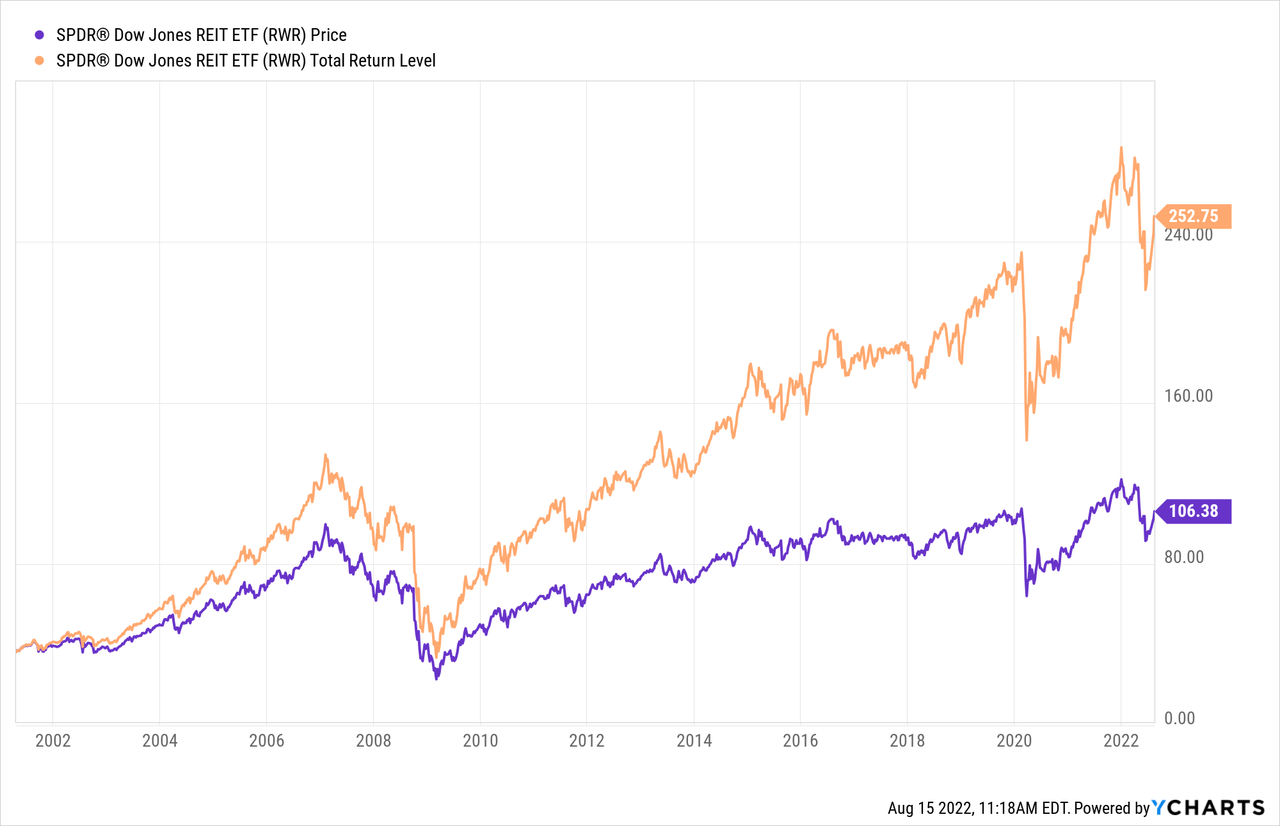
SPDR Dow Jones REIT ETF review
Seeking Alpha describes this ETF as:
SPDR Dow Jones REIT ETF invests in stocks of companies operating across real estate, equity investment trusts (reits), diversified reits, industrial reits, office reits, residential reits, retail reits, health care reits sectors. The fund invests in growth and value stocks of companies across diversified market capitalization. The fund seeks to track the performance of the Dow Jones U.S. Select REIT Index and the S&P 500 Index. RWR started in 2001.
Source: seekingalpha.com RWR
RWR has $1.9b in assets and its TTM yield is 3%. The managers charge 25bps in fees, a 13bps disadvantage to VNQ.
Index review
Dow Jones describes the main underlying index as:
The Dow Jones U.S. Select REIT Index tracks the performance of publicly traded REITs and REIT-like securities and is designed to serve as a proxy for direct real estate investment, in part by excluding companies whose performance may be driven by factors other than the value of real estate. The index is a subset of the Dow Jones U.S. Select Real Estate Securities Index, which represents equity real estate investment trusts (REITs) and real estate operating companies (REOCs) traded in the US.
Source: spglobal.com Index
spglobal.com Index PDF
Index methodology rules include the following. All of these (and more details) are listed in the Methodology PDF.
- The index universe is defined as all companies in the S&P Global Broad Market Index (BMI) that are domiciled in countries categorized as Developed or Emerging markets and classified into the Real Estate Sector, as defined by the Global Industry Classification Standard (GICS®). China A-Shares are ineligible.
- The company must be both an equity owner and operator of commercial and/or residential real estate. REITs must generate rental income from direct ownership and operation of traditional real estate assets. Mortgage, Specialty and other sub-types are excluded.
- Non-constituents must have a minimum float-adjusted market capitalization (FMC) of at least US$200 million at the time of its inclusion. A constituent becomes ineligible if its FMC falls below US$100 million two consecutive quarters.
- Non-constituents must have at least 75% of the company’s total revenue derived from the ownership and operation of real estate assets.
- The indices rebalance quarterly, effective after the close of trading on the third Friday in March, June, September, and December. As part of the rebalancing process, index composition, shares, and Investable Weight Factors (IWFs) are adjusted, if necessary. The reference date for fundamental data is the third Friday of February, May, August, and November, respectively.
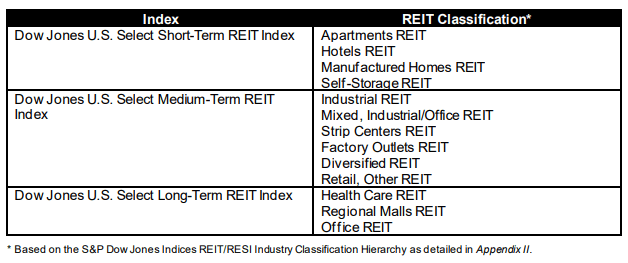
While the Index used covers all three sub-groupings, I thought it interesting that Dow Jones has subdivided REITs into three groups, each with its own index. What is meaningful here is it lists eligible REIT types.
spglobal.com Index Methodology PDF
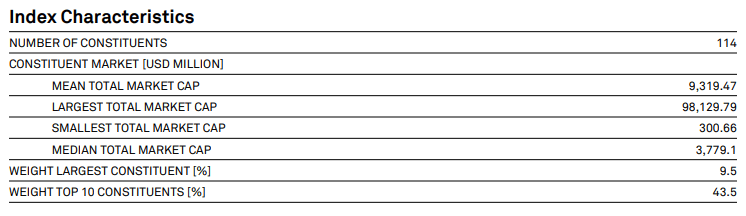
RWR holdings review
The current REIT sector allocations for the 115 holdings are:
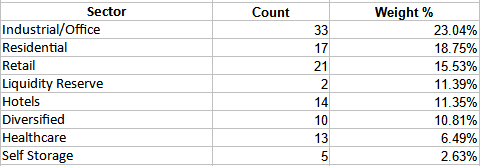
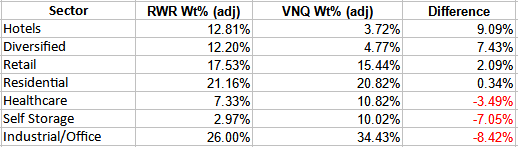
saga.com; compiled by Author
I compare sector weights against VNQ later.
Top 20 holdings
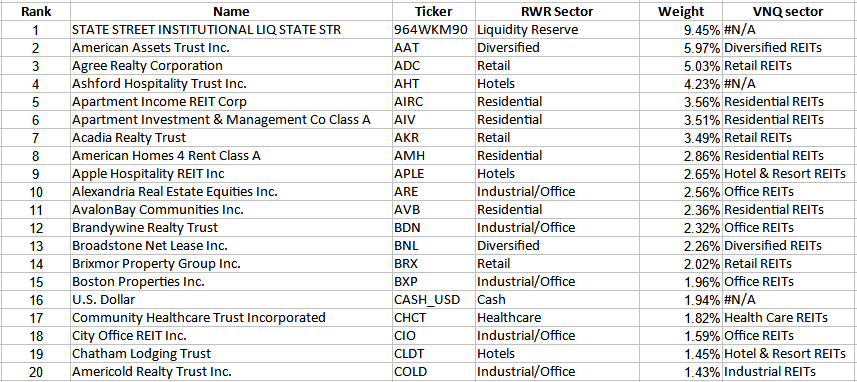
ssga.com; compiled by Author
The Top 10 equate to 43% of the portfolio, with the Top 20 being 62%. Six of the eight sectors appear in the Top 20 holdings. One major difference between RWR and VNQ is this ETF excludes Cell Tower REITs! I included a cross-reference to what sector, if held, VNQ assigns each REIT; there are differences.
RWR distributions review
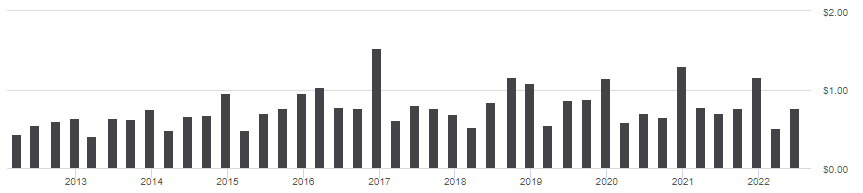
seekingalpha.com RWR DVDs
As I have seen elsewhere, distributions fluctuate with no real upward direction. Even so, Seeking Alpha scored this feature as a “B”, probably on the strength of its yield and payment longevity.
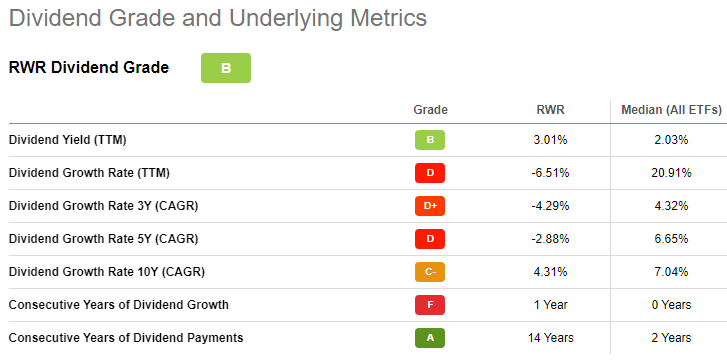
seekingalpha.com RWR scorecard
The other grades Seeking Alpha calculates came out as the following, with the Quants rating RWR as a “Buy”.
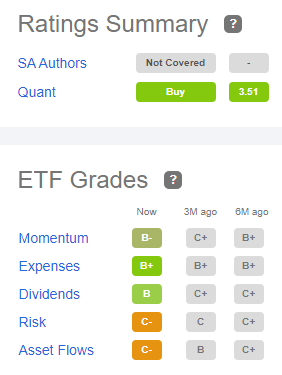
seekingalpha.com RWR ratings
Comparing ETFs
Being that the Vanguard Real Estate ETF (VNQ) is probably, by far, the largest US broad-based REIT ETF, I will use it as a comparison to RWR to see if I can decipher why its performance lags that of VNQ (and ICF for that matter). For those not familiar with VNQ, here is how Seeking Alpha describes this ETF:
The Vanguard Real Estate ETF invests in stocks of companies operating across real estate sectors. It invests in growth and value stocks of companies across diversified market capitalization. It seeks to track the performance of the MSCI US Investable Market Real Estate 25/50 Index. VNQ started in 1996.
Source: Seeking Alpha
VNQ is large at $81b in AUM. The current yield is 2.8% and Vanguard charges only 12bps in fees. For more on VNQ, see my previous comparison article mentioned above.
I will start by looking at basic equity data.
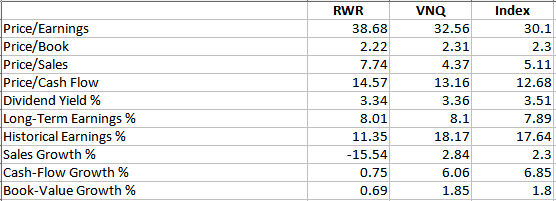
Morningstar.com; compiled by Author
As I found when comparing VNQ to ICF, again all the ratios favor the portfolio held by VNQ. Market-Cap allocations are very close between these ETFs, with over 70% in Large-Cap, about 25% in Mid-Cap, and 5% in Small-Cap.
Holdings comparison

ETFRC.com
All but one REIT owned by RWR is held by VNQ; then VNQ holds an additional 57 REITs. Just over 60% of the portfolio weights overlap.
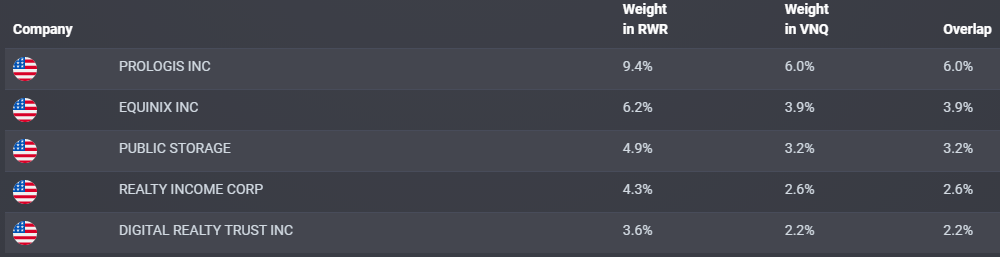
ETFRC.com
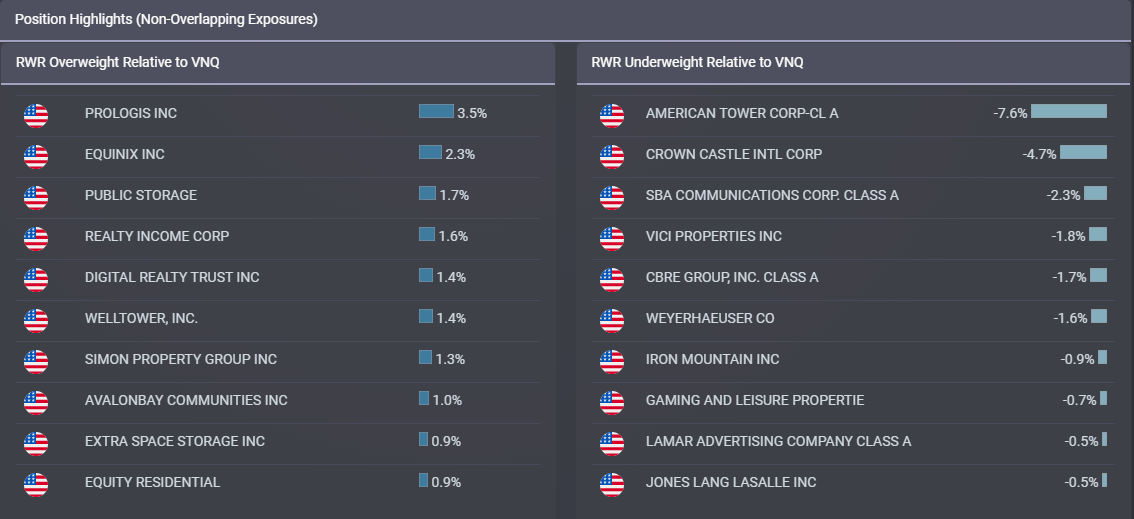
Of some of the largest positions held by RWR, the above shows how those weights compare to the same holding in VNQ. The next chart shows the biggest weighting differences in both directions, first for RWR, then for VNQ.
ETFRC.com
With the two ETFs classifying their holdings by different sector names, I first aligned the tickers using the RWR sector names and came up with a comparison. I adjusted the weights so both equal 100%. The second aligns RWR to VNQ based on VNQ sector names.
Multiple; compiled by Author
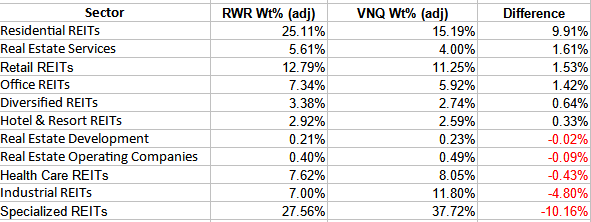
Multiple; compiled by Author
In both analyses, the ETFs hold REITs in sectors where the weights have large differences; some is caused by how each REIT is classified by each ETF. This would have the potential of affecting performance as REIT sectors react differently to changes in the economic picture. The last table shows the 10 largest positions held by VNQ which RWR does not hold due its different index restrictions.
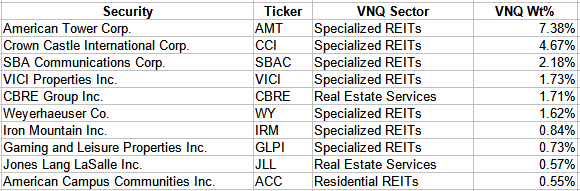
Multiple; compiled by Author
If you want REITs like Cell Tower/Communications, Casinos, and Campus housing, you would need to choose VNQ, not RWR.
Return and risk analysis
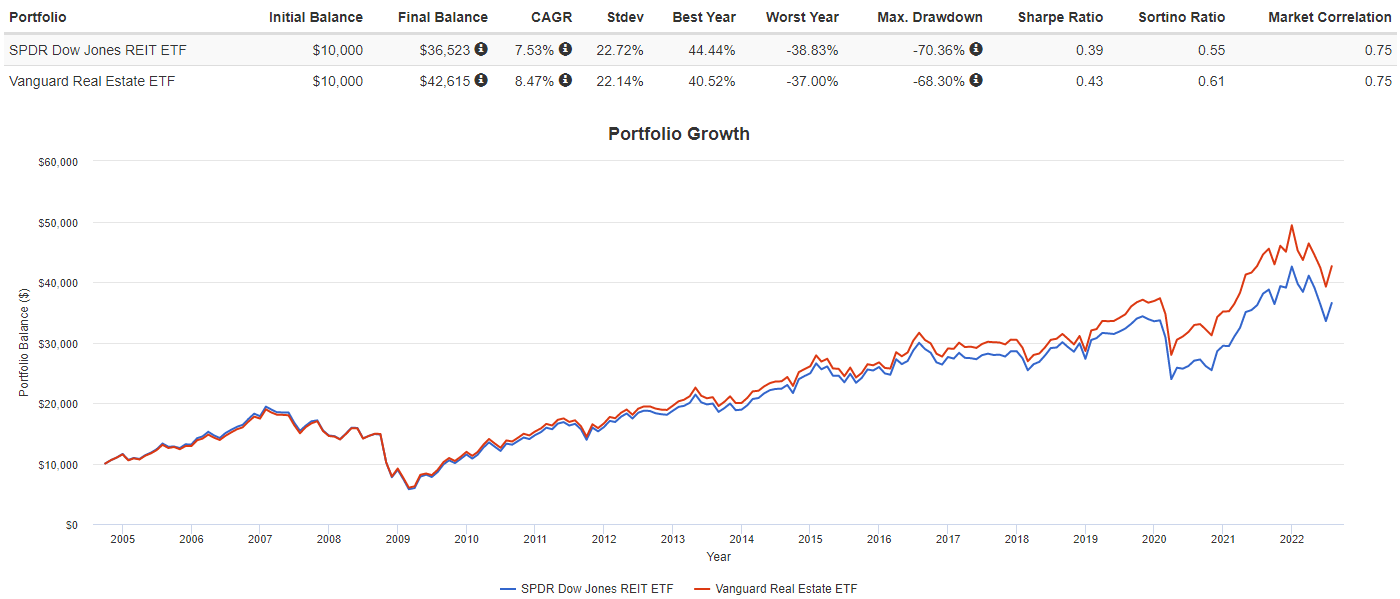
PortfolioVisualizer.com
Since VNQ started in 2004, it has provided a higher CAGR with a lower Std. Dev. than RWR. The difference is 96bps annually. This compares to VNQ only outperforming the iShares Cohen & Steers REIT ETF (ICF) by 27bps. Even when looking at returns over set periods, VNQ is better in all except the 1-year CAGR.

PortfolioVisualizer.com
Portfolio strategy
This article and the prior one only reviewed REITs based on wide coverage of the REITs universe, but there are others with more focused objectives. I have seen lists with over 50 REIT ETFs available to investors. For the more experienced REIT investor, there are more than 225 individual REITs that trade in the US. While REITs have underperformed stocks recently, their long-term record makes them competitive with US or International equities, and bonds as shown in the next charts.
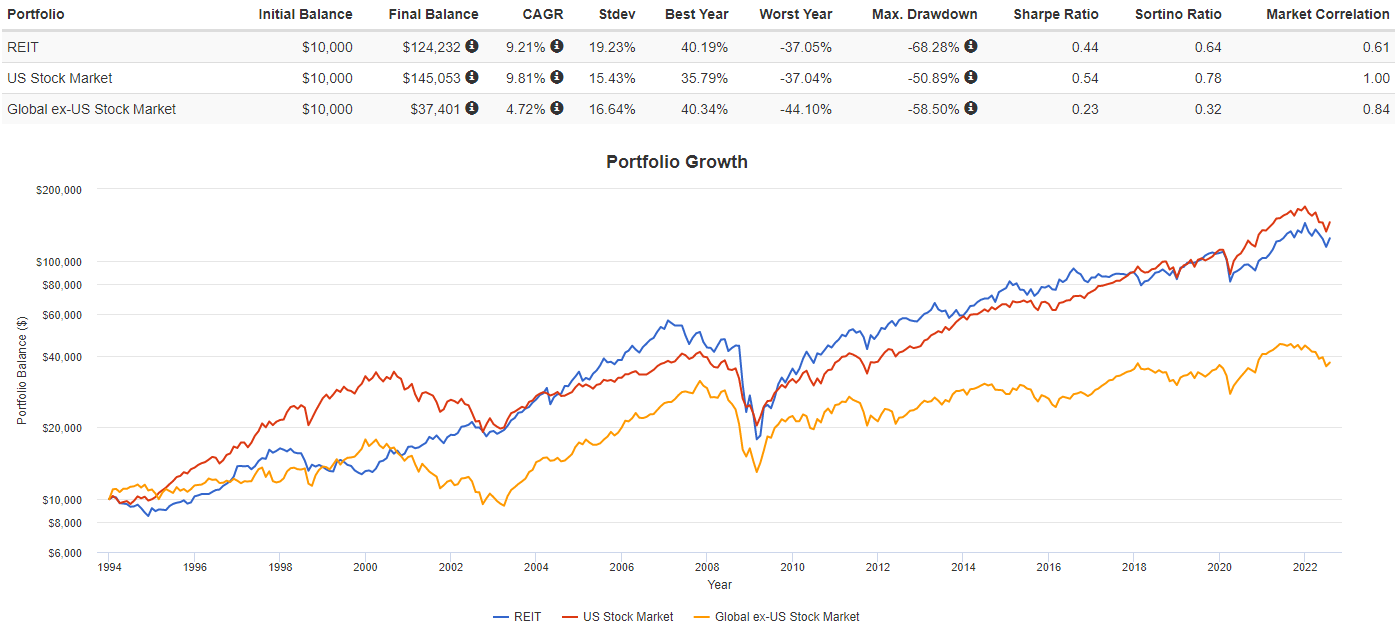
PortfolioVisualizer.com
One useful feature of adding REITs to a portfolio is diversification as they have a .61 correlation to US stocks. Compared to bonds, the superior returns comes with much higher risk. As for diversification, the Total US bond market offsets stocks better.
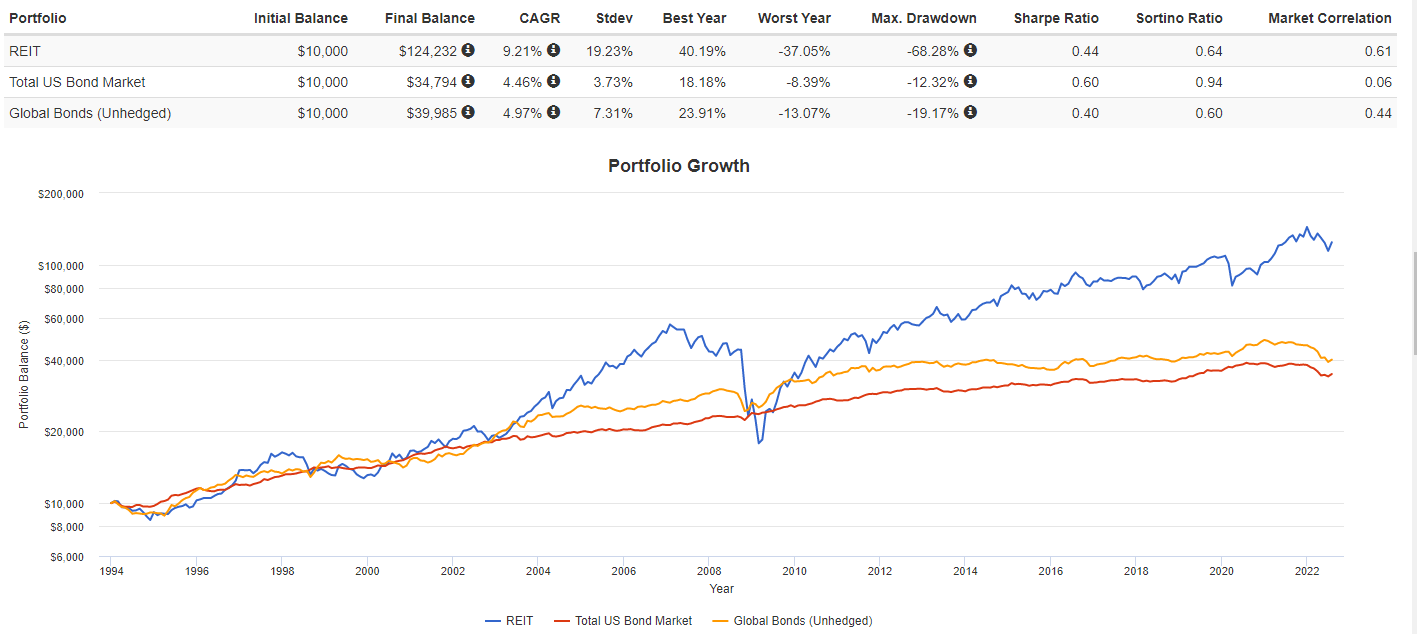
PortfolioVisualizer.com
Final thoughts
Without looking at each holding, from what I can see is that RWR’s more restricted rules have kept the ETF out of REITs, like Cell Towers and Casinos, that have performed better than the average REIT, thus leading to VNQ’s superior returns for investors. An investor’s feeling about those sectors would weigh heavily in deciding which ETF to add to their portfolio.
That said, here is a sampling of the kinds of ETFs that cover all or part of the REITs market, including one international REITs ETF.
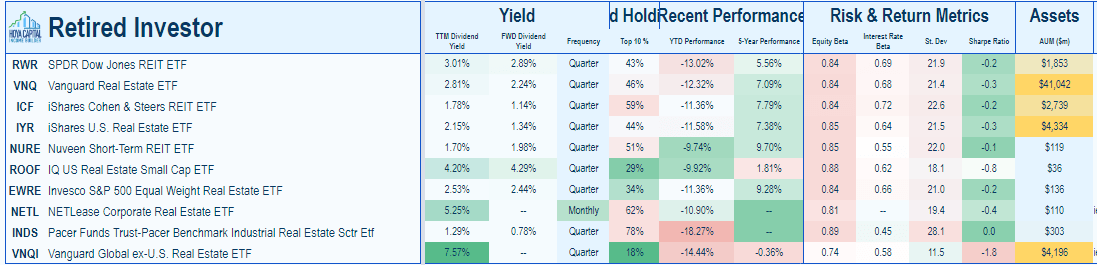
Hoya Capital Income Builder
Here are links to those REITs I have reviewed in the past:
There are popular CEFs that in some cases mix REITs with Preferreds and/or Bonds issued by REITs. Tickers to consider include RNP, RQI, and RFI.
Be the first to comment