


Akacin Phonsawat/iStock via Getty Images
RPM International (NYSE:RPM) is an under the radar company with its hands in many different niches. RPM is organized in 4 different segments: (1) Construction Products Group, (2) Performance Coatings Group, (3) Specialty Products Group, and (4) Consumer.
Within those segments RPM offers a wide array of solutions to both industrial partners and the everyday consumer. While the products they offer aren’t necessarily well-known like an iPhone that doesn’t mean they aren’t valuable. RPM makes roofing systems, flooring solutions, sealing and bonding, various masonry materials including grout and mortar, fire and sound proofing, epoxy resins, caulk, patch and repair products, and the list goes on and on. Essentially if you want to physically build something you’re likely to use some of their products.
Dividend History
Aside from the cash flow coming to be, one of the reasons that I focus on dividend growth investing is that most businesses with a long history of rising dividends are likely to be in the quality camp. It’s more of a first screen to see whether the business (1) has a history of rewarding shareholders and (2) has some competitive advantage that has allowed them to thrive for years.
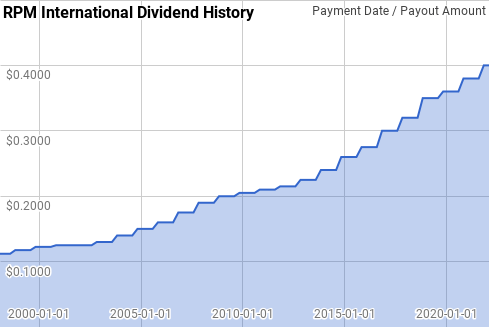
RPM International Dividend History (RPM International Investor Relations)
According to the CCC list, RPM International is a Dividend Champion with 48 consecutive years of dividend growth. Dividend growth has fluctuated over time, as would be expected; however it’s been relatively stable when expanding your timeframe.
Dating back to 1998, RPM has given year-over-year dividend growth that’s ranged from 1.0% to 9.2% with an average and median of 5.5%.
Over that same time there’s been 19 rolling 5-year periods with annualized dividend growth ranging from 3.2% to 7.8% with an average of 5.7% and a median of 5.9%.
There’s also been 14 rolling 10-year periods with annualized dividend growth ranging from 5.3% to 6.2% with an average and median of 5.6%.
The rolling 1-, 3-, 5- and 10-year period annualized dividend growth rates from RPM since 1998 can be found in the following table.
| Year | Annual Dividend | 1 Year | 3 Year | 5 Year | 10 Year |
| 1998 | $0.454 | ||||
| 1999 | $0.475 | 4.74% | |||
| 2000 | $0.493 | 3.68% | |||
| 2001 | $0.500 | 1.52% | 3.31% | ||
| 2002 | $0.505 | 1.00% | 2.06% | ||
| 2003 | $0.530 | 4.95% | 2.48% | 3.17% | |
| 2004 | $0.570 | 7.55% | 4.46% | 3.71% | |
| 2005 | $0.610 | 7.02% | 6.50% | 4.37% | |
| 2006 | $0.655 | 7.38% | 7.31% | 5.55% | |
| 2007 | $0.715 | 9.16% | 7.85% | 7.20% | |
| 2008 | $0.770 | 7.69% | 8.07% | 7.76% | 5.44% |
| 2009 | $0.805 | 4.55% | 7.12% | 7.15% | 5.42% |
| 2010 | $0.825 | 2.48% | 4.89% | 6.22% | 5.29% |
| 2011 | $0.845 | 2.42% | 3.15% | 5.23% | 5.39% |
| 2012 | $0.870 | 2.96% | 2.62% | 4.00% | 5.59% |
| 2013 | $0.915 | 5.17% | 3.51% | 3.51% | 5.61% |
| 2014 | $0.980 | 7.10% | 5.06% | 4.01% | 5.57% |
| 2015 | $1.055 | 7.65% | 6.64% | 5.04% | 5.63% |
| 2016 | $1.125 | 6.64% | 7.13% | 5.89% | 5.56% |
| 2017 | $1.220 | 8.44% | 7.57% | 7.00% | 5.49% |
| 2018 | $1.310 | 7.38% | 7.48% | 7.44% | 5.46% |
| 2019 | $1.410 | 7.63% | 7.82% | 7.55% | 5.77% |
| 2020 | $1.460 | 3.55% | 6.17% | 6.71% | 5.87% |
| 2021 | $1.540 | 5.48% | 5.54% | 6.48% | 6.19% |
Source: Author; Data Source: RPM International Investor Relations
The payout ratio looks at the dividend payment versus either profits or free cash flow and can be used to judge how safe the dividend has been. All else being equal, a lower payout ratio is better as that allows more cushion before the dividend is at risk.
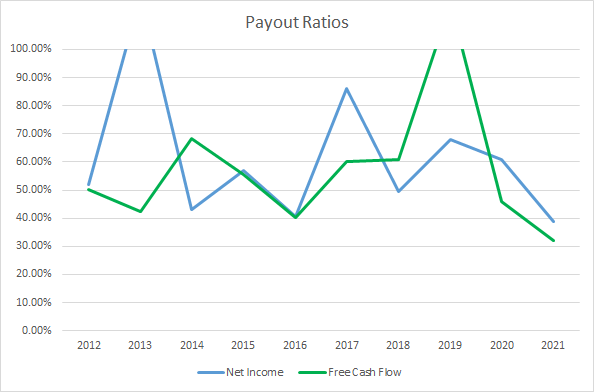
RPM Dividend Payout Ratios (RPM SEC filings)
RPM’s payout ratio, based on both net income and free cash flow, has been quite volatile from year to year. The 10-year average net income payout ratio is 61.5% with the 5-year average at 60.7%. The average free cash flow payout ratios are 57.2% and 63.1%, respectively.
Quantitative Quality
While I like to see a lengthy dividend growth history, which RPM clearly has, I want to make sure to examine the business across several other financial metrics.
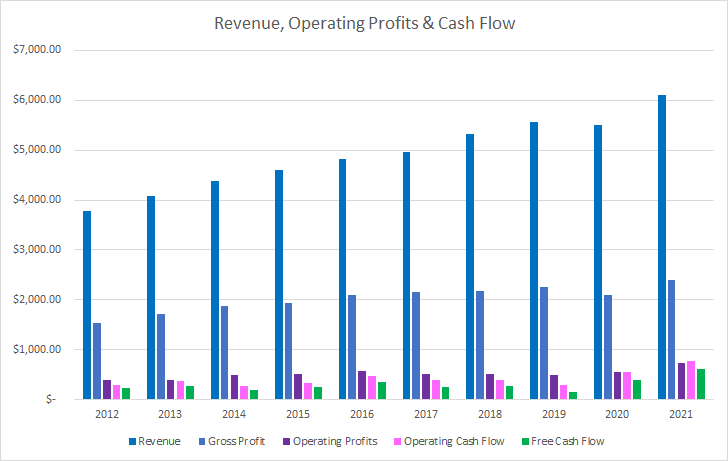
RPM Revenue Profits and Cash Flow (RPM SEC filings)
I expected to see more fluctuation in RPM’s revenue growth; however, I was pleasantly surprised to see FY 2020 being the only year over year decline. Over the last decade, revenues grew 61.7% in total or 5.5% annualized. Meanwhile, gross profits increased 56.1% or 5.1% annualized.
Operating profits improved by 91.7% or 7.5% annualized with operating cash flow rising 159.8% or 11.2% annualized. Best of all was RPM’s free cash flow which increased by 172.7% or 11.8% annualized.
The following chart shows the rolling 5-year period CAGR for RPM’s revenue, gross and operating profits, and operating and free cash flow.
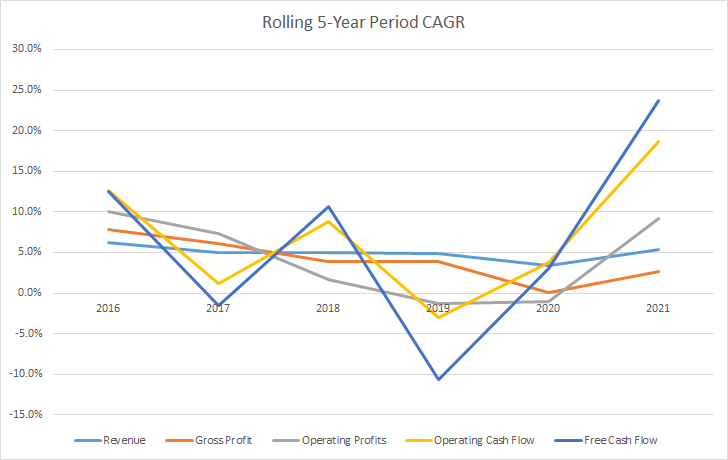
RPM 5 Year Financial CAGRs (RPM SEC Filings)
I want to see stable or rising margins over time. The trend in margins is more important to me than the overall level; however, I do like to see 10% free cash flow margins.
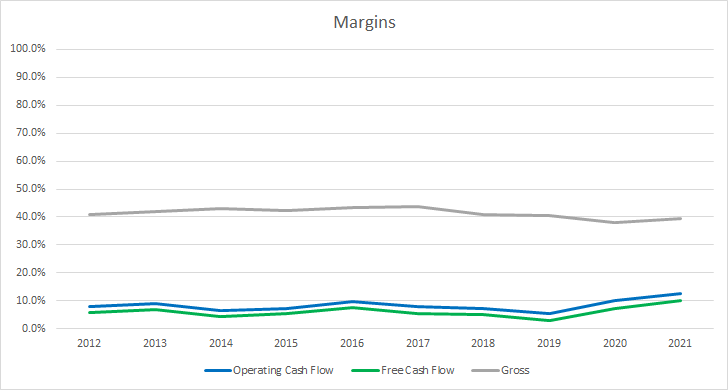
RPM Margins (RPM SEC filings)
RPM’s gross margins have been relatively stable over time although FY 2021 was the second lowest level of the last decade. The 10-year average gross margin for RPM is 41.4% with the 5-year average at 40.5%.
RPM’s free cash flow margins have varied over time as well and don’t meet the 10% level that I prefer to see hitting that mark just once, surprisingly enough in FY 2021. The 10-year average FCF margin for RPM is 6.0% with the 5-year average at 6.1%.
Similarly, I want to see stable or rising free cash flow returns on invested capital over time. The free cash flow return on invested capital tells you how well the business is able to generate excess cash flow compared to its capital base.
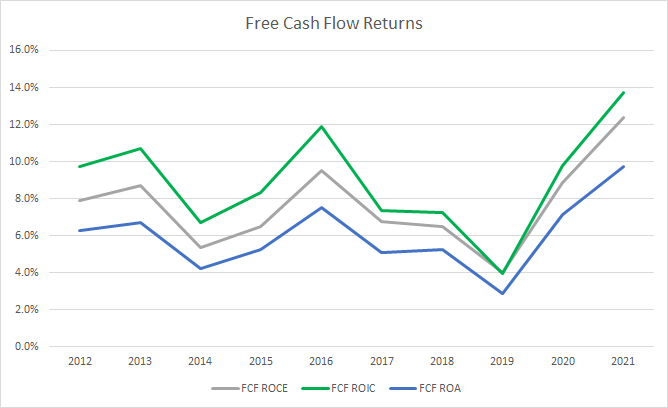
RPM Free Cash Flow Returns (RPM SEC filings)
RPM’s 10-year average FCF ROIC is 8.9% with the 5-year average at 8.4%. RPM’s FCF ROIC fluctuates more than I’d like due to their numerous acquisitions as well as the relatively thin FCF margins so little changes have big impacts.
To understand how RPM uses its free cash flow I calculate three variations of the metric, defined below:
- Free Cash Flow, FCF: Operating cash flow less capital expenditures
- Free Cash Flow after Dividend, FCFaD: FCF less total cash dividend payments
- Free Cash Flow after Dividend and Buybacks, FCFaDB: FCFaD less net cash spent on share repurchases
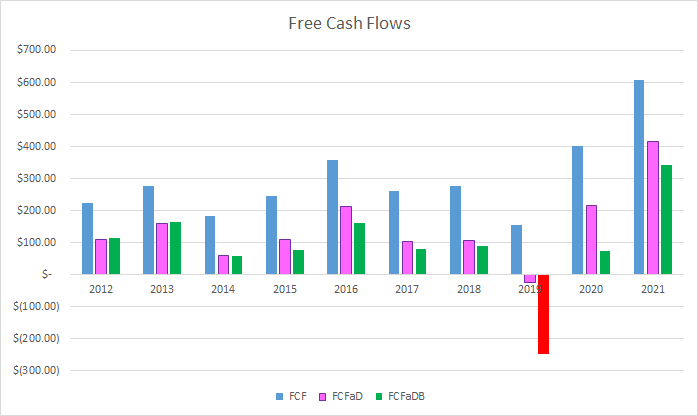
RPM Free Cash Flows (RPM SEC filings)
Over the last decade RPM has generated a total of $3.0 B in FCF. During that same time RPM paid out a total of $1.5 B to shareholders in dividends which puts the cumulative FCFaD at $1.5 B. Additionally, RPM has spent a net total of $0.5 B on share repurchases over that time frame giving a total FCFaDB of $0.9 B.
Historically, RPM has not utilized share repurchases to return additional cash to shareholders. Thanks to the number of acquisitions that have been completed, RPM’s share count is only down 0.2% in total over the last decade. However, RPM has reduced shares outstanding for the last three years potentially suggesting a shift in capital allocation.
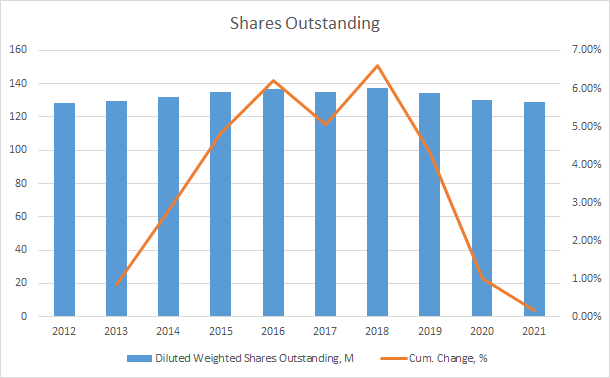
RPM Shares Outstanding (RPM SEC filings)
With a goal of owning a stake in a business for a period measured in years it’s critical that the balance sheet is in adequate shape. I don’t want my equity investment to be hurt from excessive debt.
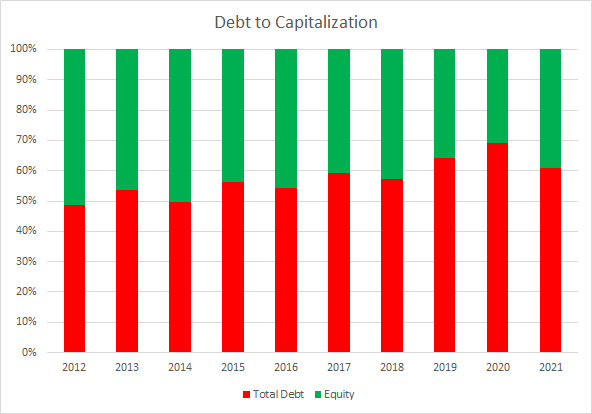
RPM Debt to Capitalization (RPM SEC filings)
RPM’s debt-to-capitalization ratio has slowly been rising over the last decade; however, it’s still within a relatively secure range. The 10-year average debt-to-capitalization ratio for RPM is 57% with the 5-year average at 62%.
I believe the net debt ratios are a better indicator of the leverage imposed on the underlying business. I use the net debt versus -EBITDA, -operating income, and -FCF to see how quickly the business could de-lever should the interest rate environment change.
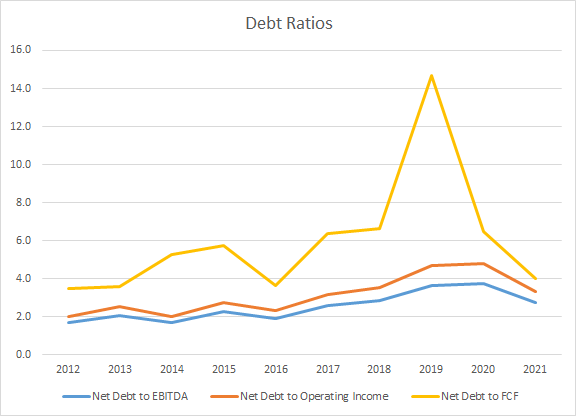
RPM Net Debt Ratios (RPM SEC filings)
RPM’s net debt ratios have all been trending moderately higher during the last decade. The 10-year average net debt-to-EBITDA, net debt-operating income, and net debt-to-FCF ratios are 2.8x, 3.1x, and 6.0x. The 5-year averages are 3.1x, 3.9x, and 7.6x, respectively.
Valuation
When valuing potential investments I utilize several valuation methods that value the business from different perspectives. The methods that I use are the minimum acceptable rate of return (MARR) analysis, dividend yield theory, the dividend discount model, and a reverse discounted cash flow analysis.
A MARR analysis entails estimating the future earnings and dividends that a business will be able to generate. Then you apply a reasonable and conservative terminal multiple at some point in the future and calculate what the expected returns would be. If the expected returns are greater than your minimum acceptable rate of return, then you can proceed with the investment.
Analysts expect RPM to report FY 2022 EPS of $3.62 and FY 2023 EPS of $4.53. They also expect that RPM will be able to show 6.4% annual EPS growth over the next 5 years. I then assumed that RPM would be able to EPS 4.50% annually for the following 5 years. Dividends are assumed to target a 40% payout ratio.
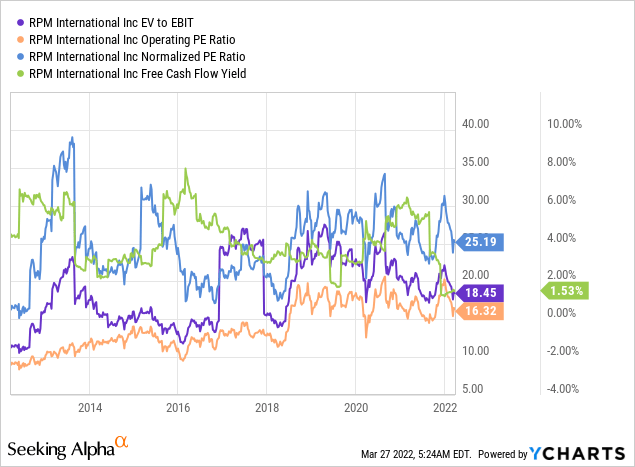
As we can see in the YChart below, market participants have typically valued RPM between ~15x and ~30x TTM EPS. For the MARR analysis I’ll examine terminal multiples spanning that range.
The following table shows the internal rates of return that RPM could potentially generate provided the assumptions laid out above are reasonable expectations for how the future unfolds. Returns assume a purchase price of $80.52, Friday’s closing price, and that dividends are paid and increased along the timeline that RPM has traditionally followed. Dividends are assumed to target a 40% payout ratio.
| IRR | ||
| P/E Level | 5 Year | 10 Year |
| 30 | 19.1% | 12.4% |
| 25 | 14.8% | 10.5% |
| 20 | 9.7% | 8.2% |
| 17.5 | 6.8% | 6.9% |
| 15 | 3.6% | 5.4% |
| 12.5 | -0.1% | 3.6% |
Source: Author
Additionally I use the MARR analysis framework utilized above to determine what price I could pay today in order to generate the returns that I desire from my investments. My standard hurdle rate is a 10% IRR and for RPM I’ll also investigate 8% and 9% return thresholds.
| Purchase Price Targets | ||||||
| 10% Return Target | 9% Return Target | 8% Return Target | ||||
| P/E Level | 5 Year | 10 Year | 5 Year | 10 Year | 5 Year | 10 Year |
| 30 | $116 | $98 | $121 | $106 | $127 | $116 |
| 25 | $98 | $84 | $102 | $91 | $107 | $99 |
| 20 | $80 | $70 | $83 | $76 | $87 | $82 |
| 17.5 | $71 | $63 | $74 | $68 | $77 | $74 |
| 15 | $62 | $56 | $64 | $60 | $67 | $65 |
| 12.5 | $53 | $49 | $55 | $53 | $57 | $57 |
Source: Author
Dividend yield theory is a valuation rooted on the belief that investors will collectively value a business around a normalized dividend yield over time. It’s based on a reversion to the mean concept. Since RPM is more of a cyclical business I’ll use the 5-year average forward dividend yield as a proxy for fair value.
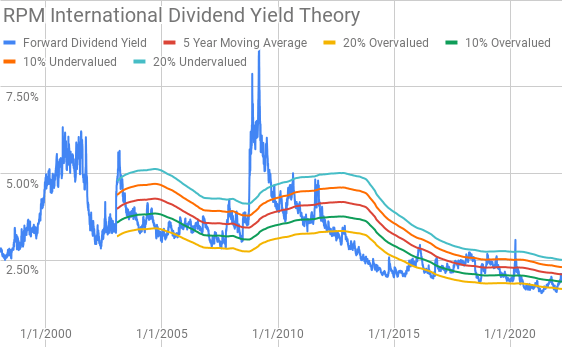
RPM International Dividend Yield Theory (RPM Investor Relations and Yahoo Finance)
RPM shares currently offer a forward dividend yield of 1.99% compared to the 5-year average yield of 2.09%.
Another dividend oriented valuation model is the dividend discount model that derives a value based on the current annual dividend, the long term estimated dividend growth rate and your required return. RPM’s current annual dividend is $1.60 per share and I’ll use 5.5% as the estimated long run dividend growth rate.
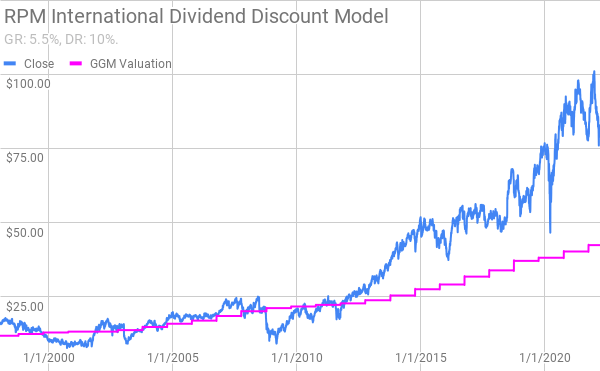
RPM International Dividend Discount Model (RPM Investor Relations and Yahoo Finance)
With a 10% discount rate shares of RPM are worth around $43. Lowering the discount rate to 8% increases the value of RPM to around $85.
A reverse discounted cash flow analysis is a way to use the current market valuation to determine what you have to believe about the growth and margin structure of the business in order to generate the returns you desire from your investments. I use a simplified DCF model built on revenue growth, an initial free cash flow margin of 6.5% that increases to 8% during the forecast period, and a terminal growth rate of 3.5%.
Under those assumptions with a 10% discount rate, RPM needs to grow revenues 11.8% annually for the current market valuation to be justified. Reducing the required return to 8% subsequently lowers the required revenue growth rate to just 5.1% to support the current market pricing. Using the 8% discount rate model of 5.1% revenue growth, but targeting a 10% discount rate would require RPM to increase free cash flow margins to 12.8% during the forecast period, or roughly twice the current levels.
Conclusion
RPM is a solid business with a long history of steady growth and of course a rising dividend. RPM has a wide array of products (paints, sealants, building materials, coatings and more) with customers that range from the everyday consumer to other businesses.
RPM has managed stable sales growth over time through rising prices and volume growth as well as a huge amount of smaller bolt-on acquisitions. RPM has completed 175 acquisitions over the last 30 years with 60 coming in the last decade.
Dividend yield theory suggests a fair value between $70 and $85 while the dividend discount model suggests a fair value closer to $43 for a 10% return target. With an 8% return target RPM’s fair value rises to around $85.
The MARR analysis based on a 10% IRR and a terminal multiple between 15x and 20x 5 years out suggests shares could be worth between $62 and $80. Reducing the return threshold to 8% raises the fair value range to between $67 and $87.
The reverse discounted cash flow analysis suggests that 10% returns are unlikely given the aggressive growth assumptions necessary to generate the required cash flows. However, 8% returns do appear achievable.
One of the interesting things about RPM is that with their history of acquisitions a recession could be just the thing to open up more targets.
With the conclusion of FY 2021, RPM completed its MAP to Growth plan that took aim at cutting costs. According to management, it was a successful plan that reduced annual costs by $320 M compared to the target of $290 M at the outset of the initiative. I like to see companies, especially those that heavily use acquisitions, to take the time to reduce costs when possible. While that is good for the business in the long run, cost cutting can only go so far and those gains and improvements are now baked in.
RPM is a stable business with leadership positions within many of their end markets. Material costs and continued supply chain issues have weighed on recent results. At the current price around $80, shares appear to be relatively attractive although I expect business results and returns to be a bit lumpy. The mid-to-low $70s would be much more attractive to purchase shares; however, I will be considering purchasing additional shares at the current level.
Be the first to comment