

ssucsy
Introduction
Denver-based Royal Gold Inc. (NASDAQ:RGLD) is one of the most prolific streamers I have regularly covered on Seeking Alpha since September 2018.
This article covers the recent earnings 2Q22 released on August 4, 2022, and all new information. My preceding article on RGLD was published on May 12, 2022.
The goal is to get an actual view of the balance sheet to pick the perfect investing strategy.
1 – 2Q22 Results Snapshot and recent activity
Royal Gold posted a net income of $71.14 million or $1.08 per diluted share compared to $81.88 million, or $1.24 per basic and diluted share for the quarter that ended June 30, 2022. The adjusted earnings per share were $0.81 in the second quarter of 2022, below analysts’ expectations.
The increase was due to higher revenues, with an average gold price of $1,877 per ounce, an average silver price of $24.01 per ounce, and an average copper price of $4.53 per pound.
Royal Gold generates revenues from its royalty and stream interests, representing 28.3% and 71.7%. The company is highly reliant on the gold price, representing 71% of the total revenues in 2Q22.
Gold equivalent production for 2Q22 was 78,300 GEOs.
Royal Gold has an excellent debt profile with net cash of $280.62 million and $1.276 billion in liquidity. However, on July 25, 2022, Royal Gold drew $500 million on the credit facility, leaving $500 million undrawn and available.
RGLD Revenue details Presentation (Royal Gold)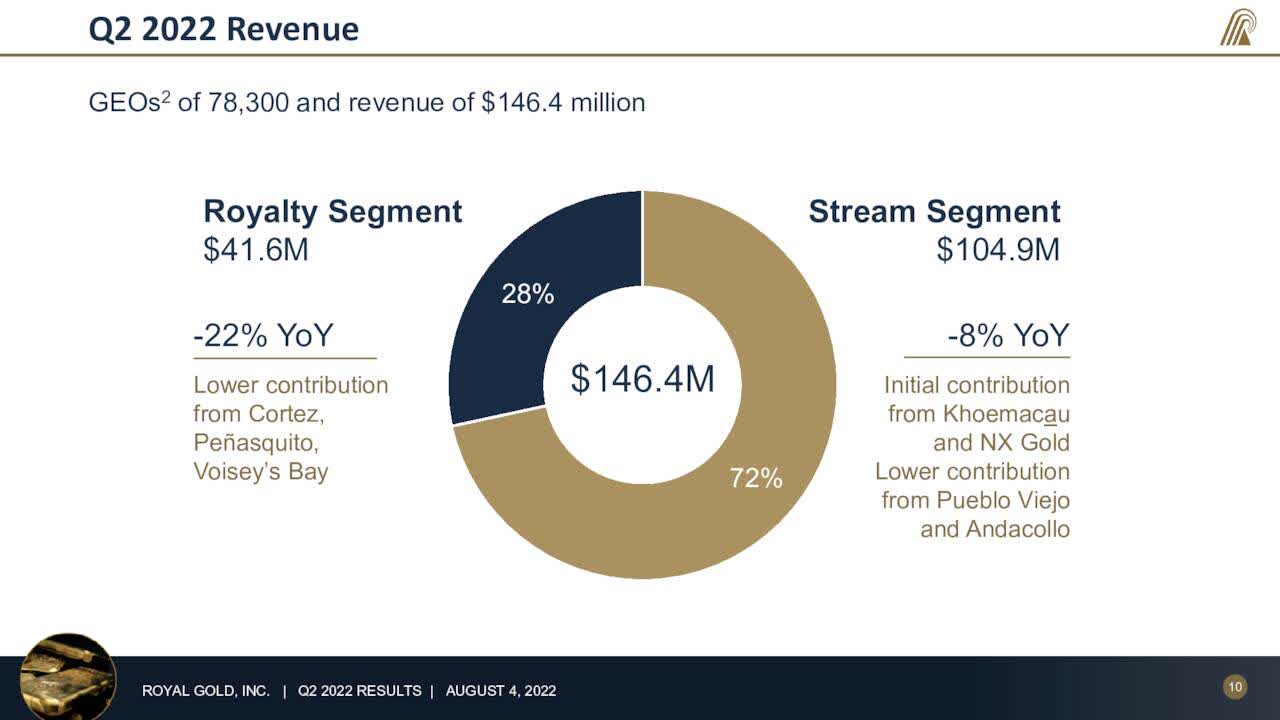
2 – Investment Thesis
The investment thesis has been unchanged for years. The temporary weak production in 2Q22 should not be an issue long term.
Royal Gold is an excellent long-term investment with significant liquidity at about $776 million after funding Cortez’s complex royalty acquisition and long-term growth with the large Bear Lake project.
The company is showing net cash of $280.62 million. Below is some information about the Bear Lake project.
RGLD Great Bear Presentation (RGLD Presentation)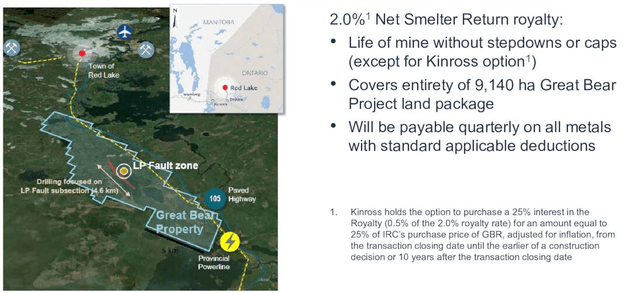
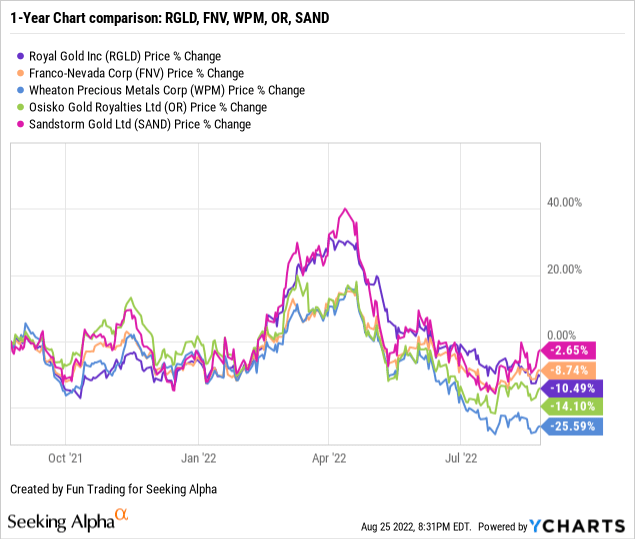
However, I do not own RGLD because I already own FNV, WPM, and SAND, but it is one of the strongest with Franco Nevada and Wheaton Precious Metals.
One negative characteristic of the streamers segment is that the stocks are not providing sufficient dividends.
Due to the volatility attached to this streams & royalties company, I recommend short-term trading LIFO, 30% of your long-term position.
This dual strategy has been the strategy in my marketplace, “The Gold and Oil Corner,” and, I believe, it is the best way to maximize your gain over a long period.
Note: Only investors from the USA can trade LIFO. Read my final note at the end of this article.
3 – Stock Performance
Royal Gold has dropped significantly since May after the FED decided to hike interest by 75 basis points and signaled more increases. In July, the FED hiked interests by an additional 75-point. Royal Gold is down 10.5% on a one-year basis.
CEO William Heissenbuttel said in the conference call:
Q2 was a good quarter from an operating perspective, and lower production at certain properties was expected when we issued our calendar 2022 guidance. Our financial results were solid with a healthy $146 million of revenue. Strong operating cash flow of $120 million and earnings of $71 million. Adjusted income was $54 million.
Royal Gold Inc.: Balance Sheet And Production In 1Q22. The Raw Numbers
| Royal Gold | 2Q21 | 3Q21 | 4Q21 | 1Q22 | 2Q22 |
| Total Revenues in $ Million | 168.03 | 174.43 | 168.52 | 162.36 | 146.44 |
| Net Income in $ Million | 81.68 | 70.18 | 68.16 | 65.68 | 71.14 |
| EBITDA $ Million | 136.63 | 139.01 | 132.30 | 130.15 | 110.82 |
| EPS diluted in $/share |
1.24 |
1.07 |
1.04 |
1.00 |
1.08 |
| Operating cash flow in $ Million | 120.85 | 129.89 | 118.90 | 101.13 | 120.20 |
| Capital Expenditure in $ Million | 85.66 | 265.00 | 16.07 | 37.80 | 0.04 |
| Free Cash Flow in $ Million | 35.19 | -135.12 | 102.83 | 63.33 | 120.16 |
| Total cash in $ Million |
225.92 |
160.21 |
143.55 |
183.71 |
280.62 |
| Long-term debt in $ Million | 0 | 95.40 | 0 | 0 | 0 |
| Dividend per share in $ | 0.30 | 0.35 | 0.35 | 0.35 | 0.35 |
| Shares outstanding (diluted) in Million | 65.64 | 65.63 | 65.62 | 65.65 | 65.68 |
| Gold Production | 2Q21 | 3Q21 | 4Q21 | 1Q22 | 2Q22 |
| Gold Equivalent ounce Production K Geo | 92.4 | 97.4 | 93.9 | 86.5 | 78.3 |
| Gold price realized $/ Oz | 1,825 | 1,790 | 1,794 | 1,877 | 1,871 |
Data Source: Company release and Fun Trading.
Analysis: Revenues, Earnings Details, Free Cash Flow, Debt, And Production Details
1 – Revenues Were $146.44 Million in 2Q22
RGLD Quarterly Revenues history (Fun Trading)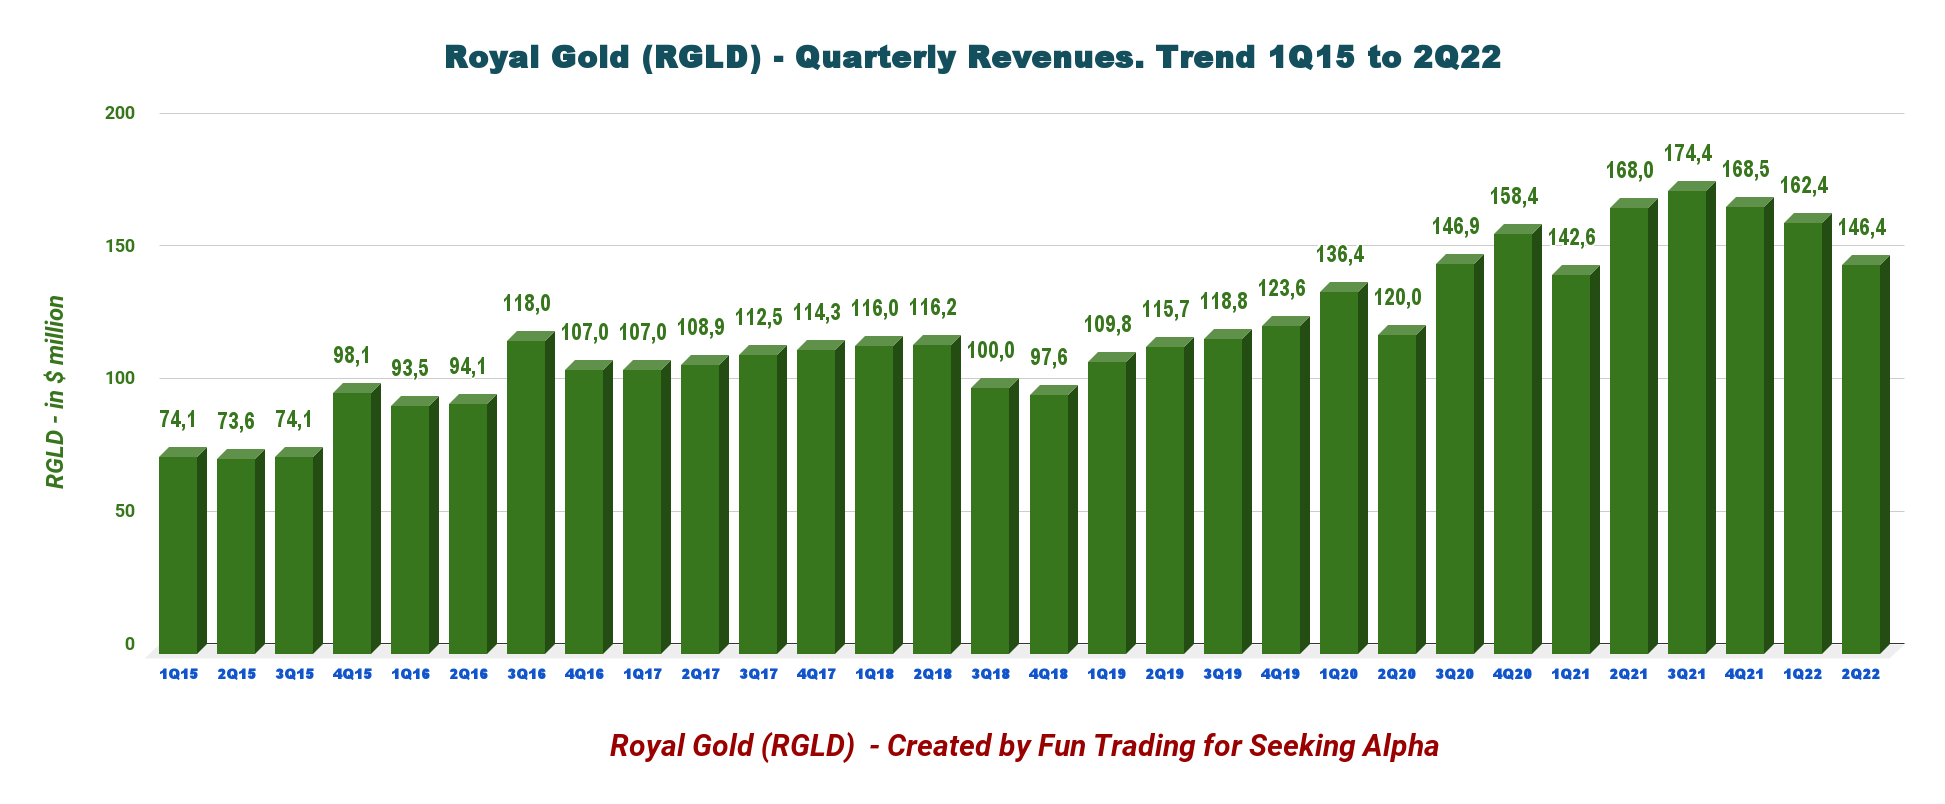
As of June 30, 2022, Royal Gold reported total revenues of $146.44 million, comprised of stream revenue of $104.9 million and royalty revenue of $41.6 million at an average gold price of $1,871 per ounce.
The decrease in total revenue resulted primarily from lower gold sales at Andacollo and Pueblo Viejo and lower gold production at Cortez and Peñasquito. The decrease was offset by $9.4 million of new revenue from the NX Gold and Khoemacau streams, which did not provide stream deliveries to Royal Gold during the prior year quarter. (press release)
Net income for the quarter was $71.14 million or $1.08 per diluted share, from $81.88 million or $1.24 per diluted share last year.
2 – Free Cash Flow Was $120.16 Million in 2Q22
RGLD Quarterly Free cash flow history (Fun Trading)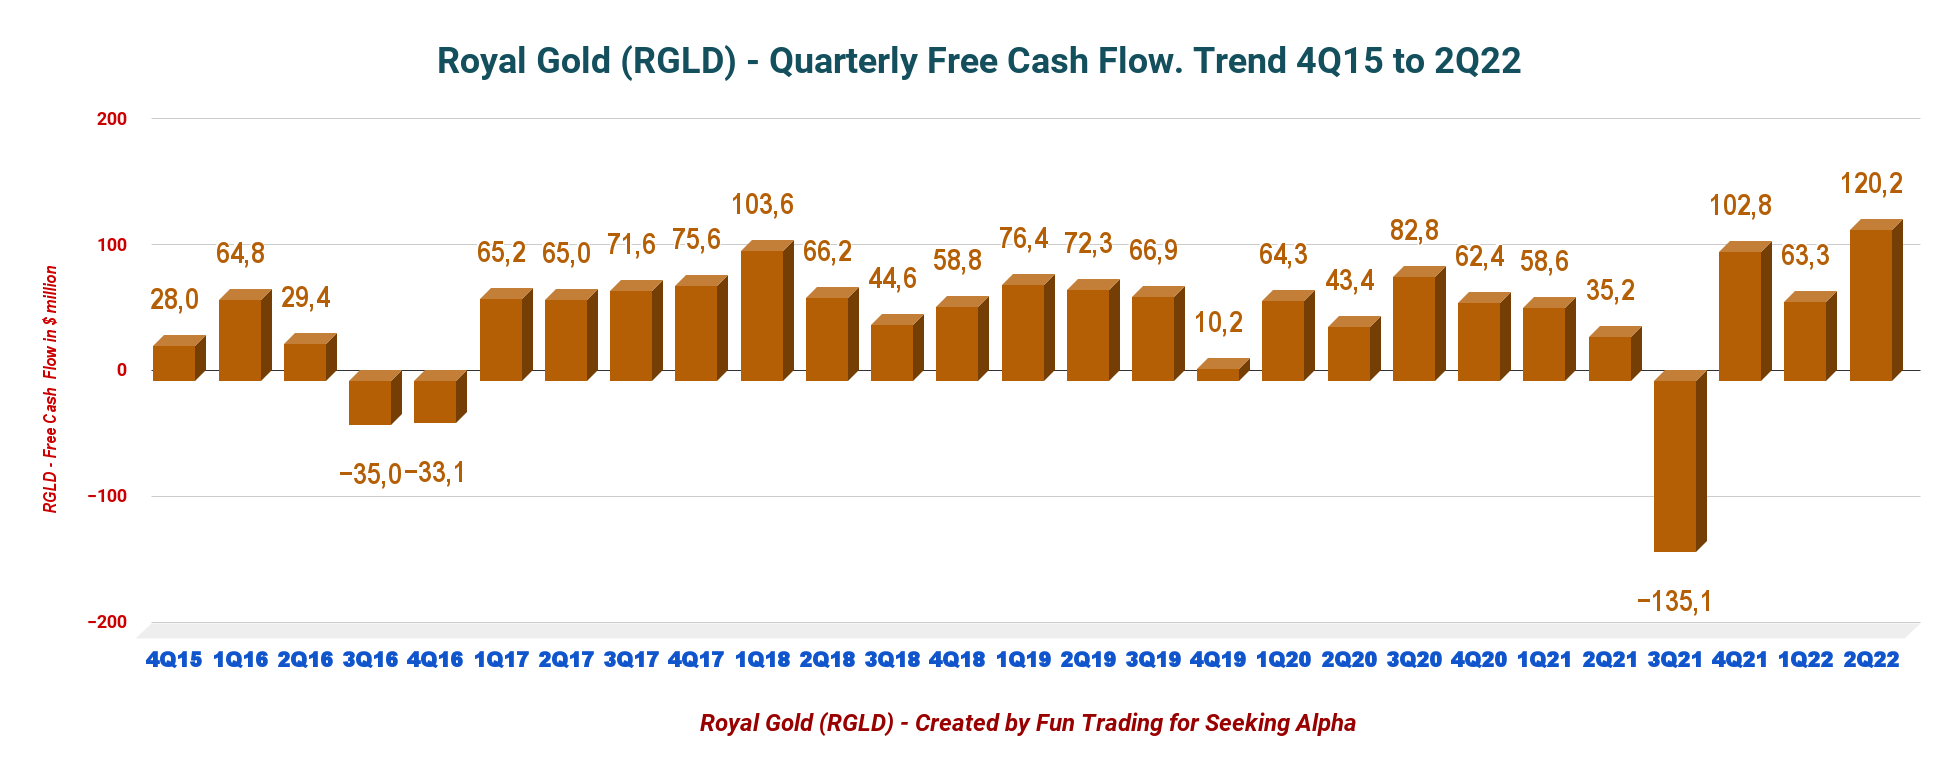
Note: The free cash flow is the cash from operating activities minus CapEx.
The quarterly free cash flow was $120.16 million in 2Q22, and the trailing 12-month free cash flow was $151.20 million.
The quarterly dividend has been set at $0.35 per share for 2022, covered by the free cash flow.
3 – Debt-free And ~$1.3 Billion In Liquidity at the end of June 2022.
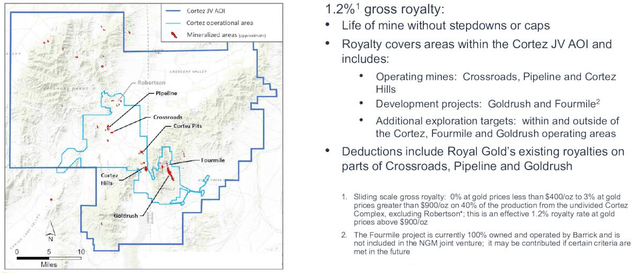
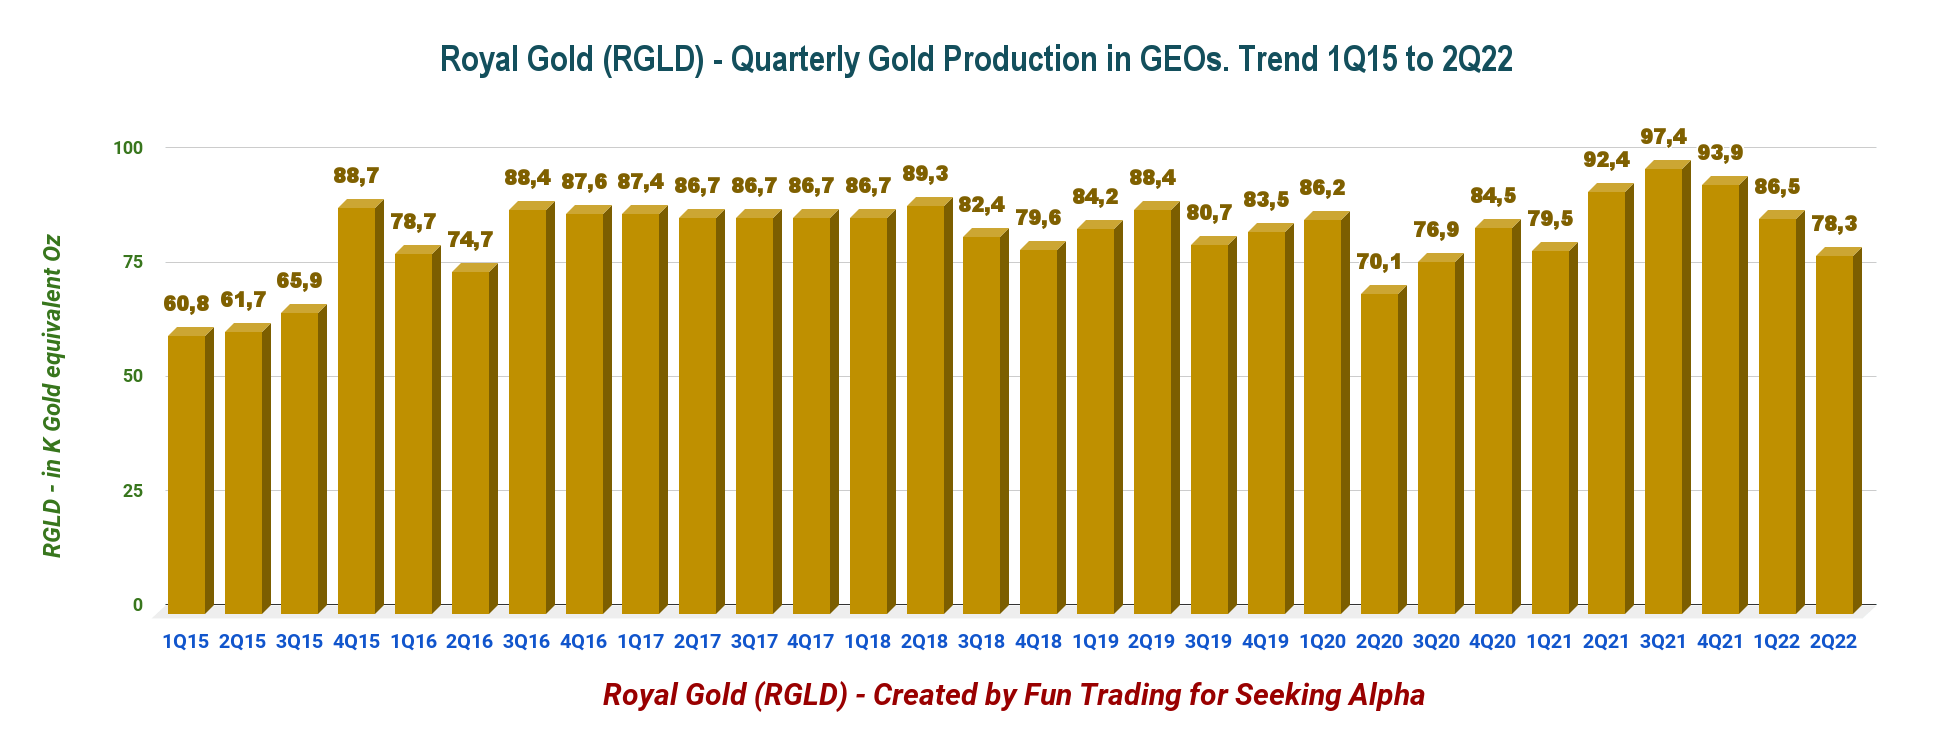
RGLD Quarterly Cash versus Debt history (Fun Trading) RGLD is net debt-free. Liquidity was $1,276 million, with total cash of $280.62 million at the end of June. However, on August 2, 2022, the Company announced that it acquired a sliding-scale gross royalty on an area including the Cortez mine operational area and the Fourmile development project in Nevada. Royal Gold paid $525 million in cash for the Cortez Royalty to Kennecott Royalty Company, a wholly-owned subsidiary of Rio Tinto European Holdings Limited (“Rio Tinto”). The transaction gives the Denver, Colorado-based royalty firm an effective 1.2% gross royalty in an area within the Cortez complex, which is owned or controlled by Nevada Gold Mines, which is a joint venture between Barrick Gold (61.5% owner and operator) and Newmont (38.5% owner). The Fourmile development asset, also included in the deal, is 100% owned and operated by Barrick. RGLD Cortez Presentation (Royal Gold Presentation) For that reason, Royal Gold drew $500 million on the credit facility, leaving $500 million undrawn and available, reducing the liquidity to $776 million. 4 – Production In Gold Equivalent Ounce And Details RGLD Quarterly Gold Equivalent production history (Fun Trading) Royal Gold reported a quarterly production volume of 78.3K GEOs (Gold Equivalent Troy Ounces) compared to 92.4K GEOs in the same quarter last year. The production was weak this quarter. The decrease in total production resulted primarily from lower gold sales at Andacollo and Pueblo Viejo and lower gold production at Cortez and Peñasquito despite new revenue from the NX Gold and Khoemacau streams, which did not provide stream deliveries to Royal Gold during the prior year’s quarter.
Revenue split: 71% gold / 14% copper / 11% silver / 4% other
The average gold price was $1,871 per ounce, the average silver price was $22.60 per ounce, and the average copper price was $4.31 per pound.
This quarter’s average prices:
- $1,871 per ounce for Gold
- $22.60 per ounce for Silver
- $4.31 per pound for Copper
RLD Quarterly gold price history (Fun Trading)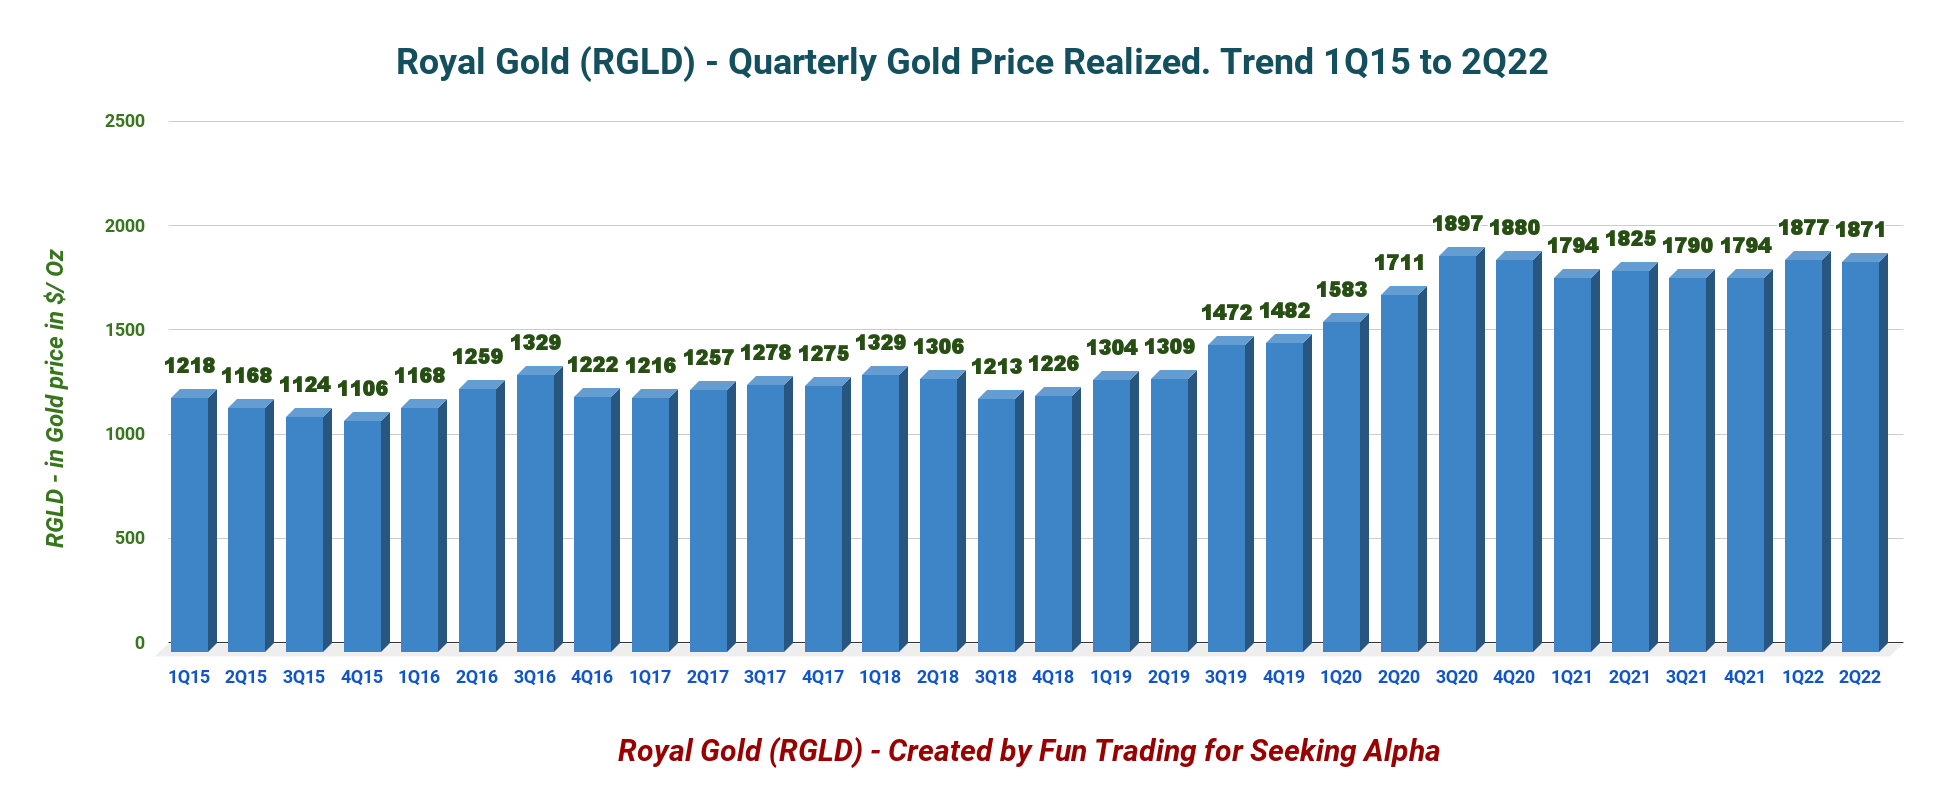
Technical Analysis (Short Term) And Commentary
RGLD TA Chart short-term (Fun Trading)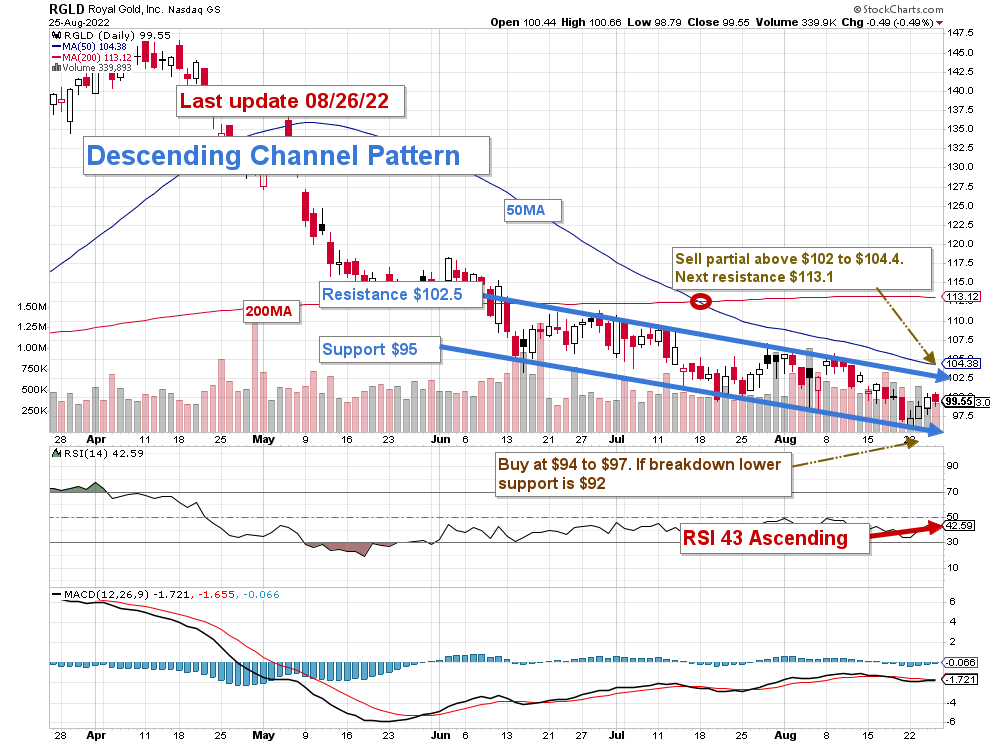
Note: The chart is adjusted for the dividend.
RGLD forms a descending channel pattern with resistance at $102.5 and support at $95. A descending channel pattern is often considered bullish and ends in a breakout.
The short-term trading strategy remains the same as in my preceding article. I suggest trading LIFO for about 30% of your position. I recommend selling between $102 and $104.4 with potential higher resistance at $113.1 and waiting for a retracement between $97 and $94.
Trading LIFO permits you to sell your most recent purchases, assuming a profit (of course) while keeping your long-term position underwater until the stock has appreciated enough to consider selling your core position.
Trading LIFO is about taking small profits using the chart pattern and repeating often. However, do not sell at a loss and manage your cash position.
Sometimes, the weekly trend can stretch a month or even more, and it is reasonable to accumulate more and be patient.
The FED’s hawkish action on interest rates has significantly hurt the gold mining sector more than the gold bullion, still trading at $1,750 per ounce. The next FED decision could reinforce this trend, and further weakness could occur. In this case, I see lower support at $92.
Watch gold like a hawk.
Note: The LIFO method is prohibited under International Financial Reporting Standards (IFRS), though it is permitted in the United States to generally accepted accounting principles (GAAP). Therefore, only US traders can apply this method. Those who cannot trade LIFO can set two different accounts for the same stock, one for the long term and one for short-term trading.
Warning: The TA chart must be updated frequently to be relevant. It is what I am doing in my stock tracker. The chart above has a possible validity of about a week. Remember, the TA chart is a tool only to help you adopt the right strategy. It is not a way to foresee the future. No one and nothing can.
Author’s note: If you find value in this article and would like to encourage such continued efforts, please click the “Like” button below as a vote of support. Thanks.
Be the first to comment