

pcess609
Chart created by writer from C Trader
In this article, we will examine how Meta Platforms, Inc.’s (NASDAQ:META) bearish third wave is faring and look to see if there are any signs of a turnaround in sight.
Meta’s current pattern is difficult to decipher given the complexity of the setup and lack of bullish action coupled with any clear bottoming structure through macro wick formation, which is representative of significant orders to carry this equity higher. So, let’s delve into where Meta is currently at.
Meta reported Q2 earnings this year of $28 Billion, which is only one percent down from the same period last year. Concern at the cost and perception of the Metaverse could be weighing on the share price and causing its inability to find a breakout pattern upwards.
Topping out in a bullish structure this time last year at circa $400, in the six months following Meta lost 50% of its share price value. With investors looking for recovery, we will look if there are any real signs available.
Firstly, looking at the peak area on the monthly chart downwards, we can see a complex but solidified bearish three-wave structure, with the wave one $384-307 followed by a very bearish wave two with the immediate drop and numerical replication of the wave one completing by landing at third wave target $231.
Meta monthly (C Trader)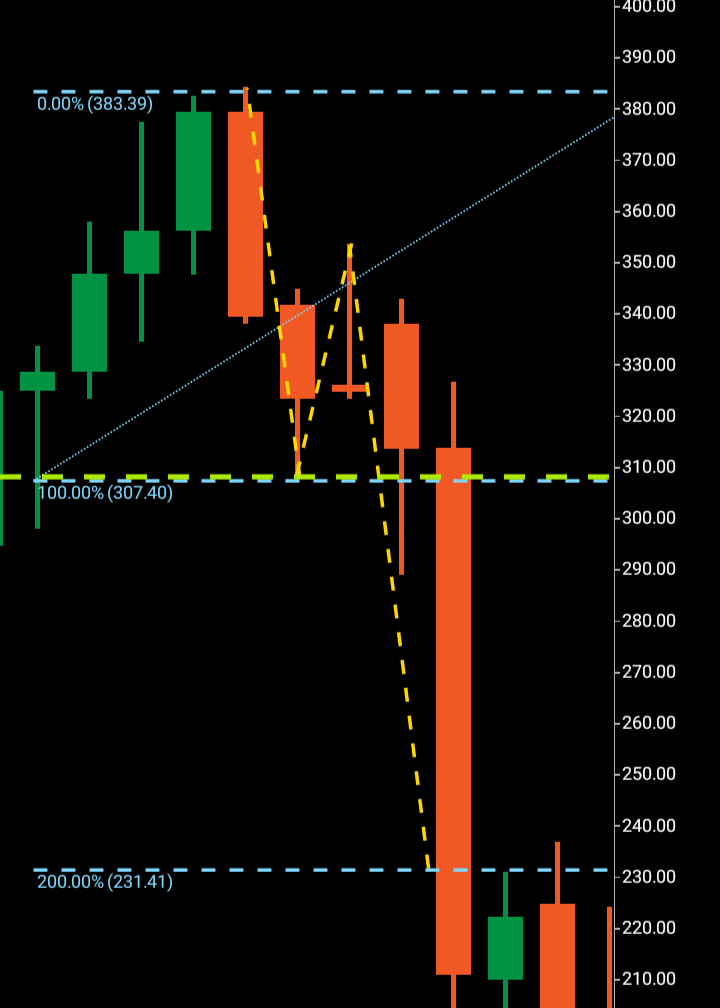
Against the other household equities that have seen bearish action, Meta is the only equity that has seen a double bearish structure. We will now look at this second third wave that has broken out and see if there are any signs of it making a bullish turnaround.
Meta monthly (C Trader)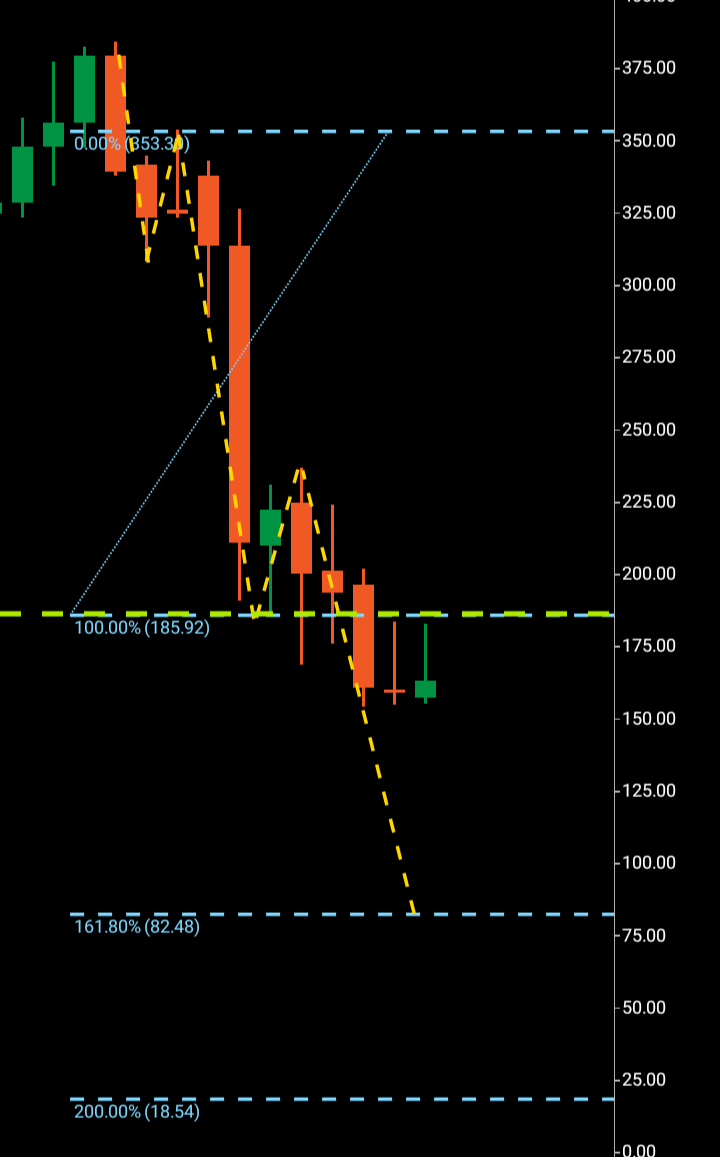
This now second bearish three-wave pattern within the structure has a wave one formed $353-$185 with a short wave two to circa $250 with a third wave breakout downwards towards the sub $100 region. In fact, Meta seems to be in a holding pattern $155-$180, which will not reveal itself until broken upwards or downwards, but the fact that Meta has not followed the other major equities in forming a clear bullish structure could give ominous signs that this third wave may continue downwards. There is, of course, the possibility that these monthly candles will finish in this formation, which could be perceived as bullish. We will not know until broken with intent on either side.
Meta weekly (C Trader)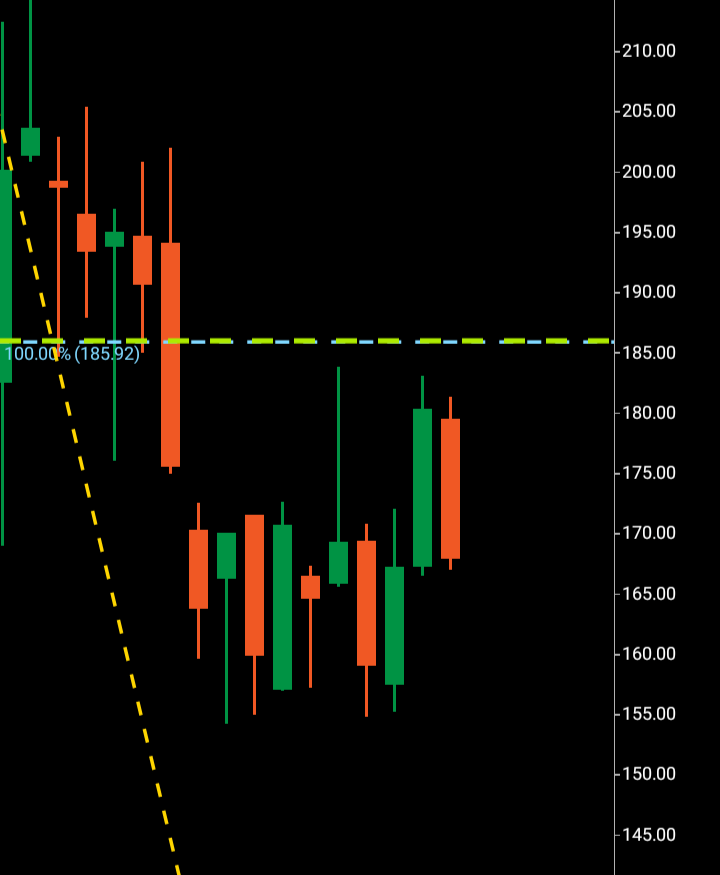
Above, we can see Meta in the holding pattern signaling indecision from investors, if Meta were to finish this month with a full-bodied bullish candle, it would signal even further that this equity has not bottomed. Bottoming candles must have a solid wick formation underneath, and this current pattern doesn’t possess this formation.
I expect Meta to follow through with its bearish third wave with a target of the $80-60 region within the next six months. Barring evidence of a clear bullish turnaround, that is.
About the Three Wave Theory
The three-wave theory was designed to be able to identify the exact probable price action of a financial instrument. A financial market cannot navigate its way significantly higher or lower without making waves. Waves are essentially a mismatch between buyers and sellers and print a picture of a probable direction and target for a financial instrument. When waves one and two have been formed, it is the point of higher high/lower low that gives the technical indication of the future direction. A wave one will continue from a low to a high point before it finds significant enough rejection to then form the wave two. When a third wave breaks into a higher high/lower low, the only probable numerical target bearing available on a financial chart is the equivalent of the wave one low to high point. It is highly probable that the wave three will look to numerically replicate wave one before it makes its future directional decision. It may continue past its third wave target, but it is only the wave one evidence that a price was able to continue before rejection that is available to look to as a probable target for a third wave.
Be the first to comment