

Rafael_Wiedenmeier
As 2022 winds down, Roche (OTCQX:RHHBY) is making moves to better position themselves atop the global Big Pharma pile. Their revenue mix is increasingly showing a shift away from the last generation of blockbusters towards greener pastures, “next generation” oncology and advanced diagnostics, and management is turning over accordingly to be prepared for the company’s next growth opportunities. How much novelty remains in the pharma pipeline is a legitimate question to ask, however, as much of their short-term plan hangs on a single drug, they suffered a huge setback recently in the Alzheimer’s therapeutic race, and the return on their industry-leading R&D expenses is dubious. Moreover, the diagnostics business saw a huge boost from the pandemic, but our assessment is that the revenue was mostly “pulled forward” from the future and will take several years of normal operating revenue to “catch up”. At the moment, they sit at the same levels we initiated our position in February 2021; adjusting for their increased leverage, the larger macroeconomic backdrop and a more challenging FX environment, they still look like as good a buy as back then, but maybe not as much of a “desk-pounder” as 22 months ago.
Revenue Mix: A case study in pharma portfolio management
When a pharma company’s financial presentations break down revenues from a handful of blockbuster products as a dedicated line item, you know those products are a huge part of the business. For Roche, that’s the “AHR” products: Avastin, Herceptin, Rituxan. Patent expirations on these drugs and the ensuing biosimilar rollouts put the pressure on Roche starting in 2017 to make a move. Roche has responded to this challenge with a diversified approach, fostering both pharmaceutical and diagnostic business opportunities that have taken off and more than made up for the “erosion” of the AHR portfolio.
Roche Q3 Investor Presentation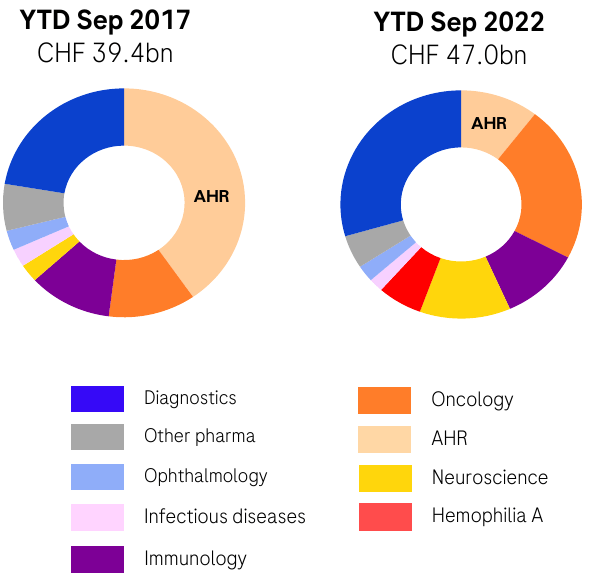
Pharmaceuticals
Roche still leans heavily on HER2 therapeutics to carry the post-AHR weight, but a few other big winners have proven there are opportunities for those willing to put in the work, and Roche has some absolute muscle in their corner with Genentech and Chugai (OTCPK:CHGCY) both contributing to the effort.
Oncology
Even as far back as 2016, the post-Herceptin HER2 therapeutics Perjeta, Kadcyla and Phesgo (starting in 2020) account for half of the ex-AHR oncology revenue:
Next-gen HER2 includes Perjeta, Kadcyla and Phesgo. (Author’s own work)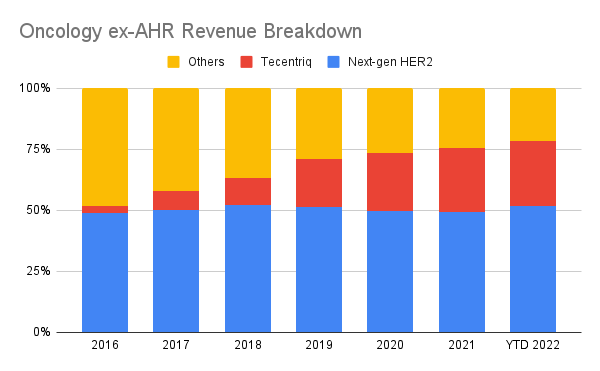
The pivotal non-HER2 oncology drug for Roche came with Tecentriq in 2016, the first PD-L1 inhibitor. Currently approved for a number of cancer indications, most notably non-small cell lung cancer, Roche is pushing its label expansion aggressively, with a number of additional indications and combination therapies currently in Phase 3 trials:
Phase 3 Oncology/Hematology compounds and indications. 3 compounds covering 17 indications involve Tecentriq in some form (highlighted in red) (Roche Q3 Investor Presentation)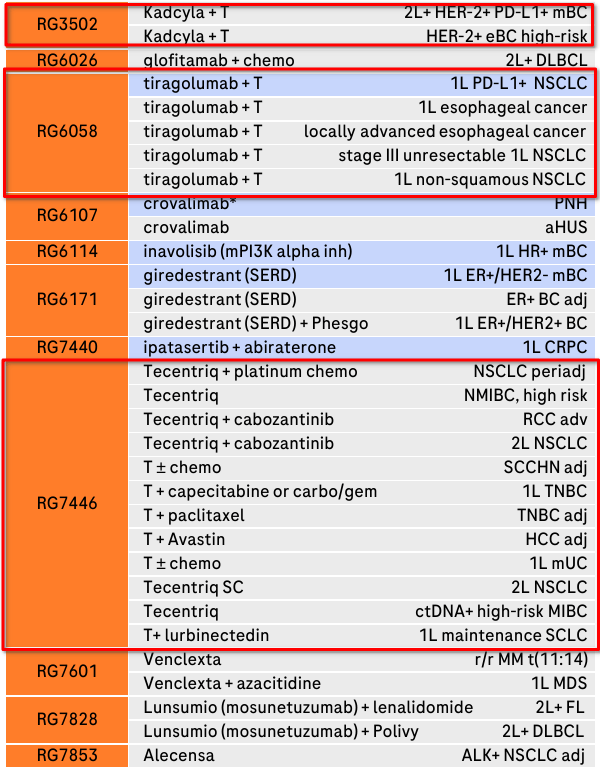
Despite the large late-stage pipeline presence, Tecentriq is only the fourth-highest grossing therapeutic, comprising about 18% of the oncology revenue and 8% of the Pharma division’s revenue. Compared to other PD1-targeting immunotherapies with broad labels (i.e. – excluding Libtayo, currently only approved for skin cancer), Tecentriq’s revenue is a distant third to Keytruda (MRK) and Opdivo (BMY), and newcomer Imfinzi (AZN), another PD-L1 targeting therapeutic, is already hot on its heels:
All revenues in USD. Tecentriq and Imfinzi were converted from CHF and GBP respectively using annual average exchange rates from macrotrends. (Author’s own work)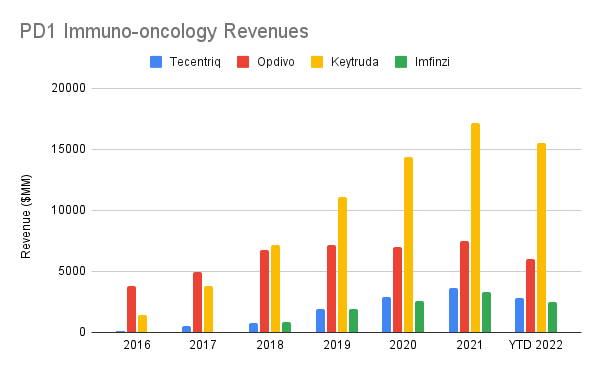
Roche also apparently wants to use Tecentriq as a way to salvage the disappointment that is the anti-TIGIT therapeutic tiragolumab, as all of its pipeline entries for tiragolumab are combination therapies with Tecentriq. Oncology is definitely a high-risk, high-return field of medicine, and right now the bounces are pretty much balancing out for Roche.
Hematology
The biggest surprise in Roche’s comparison of their 2017 revenue to their 2022 revenue is the sudden appearance of a hematology product area, entirely driven by the blockbuster drug Hemlibra, their third-highest selling drug year-to-date. The science behind Hemlibra is that rare breed which is simple yet profound, mimicking a deficient interaction mediator with a bispecific antibody, and Roche were the first ones to commercialize it. Roche currently has another bispecific antibody, mosunetuzumab, approved in the EU and just approved in the US as a third-line follicular lymphoma (blood cancer) therapeutic, which is pretty solid evidence that they have embraced this new technology and are getting out ahead of the competition in bringing better products to market.
Neurology
And the top spot for 2021 and the year-to-date is, of all things, the MS therapeutic Ocrevus, having grossed 5B CHF in 2021 and 4.4B CHF as of Q3 2022. Sales for this one drug are now comparable to Biogen’s (BIIB) entire MS portfolio, so there’s definitely not a lack of demand as Biogen’s patent cliff takes hold and startups like TG Therapeutics (TGTX) roll out their own competing treatments.
Revenues in USD. Ocrevus was converted from CHF using annual average exchange rates from macrotrends. (Author’s own work)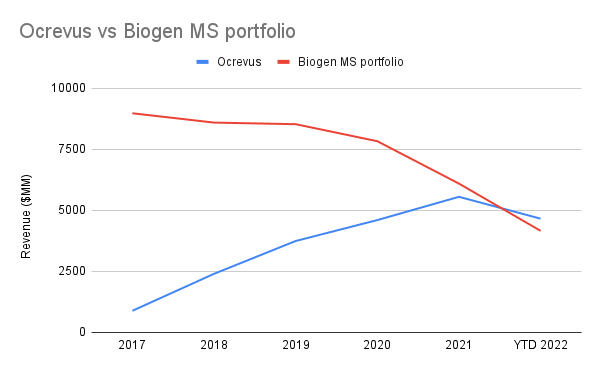
The neurology product area has gotten the biggest boosts in recent years, adding SMA treatment Evrysdi and NMOSD treatment Enspryng, both of which can be administered at home and are showing impressive uptakes two years into their lifecycle. Evrysdi is still trailing other SMA treatments Spinraza and Zolgensma (NVS), but the growth is impressive enough that it likely will start to compete meaningfully for market share.
Revenues in USD. Evrysdi was converted from CHF using annual average exchange rates from macrotrends. (Author’s own work)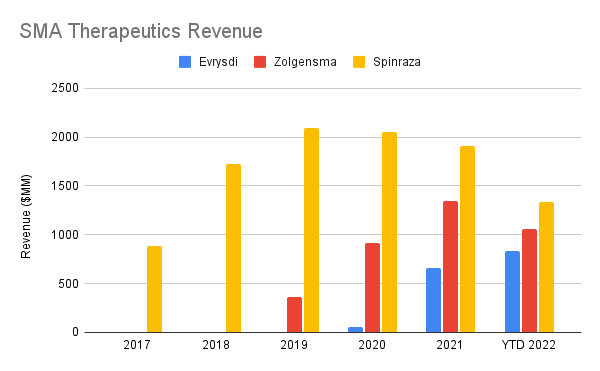
The white whale for all of neuroscience, however, is a disease-modifying therapeutic for Alzheimer’s, and it has eluded Roche so far. Gantenerumab did not meet its Phase 3 endpoint, although its success was already considered low-probability by some analysts, so the impact on estimates was muted. Whale hunting is another high-risk, high-reward proposition for pharma companies. The silver lining, though, has come from Roche’s other major business area.
Diagnostics
Roche’s differentiating factor from other big pharma companies is their substantial diagnostics division, and the last few years have given them a chance to really strut their stuff. Comparing to 2017, Diagnostics has grown from about 22.6% of the company’s revenue to 28% in 2021 and nearing 30% for the year-to-date. They maintain a solid consumer presence with their Accu-Check line of diabetes monitoring products and their aggressive work on distributing tests for COVID-19 and monkeypox over the last few years, while continuing to innovate higher-throughput Core Lab solutions and earlier diagnostics for problematic illnesses.
Although gantenerumab fell through, their Elecsys system for detecting biomarkers of Alzheimer’s in cerebrospinal fluid received FDA approval in early December, scoring a major victory by giving clinicians access to earlier, easier-to-perform diagnostics for the disease. Being able to confirm cases sooner gives pharma companies a much more reliable population from which they can sample for clinical trials. Roche also benefits from the vertical integration by making the Elecsys tests work on their cobas line of instruments, ensuring a bolt-on offering for their customers.
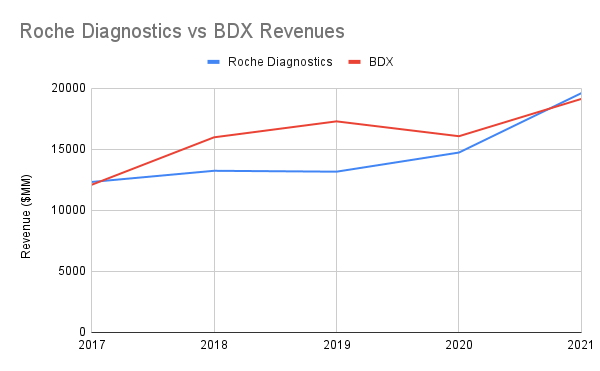
The momentum for the Diagnostics division is strong, with their division revenues rivaling even pure-play names like Becton Dickinson (BDX), but a COVID-based hangover may not be far away. An initial sudden need for COVID testing proved to be beneficial to Roche, and in fact may have kept them net-positive in the latter parts of 2020, but the music has stopped and we now have to consider how much of their future earnings were “pulled forward” as a result of the pandemic, an effect that likely will be playing out over the next several years with other businesses that saw a sudden boom in revenues due to the abrupt disruption of life.
Diagnostics division sales growth quarter-over-quarter. Total business shown in blue, ex-COVID shown in orange. COVID-related revenues shown below. An outsized COVID boost to growth is clearly visible in 2020 and 2021, now followed by gradual decline. (Roche Q3 Investor Presentation) Revenues in USD. Roche revenues converted from CHF using annual average exchange rates from macrotrends. (Author’s own work)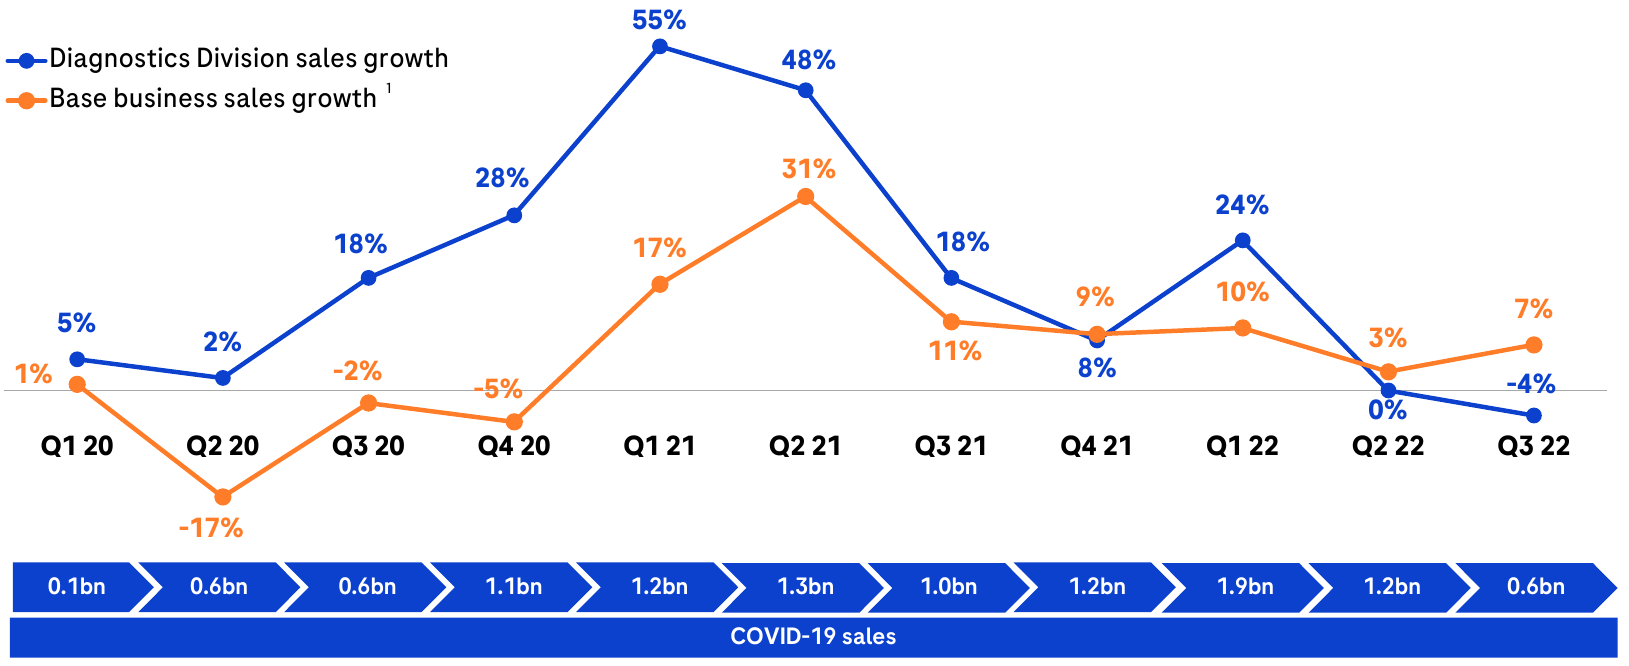
Unlike the pharmaceutical side of the equation, diagnostics will likely have a softer landing as the pandemic transitions into “living with” COVID the same as other infectious diseases. We are still going to need COVID tests, and many more people will be using COVID diagnostic tests than will eventually need any kind of prescription medication for the illness. The “razor and blades” model that systems like Roche’s cobas follow ensures a high degree of stickiness for their customers and also gives them an incentive to act quickly in response to changing epidemiological events, such as the monkeypox epidemic that flared up this year. It is certainly a moaty “X-factor” for Roche, but some lean years may lay ahead as the general public reestablishes an equilibrium with the infectious agents in their surroundings.
Management
Arguably one of the biggest non-product stories to call out as the year wraps up is the changes happening within the Executive Committee. Group CEO Severin Schwan is transitioning to Chairman of Roche’s Board of Directors, with Diagnostics CEO Thomas Schinecker moving to the Group CEO role and Pharmaceuticals CEO Bill Anderson leaving the company to pursue other opportunities. These reassignments will be taking place over the next few months and finalized at Roche’s annual meeting in March.
From the first earnings call we watched, we were quite fond of the leadership at Roche. Schwan, although not a scientist by trade (his education is in Economics and Law), knew the business very well and had good people heading up both major divisions of the company. Alan Hippe, the company’s CFO, also demonstrates good knowledge of the actual business of the company, not playing the role of “bean counter” in which some CFOs end up during presentations to shareholders. The decision to promote Schinecker to Group CEO makes perfect sense given the increased revenue contributions of the Diagnostics division for the last several years, and it sends a clear message that Diagnostics will continue to be a significant part of Roche’s strategy over the medium-term.
On the flip side, Schwan came up through the Diagnostics division, and promoting another Diagnostics CEO to the Group CEO role could smack of favoritism and/or Eurocentrism – Schinecker has been CEO of Diagnostics only since 2019, and Anderson came up through US-based Genentech – and perhaps contributed to Anderson’s decision to leave. All things considered, given the company’s reworking of their product offerings, it feels like as good a time as any to breathe some new life into the Executive Committee while ensuring that Schwan, who has done right by this company, isn’t going too far away.
Fundamentals and Competition
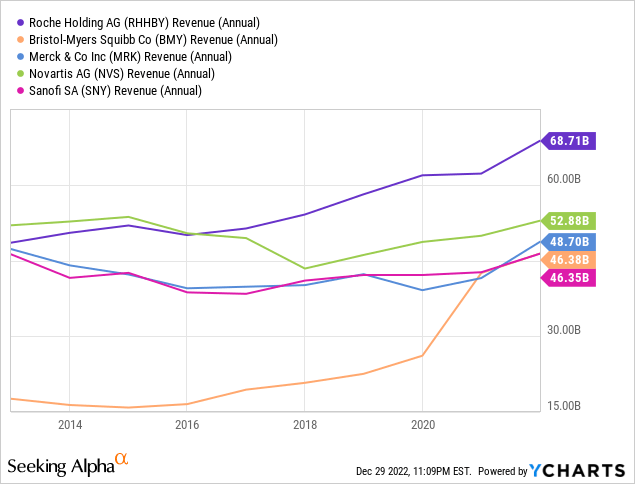
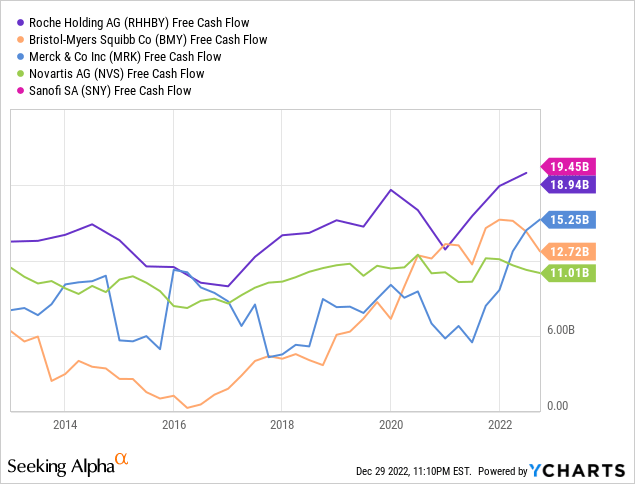
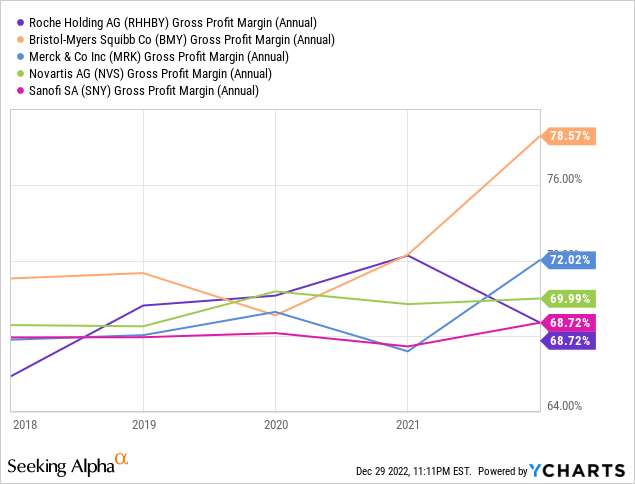
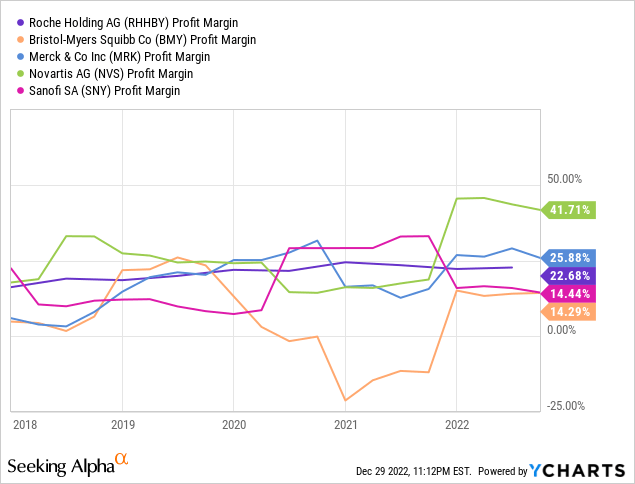
Roche absolutely has the pockets of a global Big Pharma company, but their financial position appears slightly more tenuous than it did a year ago. Of the competitors Roche uses as an industry peer group in their 2021 Annual Report, we consider Bristol-Myers Squibb, Merck, Novartis and Sanofi (SNY) as their closest competitors in terms of size and overlapping markets. In absolute terms of revenue and cash flow, Roche is number one, while their margins from top to bottom line are more middling:
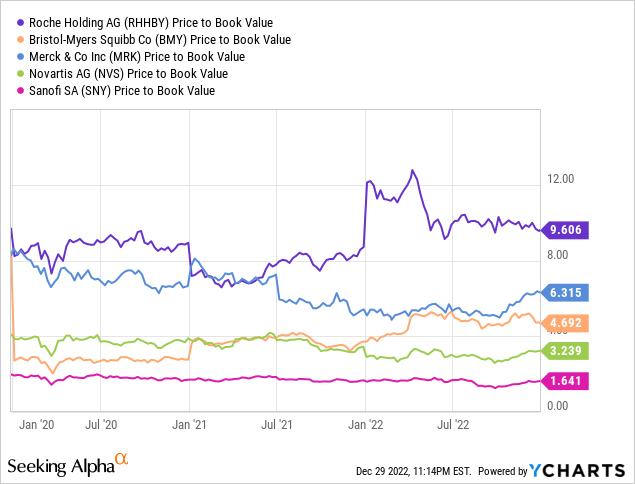
Other traditional value ratios, such as P/E and P/B, are definitely not in Roche’s favor:
The R&D expenses as a percentage of a revenue tell an interesting story, too. Roche considers their “established treatments” to consist of any drugs developed prior to 2012, and as we saw, three of their top four drugs (Ocrevus, Hemlibra, Tecentriq) were only approved as recently as 2016. The R&D expenses are starting to creep up compared to the peer group, even more so if you look at just the Pharmaceutical division’s numbers:
Author’s own work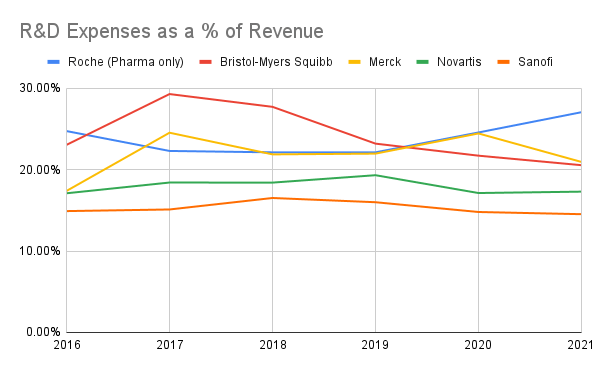
Return on capital, however, is in a class only matched by Merck and Novartis, suggesting the expenditure is producing the desired results:
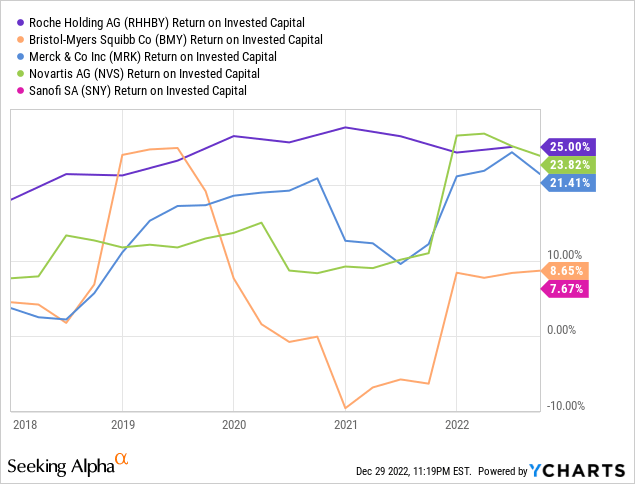
Given the long lead time on pharmaceutical investments, though, we need to continue to watch this space as compounds move through the pipeline to see if that return is truly materializing.
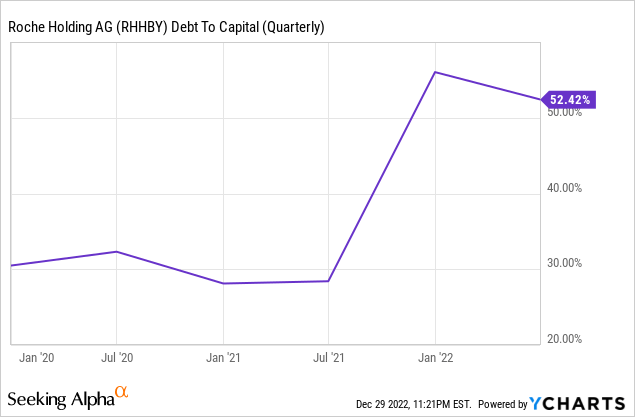
Another large shift that’s happened fundamentals-wise for Roche since we first looked at them is a large piling-on of debt which has put them under increased leverage. Their net-debt-to-capital ratio as of June 2021 was as low as 20.4%; it now stands at 49.3% after acquiring GenMark and TIB Molbiol and carrying out a massive share repurchase (literally a third of shares outstanding, which was owned by Novartis).
Interest expense increased 51% year-over-year as of 2022 H1, and the last tranche of that new debt was issued in March 2022 as floating-rate notes tied to SOFR, which increased from near-zero to 0.75% by the end of H1 and is now hovering around 4.3%:
sofrrate.com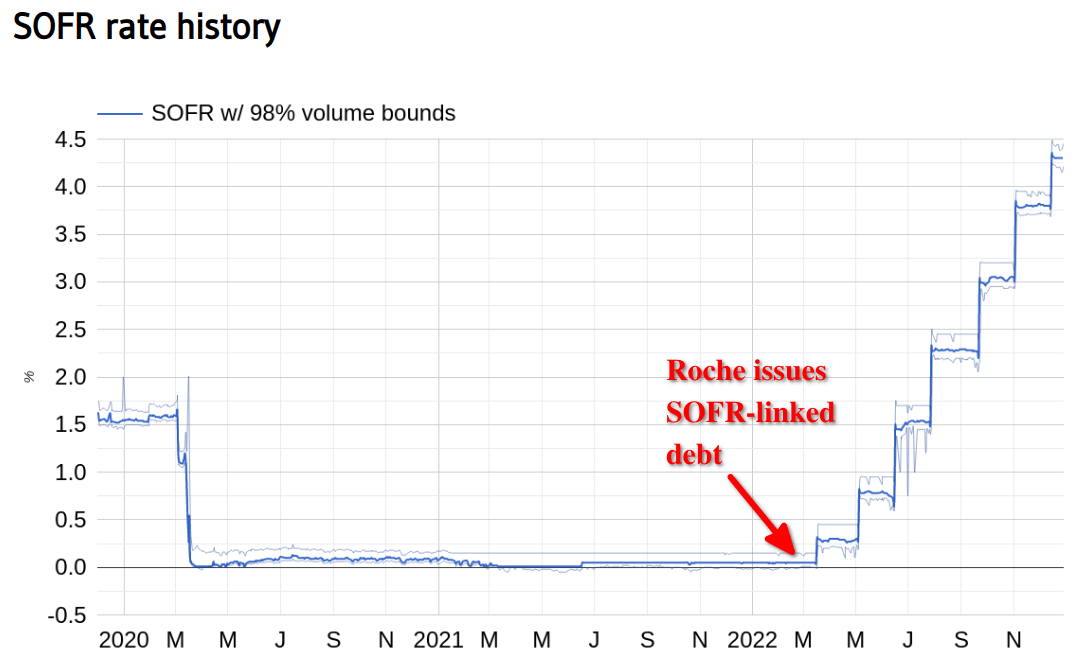
Roche undoubtedly has the cash flow to service this debt, and the lowered weighted average cost of capital may help them to unlock additional business opportunities, but it will serve as a headwind, especially if rates continue to climb, unless they can find a way to restructure it.
Exchange rates have also played havoc with Roche’s revenues, being exposed to dollar, euro and yen markets while reporting all of their financials in Swiss francs. While these different currencies have largely balanced out year-to-date, it wouldn’t take but one concentrated geopolitical black swan – Eastern Europe, East Asia – to drastically affect regional revenues negatively.
Roche Q3 Investor Presentation
One question that’s been ringing in our heads since we saw Roche’s results comparing 2017 to now: what is Roche’s plan for 2027? Are they looking another five years into the future, or even ten years, when Perjeta is going to be in the same stage its ancestor Herceptin is now? Regrettably, Roche does not break down their R&D expenses by stage of development; it would certainly be nice to see if the bulk of this increased spend is occurring earlier in the pipeline, continuing to invest for the medium-term. The phase 1 pipeline does appear to have a healthy number of new molecular entities relative to other companies which disclose their phase 1 candidates, so with any luck, a handful of these drugs will be approved by 2025-2026, and the cycle will continue anew.
Valuation
Roche is steadily growing their cash flow, and the current market environment is giving an in-line premium to that growth. Working capital took a huge hit at the end of 2021 due to the share repurchase, distorting the owner’s earnings numbers, so we use the free cash flow data to value the company. The long-term free cash flow growth is healthy at 7.6% compounded annually, compared to their peers:
|
Free cash flow compounded annual growth rate |
|
|
Roche |
7.6% |
|
Sanofi |
6.8% |
|
Merck |
6.1% |
|
Novartis |
5.7% |
|
Bristol-Myers |
3.5% |
Inverting the Gordon growth model, we find the market pricing in a 14.89% discount rate. This discount is in line with Bristol-Myers (14.9%) and a bit larger than Merck (12.77%), but given the worsening economic outlook, the pull-ahead effect from COVID on their Diagnostics revenue, and their increased debt load, the short-term is looking a bit rough. The best case we see is that their discount rate reverts to the long-term market mean of 14%, which is already a bit generous, equating to a fair value estimate of $44.90 for the US-traded ADRs.
Considering we initiated our position almost two years ago right around this point, we may very well add on to it at these prices, especially with the large share buyback increasing ownership stake and prospects for dividend increases on the horizon; for new positions, though, it might be prudent to hold out for a bit more meat on the bone.
Conclusion
Roche has the cachet of a global Big Pharma company and sound enough management to navigate the ebb and flow of a pharma portfolio, buoyed by a more evergreen, stickier, less-R&D-intensive diagnostics business. Their size, management, product lineup and geography all drove us to pick them as part of our pharmaceuticals-themed bucket of securities. As they reach the five-year milestone of their post-AHR phase, it seems they have risen to the challenge of replacing the lost revenue from their early-2000s blockbusters. Whether they can repeat this performance in another ten years, however, remains to be seen. That, plus tougher macro headwinds, a huge reallocation of their capitalization, lukewarm prospects for oncology in the near-term, and a promising-but-cautious shakeup to the Executive Committee, temper our excitement to a somewhat modest premium. We will look to add to our position and tune in to their Annual Report in February with great interest, but as of right now, we recommend “watchful waiting” for those in the hunt for a true value pharma play.
Editor’s Note: This article discusses one or more securities that do not trade on a major U.S. exchange. Please be aware of the risks associated with these stocks.
Be the first to comment