

MicroStockHub
(This article was co-produced with Hoya Capital Real Estate)
Introduction
Definitions I found classify stocks below $300m in market size as Micro-Cap. Based on how few funds invest only in Micro-Cap stocks and how little assets they hold, most investors have little, if any exposure to this asset class. Investors who own the iShares Russell 2000 ETF (IWM) do have a 33% exposure to these stocks inside that ETF.
I chose to review the Royce Micro-Cap Trust (NYSE:RMT) Closed-End-Fund as it is one of two I use for Micro-Cap exposure, the other being the Wasatch Micro Cap Value Fund (WAMVX), which I reviewed last December.
Why consider Micro-Cap stocks at all?
History is on the side of smaller stocks, as since 1972, both Small-Cap and Micro-Cap (the best) have had higher returns than Large-Cap stocks.
portfoliovisualizer.com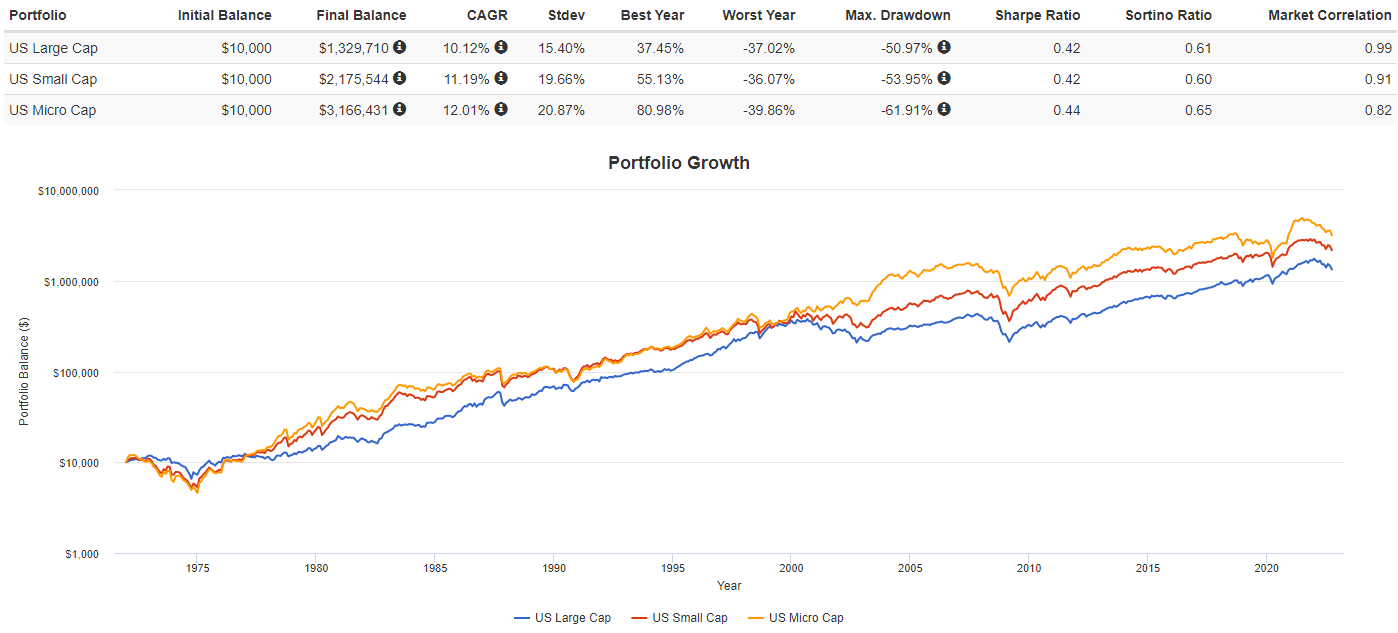
The concern/problem is that this hasn’t been true over the past decade or more. One simple explanation could be the growing importance of institutional investors. Large pension funds and similar funds cannot gain enough exposure to these stocks to justify the research expenses to cover them. Even if they did, a $1b exposure moves the needle very little if you have $50b+ in AUM.
Post-crisis results
The first chart covers from just before the 2000 Tech bubble burst and ran into 2005 before Large-Cap had the better year. Micro-Caps actually had better years in 1998-99 also, coming off the Asian currency crisis.
portfoliovisualizer.com
The second chart shows the 2008-09 GFC where we see Micro-Cap stocks falling, then rising faster than Large-Cap stocks.
portfoliovisualizer.com
Finally, we see how both sets performed going into and out of the COVID crash of 2020. Here the switch over was later and then slower to reverse itself.
portfoliovisualizer.com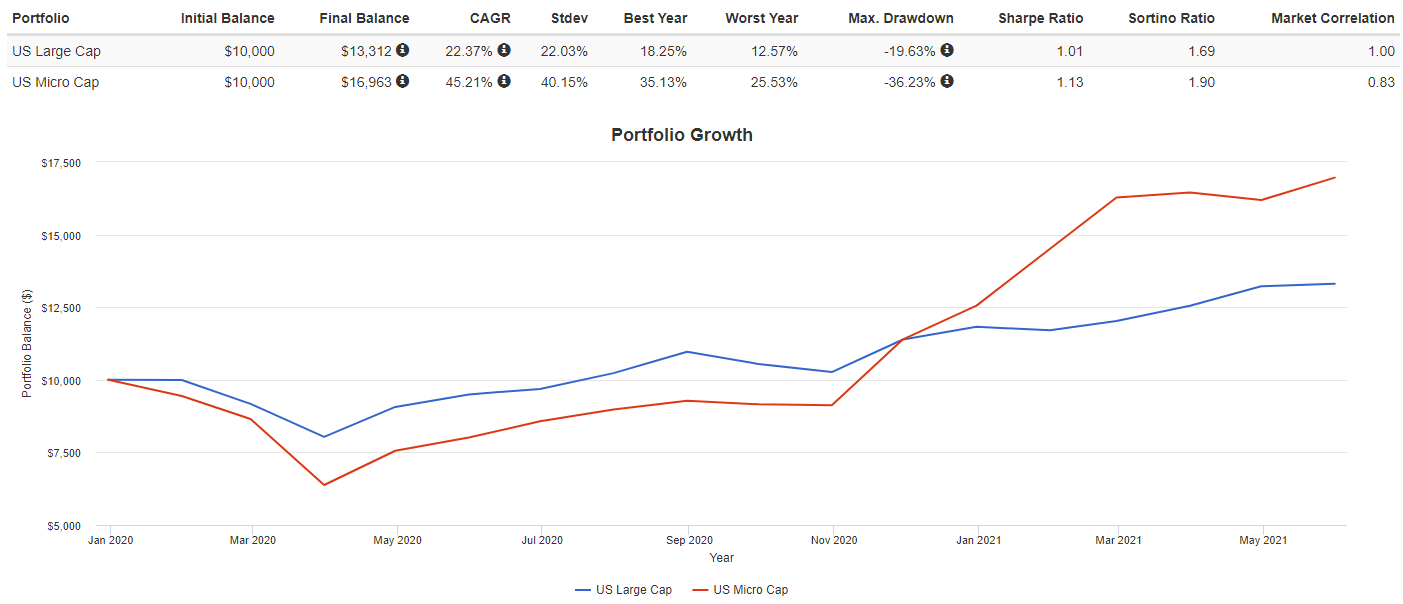
Royce Micro-Cap Trust review
Seeking Alpha describes this CEF as:
The fund seeks to invest in stocks of companies operating across diversified sectors. It primarily invests in value stocks of companies with market capitalization of less than $500 million. The fund benchmarks the performance of its portfolios against Russell 2000 Index. RMT started in 1993.
Source: seekingalpha.com RMT
RMT has $517m in assets and comes with a 135bps fee, up from 120bps at the end of 2021. RMT shows a Forward yield of 10.4%. For a CEF, RMT employs little leverage; currently under 5%.
Royce Investment Partners lists two important points for investors:
- One of the only closed-end funds dedicated to investing in micro-cap stocks. Micro-cap stocks’ market caps are less than the largest stock in the Russell Microcap® Index.
- Core approach that combines multiple investment themes and offers wide exposure to micro-cap stocks by investing in companies with strong fundamentals and/or prospects selling at prices that Royce believes do not fully reflect these attributes.
I have to say I do not understand why RMT benchmarks against the Russell 2000 Index and not the Russell Microcap Index based on the first point, though, as we see next, the R2000 has better results.
Royce provides several charts to support why RMT is a good investment; here are two of those. The first shows RMT against both Russell indices which until recently, RMT has beaten.
royceinvest.com Results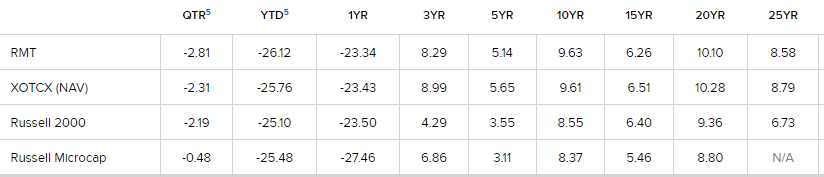
They are proud of their record during down markets, which is a concern for many investors, especially those of us in retirement.
royceinvest.com down markets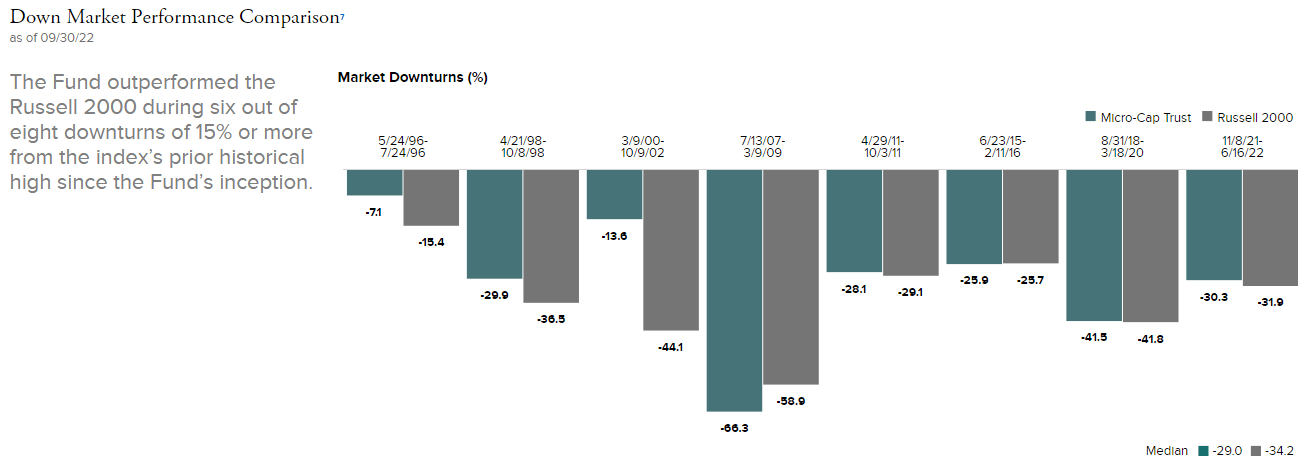
Holdings review
RMT supplies the Morningstar Style chart, which shows RMT to hold smaller stocks with a more growth bent compared to the R2000 index.
royceinvest.com RMT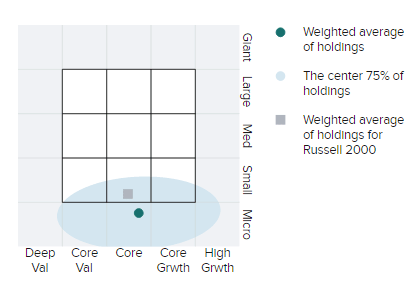
Basic equity statistical data provided includes:
royceinvest.com data-points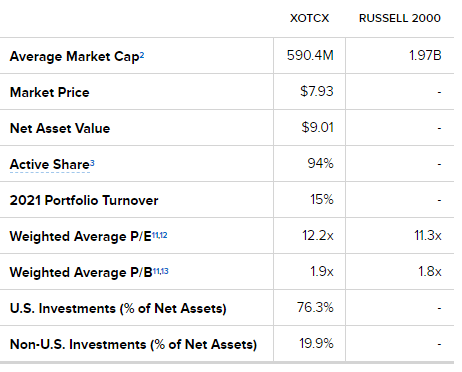
Sectors are (XOTCX is the mutual fund version):
royceinvest.com sectors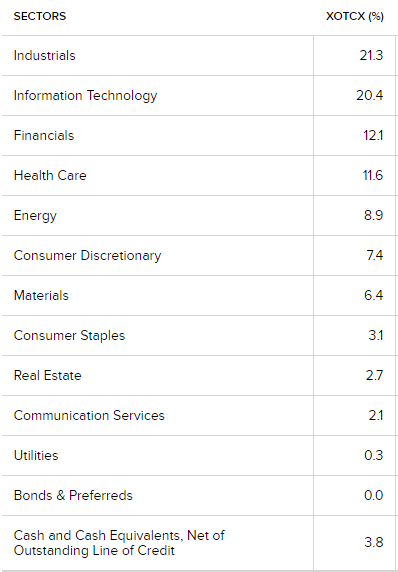
Even at this level of market-cap, technology stocks are a major allocation, only trailing Industrials.
royceinvest.com; compiled by Author
Either by price movement or trades, the Top 20 stocks had three changes from the prior quarter, but also a lot of rearranging in the order outside the Top 4. RMT reported a 15% turnover rate for 2021.
Distribution review
seekingalpha.com RMT DVDs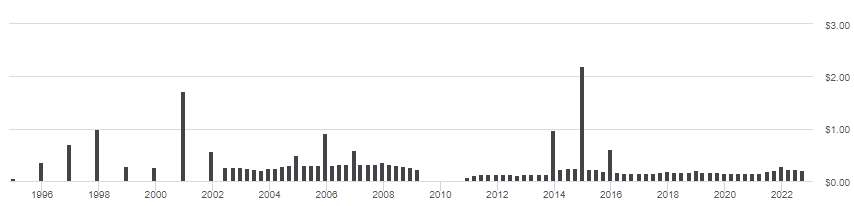
Since 2018, the payouts were generated from the following sources:
royceinvest.com; compiled by Author
In 2022, RMT used ROC (estimated currently) to make their payouts for the first time since 2011. Income accounts for very little of the payout total.
RMT operates with a Managed Distribution Policy, or MDP, defined as:
The Board of Directors from each of Royce Value Trust, and Royce Micro-Cap Trust has authorized an MDP. Under the MDP, Royce Value Trust and Royce Micro-Cap Trust pay quarterly distributions at an annual rate of 7% of the average of the prior four quarter-end net asset values.
Source: royceinvest.com MDP
Price – NAV – CAGR review
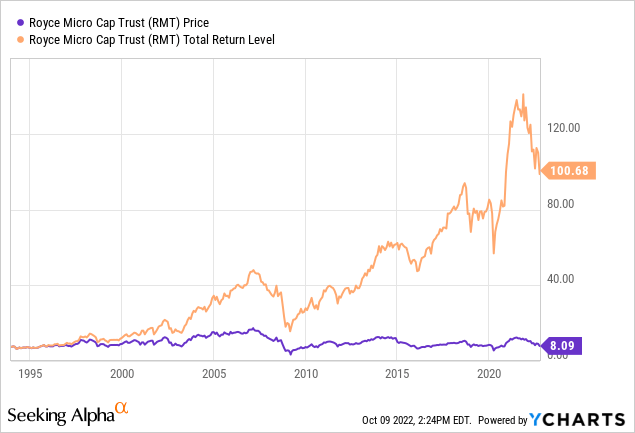
According to CEFConnect.com, the inception price was $10; with an inception NAV of $7.25; which must has disappeared quickly based on the next chart. Since inception, RMT has returned 9.21% for dividend re-investors, but only 5.45% for those who took their payouts. As a comparison, the SPDR S&P 500 ETF (SPY) values were 8.94% and 7.89%, respectfully. RMT has spent most of its life selling at a discount, with today’s standing at 11.68%.
CEFConnect.com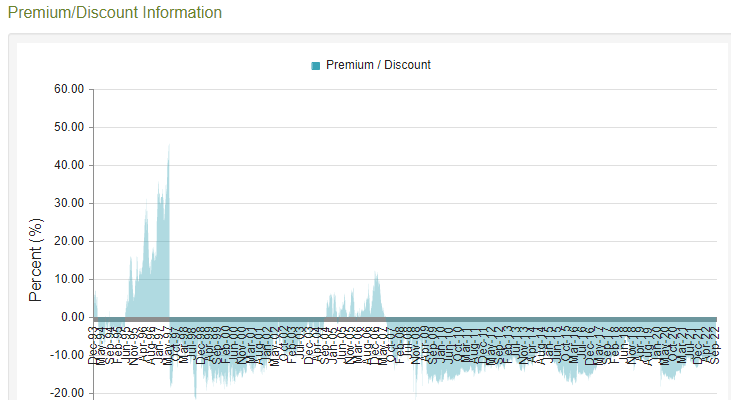
Over the past few years, the discount has mostly been between 10-14%.
Portfolio strategy
One last return chart; this one reflecting how Large-Cap and Micro-Cap stocks performed in 2022 as the FOMC started rising rates and recession fears started, with the US economy showing consecutive quarters of negative GNP growth.
portfoliovisualizer.com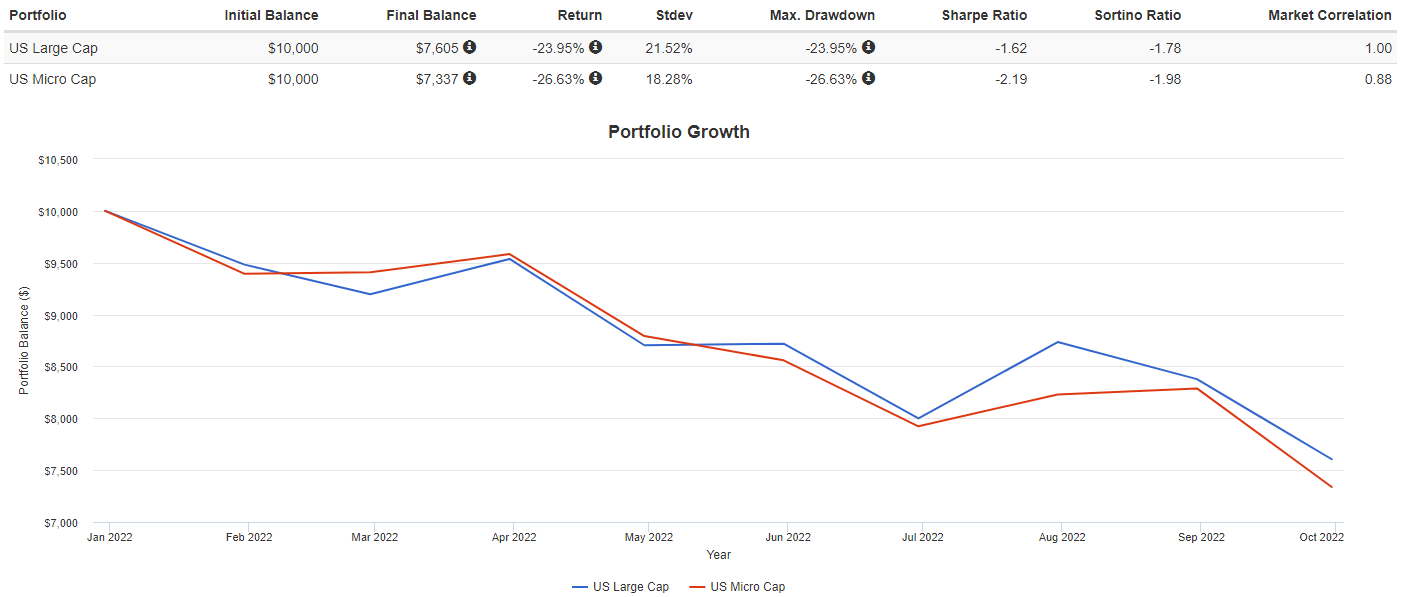
If my reading of the past tea leaves is accurate and indeed history repeats itself, Micro-Cap stocks should start doing better than larger market-cap stocks once interest rates peak and recession fears subside.
Other Micro-Cap choices
I found several funds, some of all three structures (ETF, MF, CEF) investors should review before making the final choice for gaining exposure to this section of the market. With the negatives for these stocks not going away soon, there is plenty of time for due diligence. Here is my list, besides the actively managed CEF discussed in this article:
seekingalpha.com; compiled by Author
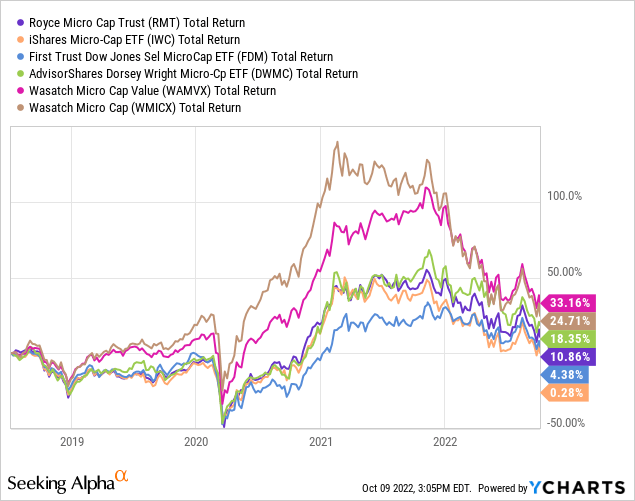
Results are limited by the youngest fund to about three years. Over that time, the two Wasatch MFs (reviewed here) were top performers, with the AdvisorShares Dorsey Wright Micro-Cap ETF (DWMC) next, but note that ETF has almost no volume. The worst performers were both of the passively-managed ETFs, something to keep in mind when analyzing the set listed. As reflective of the PV charts, all popped off the COVID bottom and most peaked in the fall of 2021, when talk of “fighting inflation” took off.
Final thought
Last December I compared RMT against the iShares Micro-Cap ETF (IWC) for interested in a more in-depth look at how they differ: IWC Vs. RMT: Comparing An ETF & CEF That Invest In Micro-Cap Stocks
Be the first to comment