

Agustin Vai/iStock via Getty Images
Thesis
The Royce Micro-Cap Trust (NYSE:RMT) is a closed-end fund that focuses on micro-cap stocks. These micro-cap stocks have market capitalizations between $50 million and $1 billion, and they are generally more volatile but can offer significant upside potential. RMT has outstanding long term trailing total returns, which come in at 11.96% and 12.17% on a 5- and 10-year time frame. What is unique about RMT is the fact that it has outperformed its reference index, the iShares Russell 2000 ETF (IWM), during both those time-frames. It is very rare for a CEF to do so, and it speaks very highly of the management team over at RMT and their ability to deliver outstanding results via the CEF structure.
The vehicle achieved its returns with a 0.56 Sharpe ratio and a 22.34 standard deviation (both measured on a 5-year basis) and a high Sortino ratio of 0.9. The high standard deviation we see for the fund is characteristic of smaller equities, which generally exhibit greater volatility. The fund has a maximum drawdown figure of -39%, and a high beta of 1.22 (5-year measurement window). The fund has a 9.2% dividend yield that represents the conversion of long term capital gains from the underlying portfolio into fund dividends. A stable NAV in the past decade indicates that the management team does a good job of supporting the dividend by picking good investments.
We believe RMT is a very solid, robust CEF that achieves a very rare feat of beating its index. We like RMT and its analytics, and the fund has demonstrated it can post very good long term results. The fund is down more than -11% year-to-date during the market sell-off, and we feel there might be a bit more weakness to come in the equities market in the next months.
For a long-term investor already in the name, 2022 is a blip on the radar, so Hold. New money entering the space can decide to either start dripping in the fund or to attempt to time the market during the summer, when the Fed rate path visibility should provide more stability for the equities asset class.
Holdings
It is important for an investor to understand where RMT fits in the investing universe, as measured by the Morningstar style map.
Morningstar Style Map (Fund Fact Sheet)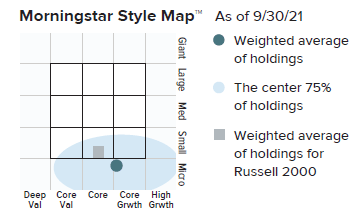
Most investors are familiar with the Large / Medium / Small boxes distributed across Growth / Core / Value. In an extended version, the Micro-Cap sector can be added below the Small cap box, representing those companies where the market capitalization is very small, namely anywhere between $50 million and $1 billion. The primary advantage of investing in small-cap stocks is the significant upside growth potential. Many of today’s large and medium sized companies were at some point categorized as Micro-Caps.
RMT is focused on Information Technology and Industrials when compared to the index sector breakdown.
Portfolio Sectors (Fund Fact Sheet)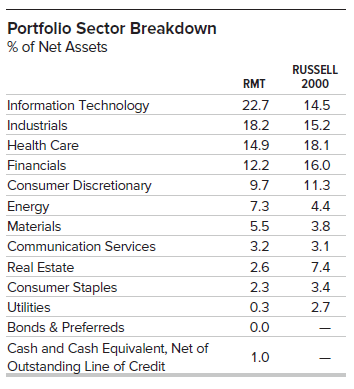
The top 10 names in the fund account for less than 20% of the portfolio.
Top 10 Positions (Fund Fact Sheet)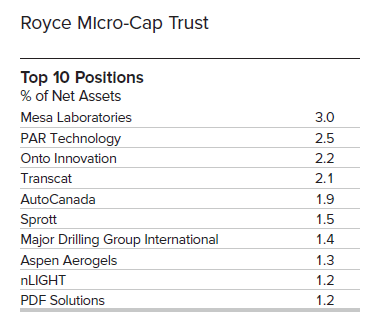
You will notice that you might not recognize any of the names in the above top-10 list. That is occurring because small-caps are not well known names that make the headlines, and their value lies in the upside potential that lies with some of their business models.
PAR Technology Corporation (PAR), for example, is a $1billion market capitalization company that provides technology solutions to the restaurant and retail industries globally. As per the company’s own description “the company operates in two segments, Restaurant/Retail and Government. The Restaurant/Retail segment offers point-of-sale technology solutions, including Brink POS, an open cloud solution that integrates with third party products and in-house systems.“
Through organic growth, acquisitions or mergers of equals, many of these corporations tend to move to the Small and Medium Cap parts of the Morningstar style box throughout time. Their increased value gets reflected in a higher price.
The fund has 281 holdings with strong fundamentals.
Portfolio Fundamentals (Fund Fact Sheet)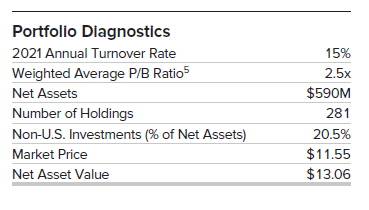
Most of the portfolio companies are in the U.S., with a small allocation to foreign investments (~20.5%). The average net company asset base is at the $590mm level.
Performance
On a long-term basis the fund outperforms the index:
10-Year Total Return (Seeking Alpha)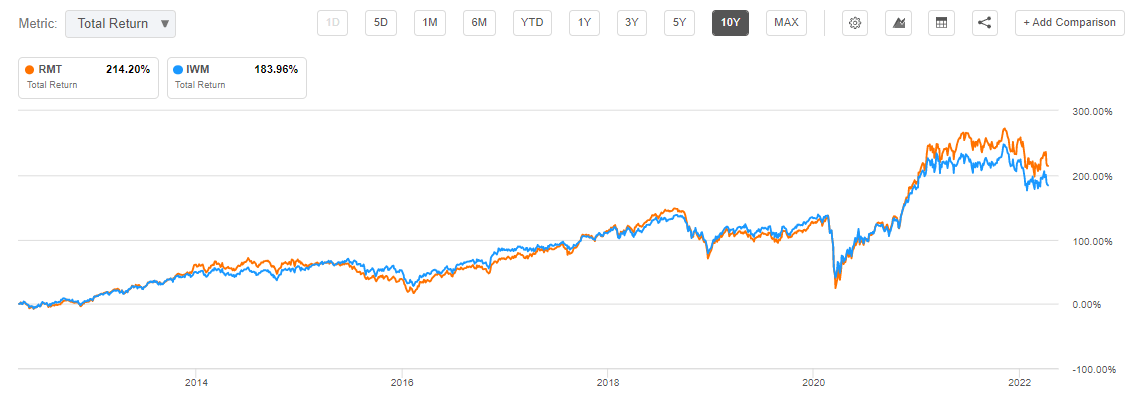
We can see from the 10-year total return chart that RMT actually outperforms the Russell 2000 index on a long term basis. This is rare and unique and speaks very highly of the RMT management team. This CEF is a fund that does what a good closed end management company should – utilize a structuring tool to permit a talented management team to pick stocks which are going to generate alpha and outperform the index. We see so many equity CEFs that on a long-term basis are very much lagging index performances and only manage to garner AUMs via outsized dividend yields.
The 5-year total return chart paints a similar picture.
5-Year Total Return (SeekingAlpha)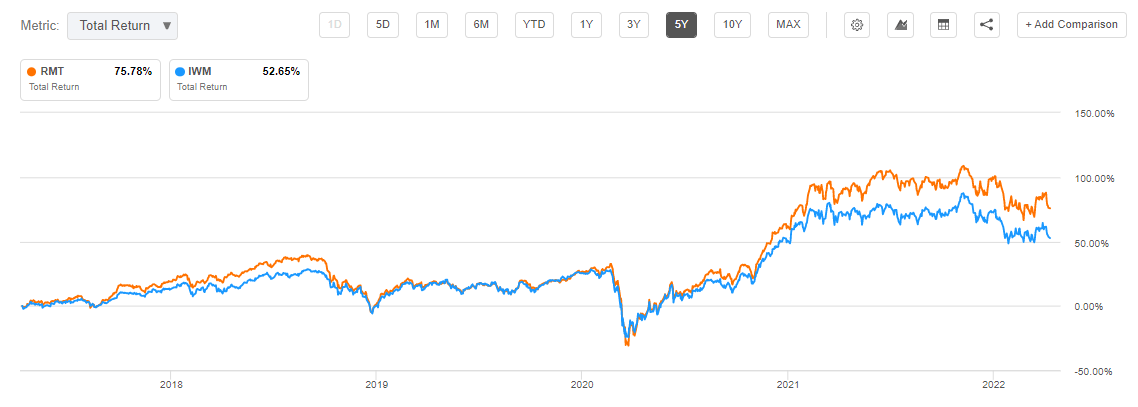
While both RMT and Russell 2000 had significant drawdowns during the Covid pandemic, RMT recovered with a better performance.
Both the fund and the index are down on a year-to-date basis.
YTD Performance (Seeking Alpha)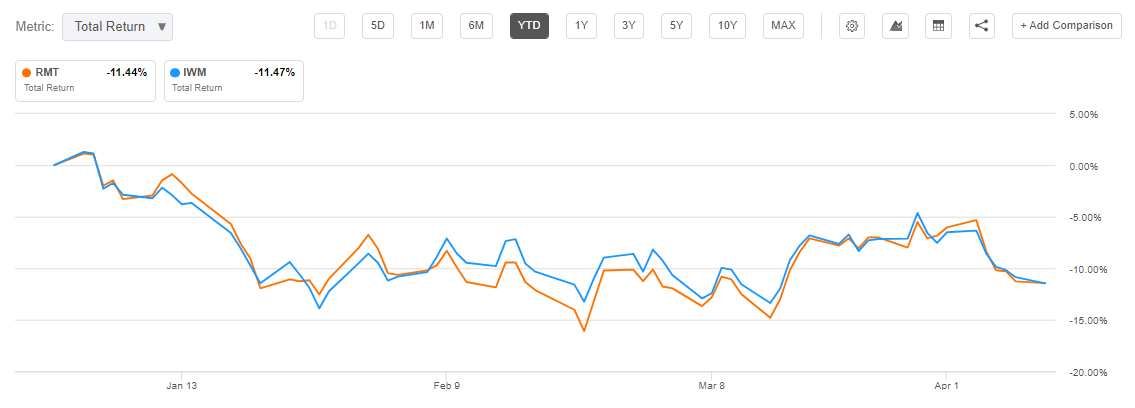
Premium / Discount to NAV
The fund has always traded at a discount to NAV.
Premium / Discount to NAV (Morningstar)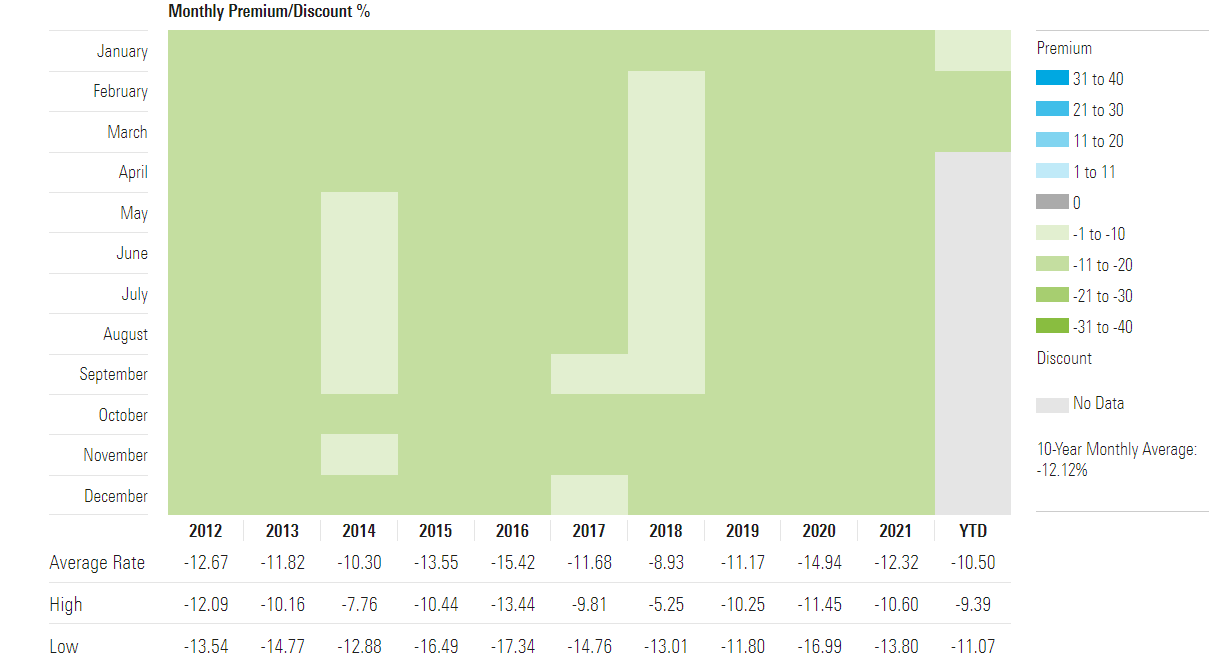
We believe this permanent discount to NAV is the result of the asset class, namely, micro-caps and their propensity to be less liquid (in certain corners / names) than large caps. Similarly, in a liquidation scenario, given the high standard deviation associated with the asset class, one can expect a significant divergence in the obtain portfolio price versus initial NAV expectations.
The discount to NAV has maintained consistency throughout time, with the fund never having traded at a premium to NAV in the past five years.
5-Year Price vs NAV (CefConnect)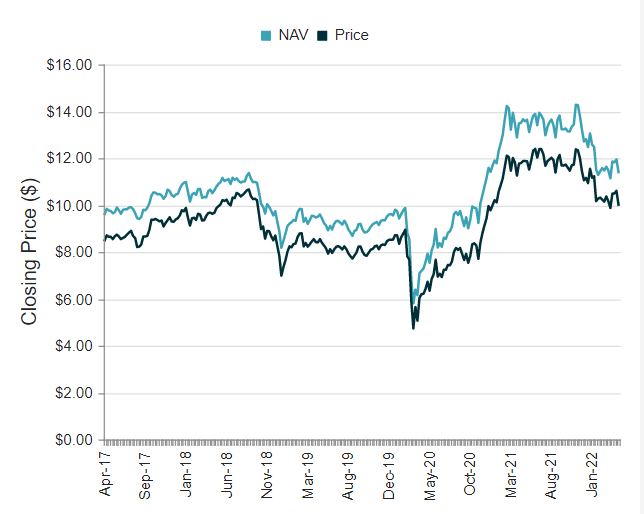
It is also interesting to see that the year-to-date market sell-off has not really affected the discount to NAV, which has hovered at similar levels since the beginning of the year.
YTD Discount to NAV (CefConnect)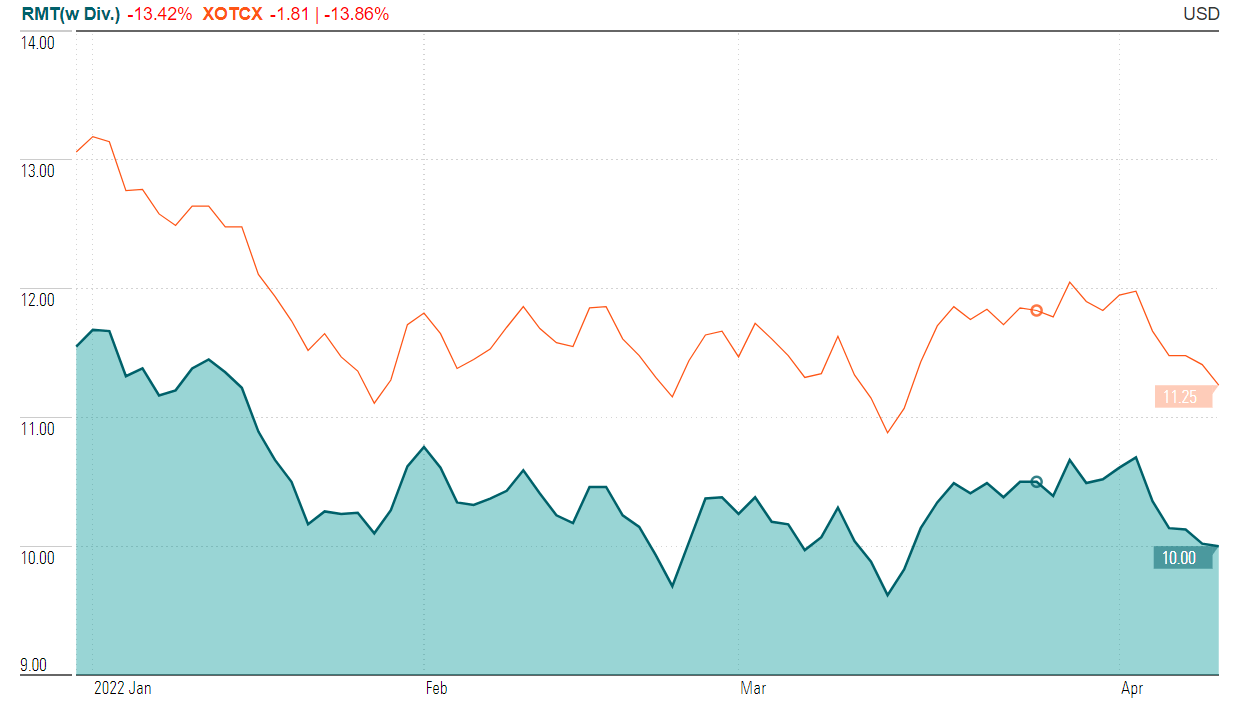
Conclusion
RMT is a closed end fund focused on micro-cap stocks. The fund has achieved very robust long term results, which come in at 11.96% and 12.17% on a 5- and 10-year time frame. More importantly, the fund has achieved a very rare feat of beating its index on a long term buy-and-hold basis.
We like RMT and its analytics, and the fund has demonstrated it can post very good long term results. For a long-term investor already in the name, 2022 is a blip on the radar, so Hold. New money entering the space can decide to either start dripping in the fund or to attempt to time the market later in the summer, when the Fed rate path visibility should provide more stability for the equities asset class.
Be the first to comment