

Andres Victorero
Written by Nick Ackerman, co-produced by Stanford Chemist. This article was originally published to members of the CEF/ETF Income Laboratory on November 11th, 2022.
We covered Cohen & Steers Real Estate Opportunities and Income Fund (NYSE:RLTY) earlier this year. At that time, I was a bit disappointed that the fund had ramped up its leverage so aggressively. It seemed apparent that they could be a bit more patient and conservatively invest their assets in such a volatile market.
Of course, now that the market has dropped even further – particularly for REITs – the declines have come swiftly for this relatively newly launched fund. It had its inception in February of this year. However, besides the declining underlying portfolio, the discount has widened out massively to make it an interesting play at this point. The elevated levels of leverage are still a concern and should be considered before taking any position.
The Basics
- 1-Year Z-score: N/A
- Discount: 13.88%
- Distribution Yield: 7.36%
- Expense Ratio: 1.66%
- Leverage: 37.19%
- Managed Assets: $401.81 million
- Structure: Term (anticipated liquidation date February 23rd, 2034)
RLTY’s investment objective is “high current income.” The secondary objective is for “capital appreciation.” To achieve this, the fund will invest “at least 80% of its managed assets in (i) real estate-related investments, and (ii) preferred and other income securities.” This is pretty straightforward and quite similar to Cohen & Steers’ other real estate-focused funds.
When including leverage expenses, the total expense ratio comes to 2.24%. Again, similar to other C&S funds, RLTY is largely hedged against rising rates and the negative impacts on their leverage costs at this time. 85% of the portfolio is based on a weighted average fixed financing rate of 2.8%. The weighted average term of these fixed borrowings is for 3.8 years.
RLTY Leverage Facts (Cohen & Steers)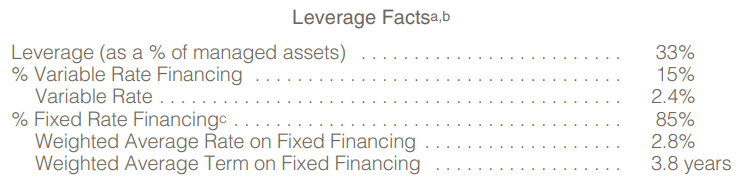
The fund is relatively smaller than its sister funds but generally still provides plenty of liquidity for most investors.
Performance – Lagging Results, Most Attractive Value
The fund remains a sort of middle ground between its sister funds, Cohen & Steers Quality Income Realty Fund (RQI) and Cohen & Steers REIT and Preferred and Income Fund (RNP). By that, I mean that RQI is heaviest in equity with a rather low exposure to preferred. RLTY is around 64% equities and 32% preferred (the other portion in cash and derivatives.) For RNP, they are right around a 50/50 split between equity and preferred.
Despite this, since the fund’s launch, RLTY’s performance on a total NAV return basis has been weaker. The total NAV return basis here is important because that’s more of what they can control as it reflects the underlying portfolio performance. For the total share price basis, that’s what the market dictates and factors in the sharp widening of the fund’s discount.
Ycharts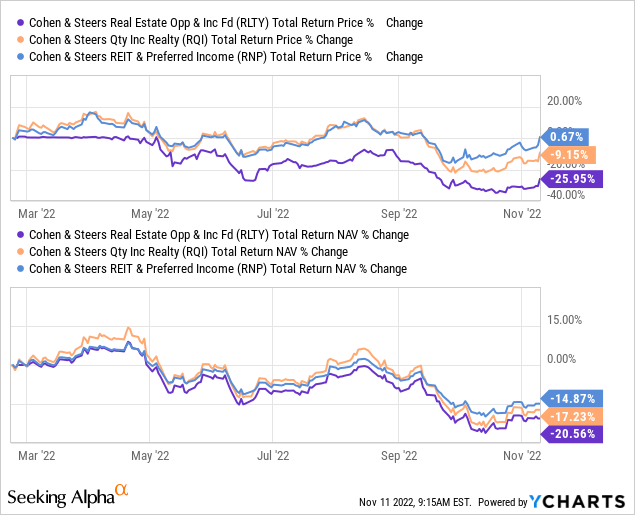
One of the reasons I believe that the performance has been worse for RLTY – when one would otherwise believe it should come right in the middle of RQI and RNP – is due to the fund’s aggressive use of leverage. At an over 37% leverage ratio, that’s in excess of RQI’s ~28% and RNP’s ~30%. Of course, portfolio composition on a more granular level is also likely a factor as well. While these funds carry significant overlap, there are differences in their holdings too.
Due to the newness of the fund, that’s likely one of the leading causes of the larger discount relative to RQI and RNP. As of 11/11/2022, RLTY’s discount comes to -13.88%, while RNP sports a premium of 3.24%, and RQI’s discount is fairly shallow -3.84%. The latest inflation report that showed a cooling had the market swinging violently higher. So over the next several days, these discounts and premiums could change dramatically. The point is that relatively speaking, RLTY is a much better value at this time.
While the results have lagged behind its sister funds thus far, a rapid recovery in the REIT space could mean RLTY also outperforms going forward. When combining the fact that it is the best value at the moment, that should bode well for the fund going forward.
Distribution – Attractive And Reasonable
The fund launched with a monthly distribution of $0.1040, which it continues to maintain. Based on the latest closing data, that works out to a distribution rate of 8.90% and a reasonable NAV rate of 7.67%. When equity funds start pushing near the 10% NAV distribution level, is when I would throw a yellow flag.
The latest annual semi-annual report is for only an abbreviated period of time. Until the next report, we won’t really have a normalized idea of what the fund is generating in terms of net investment income. NII coverage in this report was near 50%, but the timing with the fund’s distribution vs. portfolio inception makes this not comparable. This report shows 3 distributions while the fund was in operation for just over 4 months at this point. Therefore, NII coverage would be anticipated to drop in the next report.
RLTY Semi-Annual Report (Cohen & Steers)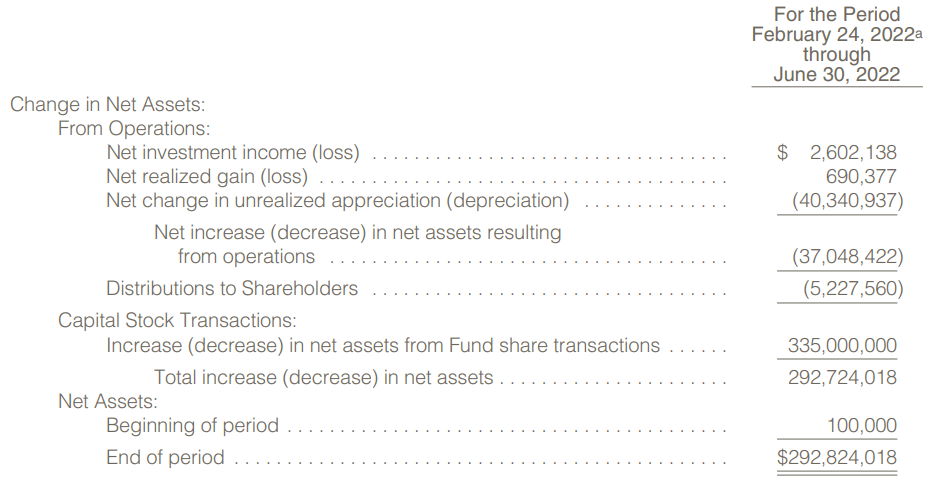
I would expect the coverage to come in between RQI and RNP once again. Of course, when assuming that about the fund’s performance, I was wrong. For some context, RNP’s NII coverage was 50% in their latest semi-annual report, and RQI’s came in at 23.30%. Meaning that RQI relies more heavily on capital gains to maintain its payout. Considering the heavier exposure to equities, that makes complete sense.
RLTY’s Portfolio
The 66/34 split of the portfolio is mostly invested in U.S.-based investments, but not entirely. This portfolio also runs over 10% in Europe, with an even smaller allocation to Asia. The flexibility in global securities can be seen as beneficial. With greater choices, they can invest where they see best at the time.
RLTY Geographic Exposure (Cohen & Steers)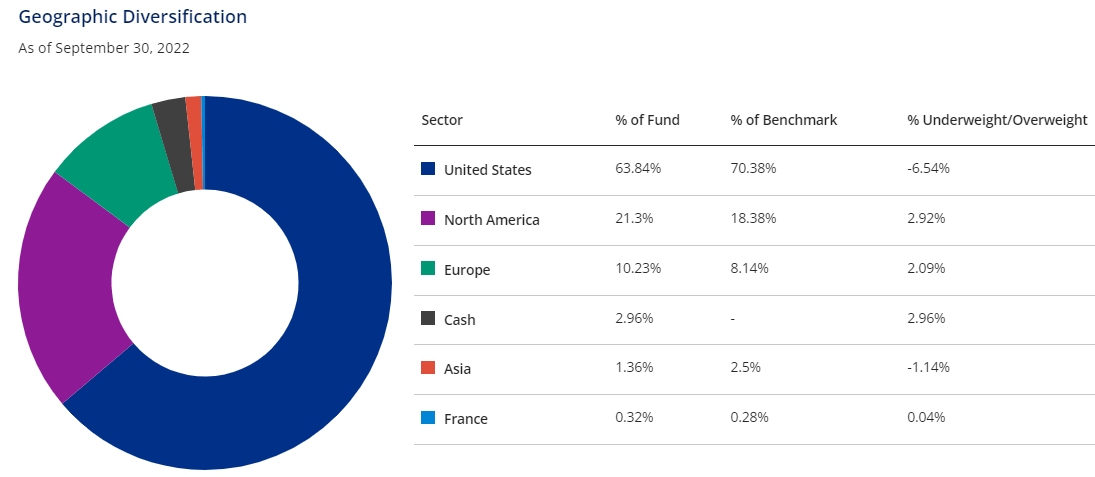
This is one of those more granular and subtle differences between RLTY and RQI/RNP. RLTY is slightly heavier relative to RQI to investments outside the U.S. Yet, RNP holds a slightly larger positioning outside the U.S. than both RQI and RLTY. Europe and Asia make up 16.74% of RNP’s portfolio; for RQI, this comes to 4.23%
As for top positions, that’s where we really start to see overlap between the funds.
RLTY Top Ten Holdings (Cohen & Steers)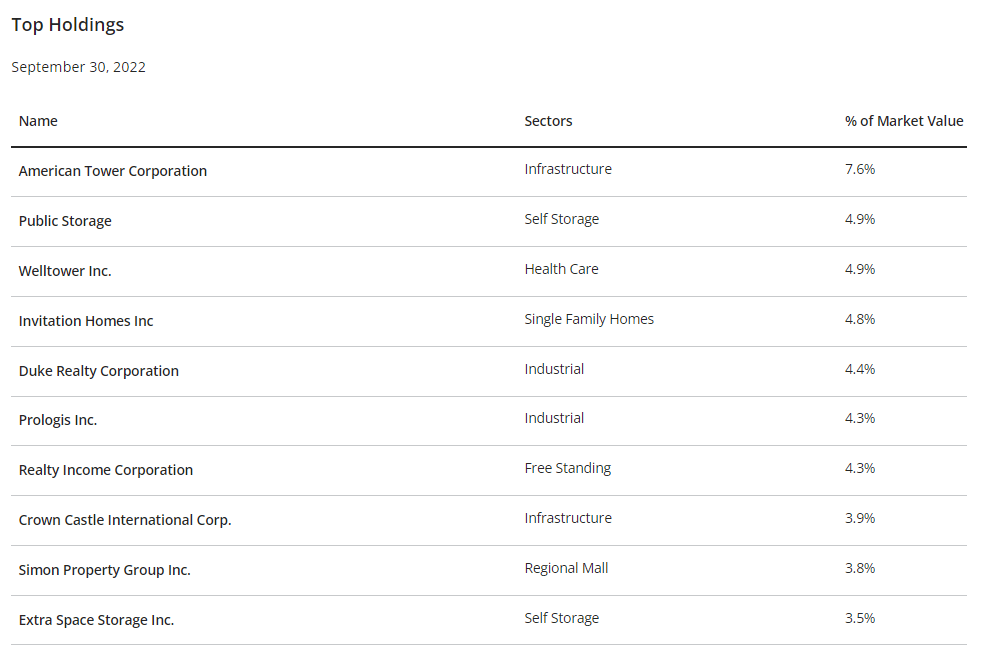
American Tower Corp (AMT), Public Storage (PSA), Welltower (WELL), Duke Realty (DRE), Prologis (PLD) and Crown Castle International (CCI) are all regulars in RQI and RNP. Or they were regulars; at the beginning of October, PLD completed its acquisition of DRE. PLD was already the largest industrial REIT in the world; this made their lead even bigger.
Essentially, these positions really have just gyrated amongst the top ten positions in the sister funds based on market performance but regularly make appearance update after update.
Realty Income (O) has also made an appearance in RQI and RNP more recently. Which is one of the things I highlighted in each of my prior updates on these funds. One of the reasons it was particularly noteworthy is that despite O being a hugely popular REIT name for the dividend growth investor crowd, neither fund had it in any considerable weighting.
For the most part, C&S seems to focus more of an emphasis on growth-style REITs. Those are going to be more of the tower exposure of AMT and CCI. AMT regularly makes a top appearance in each of the portfolios. Currently, it is in the top position in all three as of the end of Q3.
RNP’s positioning in AMT is less aggressive than RQI and RLTY. So it could be argued that RNP actually has the most diversification relative to these two sister funds. That wouldn’t be completely out of line, either. RLTY has 203 positions, RNP carries 302 positions, and RQI has 216 holdings total.
Conclusion
RLTY is attractively priced as a real estate-focused closed-end fund. The fund’s discount, combined with the overall decline in the REIT space for 2022, makes it a more tempting position worth considering. For longer-term investors that believe REITs will recover one day, now could be the time to start nibbling in as no one can time the bottom.
Be the first to comment