


Michael M. Santiago
Thesis
Rivian Automotive, Inc. (NASDAQ:RIVN) stock fell nearly 25% from our previous update to its May lows after its post-IPO lock-up selling triggered massive selling pressure. However, it appears that the market capitalized on the liquidation, as its buying support returned robustly to absorb the selling downside and formed its bottom.
RIVN has also recovered remarkably, rejecting further downside in June, and held its May lows resiliently. However, we did not pull the trigger in June, even though we observed that it found buying support. There were too many high-quality growth stocks to choose from, given the tech/growth bear market.
However, an opportunity to create a directionally bearish set-up has appeared on RIVN’s medium-term chart. As a result, investors who leveraged astutely on its May bottom can also consider cutting exposure and rotating to other growth stocks.
As such, we revise our rating on RIVN from Hold to Sell, with a price target (PT) of $27 (implied downside of 15.6% as of July 27’s close).
RIVN Held Its May Lows Resiliently
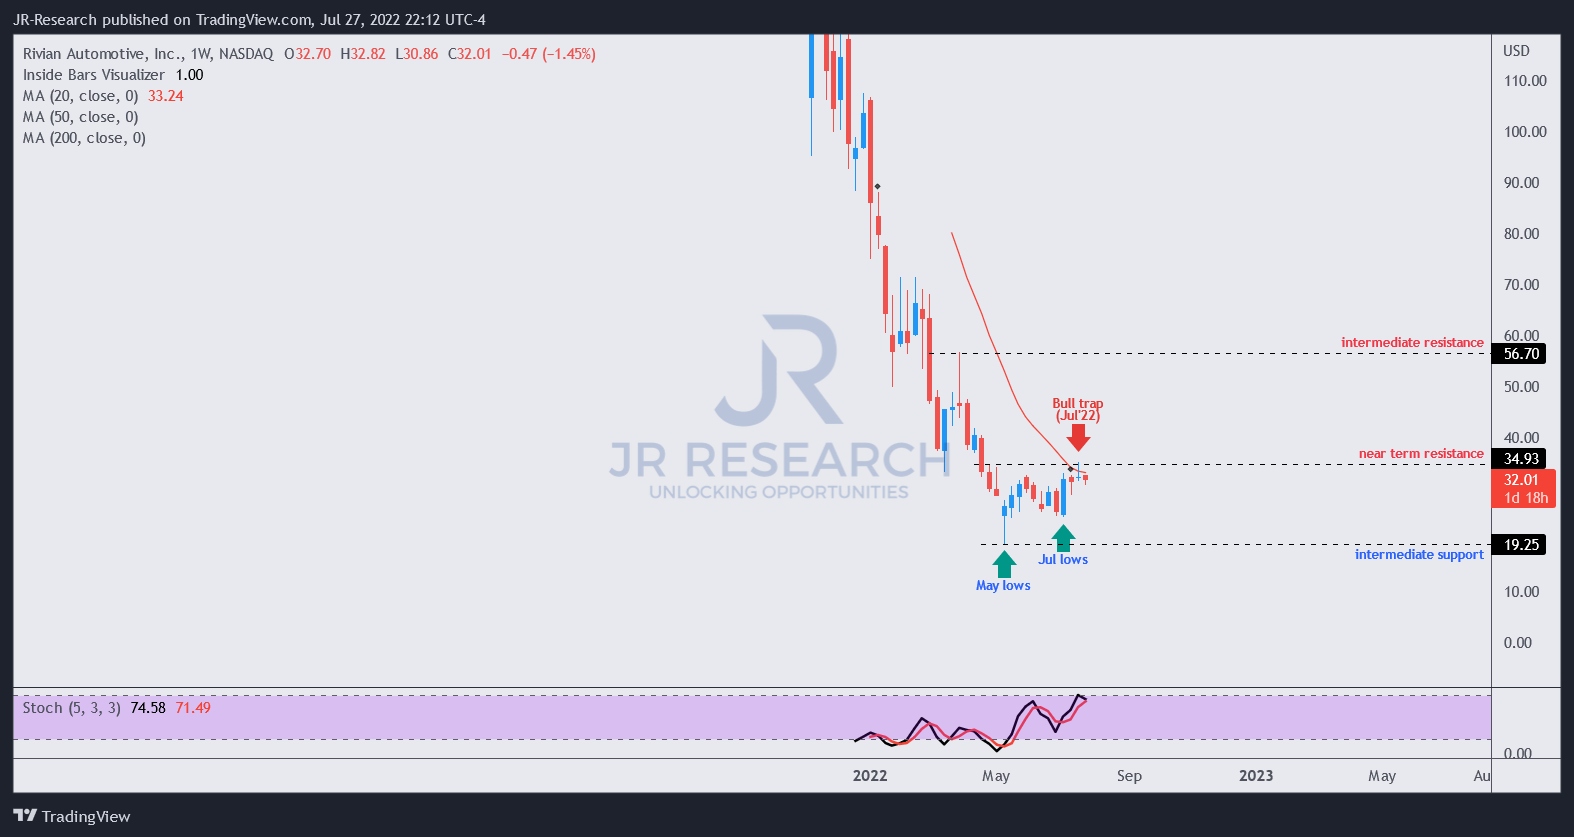
RIVN price chart (weekly) (TradingView)
A glance at RIVN’s medium-term chart unveils a robust bottom in May, which suggested the market anticipated selling pressure to unfold post-IPO lock-up.
The selling downside was so intense that RIVN fell nearly 25% from our previous article. However, the buying momentum returned remarkably to absorb all that pressure, rejecting the bears decisively.
Furthermore, RIVN also held its June lows, which did not break below its May lows. As a result, it appears that RIVN has bottomed out in the medium-term, as the market looks ahead to RIVN executing its multi-year EV growth opportunity.
However, RIVN formed a bull trap (indicating the market rejected further buying upside decisively) last week. Therefore, we believe the market could be gearing up to send it down further, digesting its recent buying momentum. Moreover, the recovery has also sent RIVN into medium-term technically overbought zones, corroborating our observation.
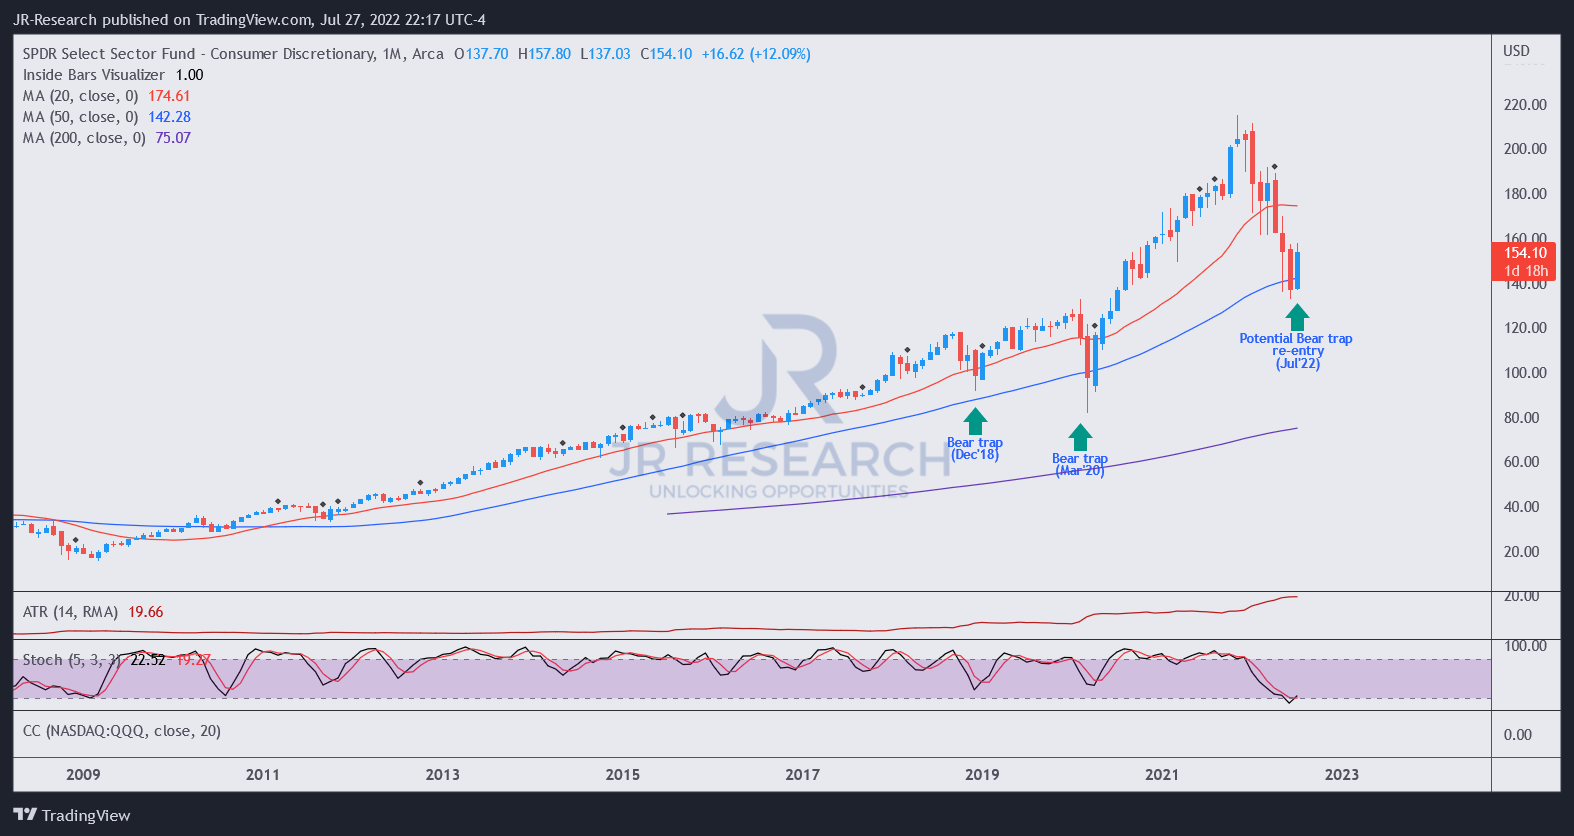
XLY price chart (monthly) (TradingView)
Also, we believe the re-rating in RIVN can also be attributed to the long-term bottom in the Consumer Discretionary ETF (XLY). As seen above, XLY formed a bear trap (indicating the market decisively denied further selling downside) in May.
However, the set-up was initially invalidated in June before the market revalidated it in July (pending confirmation by the end of July). Therefore, we believe the long-term bottom in the XLY seems robust.
Hence, we believe XLY’s robust buying momentum also helped RIVN stage its robust recovery in July.
But, Rivian Is Still Too Speculative
Rivian pleasantly surprised the market as it released its early July Q2 production and delivery report. The company produced 4,401 vehicles and delivered 4,467 vehicles.
Therefore, the Street (bullish) turned more optimistic about Rivian’s production cadence, suggesting that the company’s execution is on track. Baird highlighted (edited):
Rivian has faced growing pains as it has started production. But its announcement of the production of 4,401 vehicles and delivery of 4,467 vehicles, along with a reiteration of its target for 25,000 units in annual production, is a step in the right direction. – The Fly
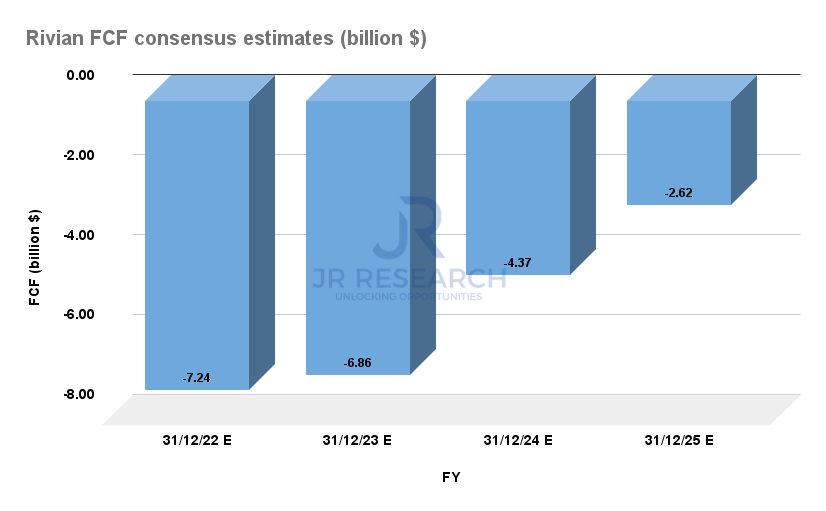
Rivian FCF consensus estimates (S&P Cap IQ)
However, the company’s ability to scale rapidly will also result in a massive cash burn, as seen above. Rivian reported cash and equivalents of $16.43B in Q1. However, the company is expected to burn through $21.09B in cash through FY25.
Therefore, it would likely behoove management to tap additional financing, but it could impact shareholders (if dilutive) and also affect its valuation.
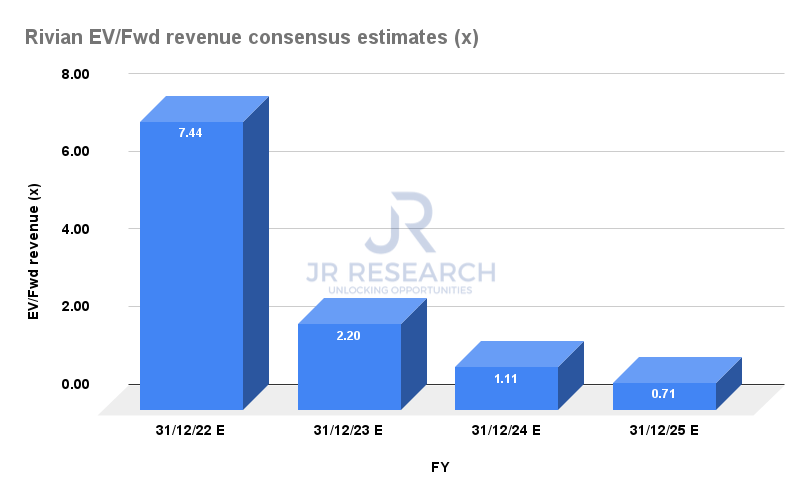
RIVN forward revenue multiples (S&P Cap IQ)
RIVN last traded at an NTM EV/Revenue of 4.98x. However, investors need to be very careful in using revenue multiples valuation to assess RIVN’s relative valuation, given its lack of free cash flow (FCF) profitability.
Rivian’s net cash position was worth about $14.86B in Q1. However, given its massive cash burn through FY25, the company’s net cash position is expected to be eroded further, impacting its EV/revenue valuation.
Therefore, we believe it explains why its FY25 revenue multiple seems so low for a high-growth company. But, that’s because Rivian is still expected to burn through lots of cash, which needs to be accounted for in investors’ EV/Revenue-based valuation models.
We believe the company is cognizant of the scale and financing challenges moving forward in the current demanding macro environment. CEO RJ Scaringe also highlighted in a recent internal email as Rivian announced a 6% cut to its workforce. WSJ reported:
Inflation, rising interest rates and raw-material costs had made it more difficult for companies to raise additional cash, Chief Executive RJ Scaringe wrote in an email to employees announcing the layoffs. “We need to be able to continue to grow and scale without additional financing in this macro environment,” Mr. Scaringe wrote.
Is RIVN Stock A Buy, Sell, Or Hold?
We revise our rating on RIVN from Hold to Sell, with a near-term PT of $27.
We urge investors to consider using the current resistance level to cut exposure and rotate to higher-quality growth stocks.
Rivian still has much to prove in its ability to scale. Furthermore, its financing requirements could continue to undermine its re-rating potential if the company faces unexpected manufacturing challenges moving forward.
Hence, we believe investors should treat RIVN as a highly speculative stock and be nimble in their exposure management.
Be the first to comment