


Kevin Dietsch/Getty Images News
Rivian Automotive (NASDAQ:RIVN) reported Q3 results after market hours on Nov. 9, beating expectations on earnings, but slightly missing on revenue. The shares, which had fallen by about 10% during regular market hours, rallied strongly following the report and are currently up by about 17% on Nov. 10. The shares have been boosted by a CPI report that shows lower-than-expected inflation, resulting in a broad market rally for the day.
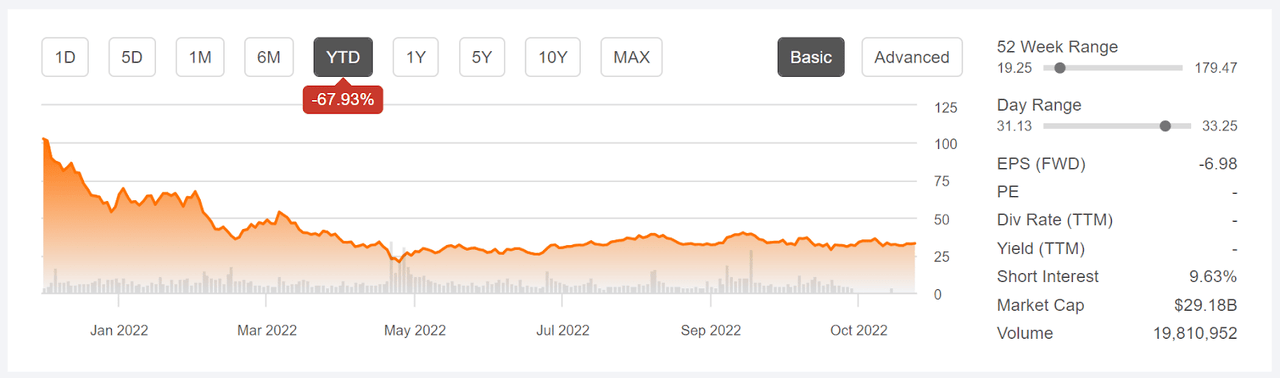
RIVN has been battered by rising interest rates and a subsequent shift in assets away from stocks that rely on extremely rapid growth projections as the foundation of their value. The shares are down 67.9% so far in 2022, as compared to declines of 53.1% for Tesla Motors (TSLA) and 70.4% for Lucid Motors (LCID) . The longer it’s expected to be until earnings are realized, the larger the negative impact from rising interest rates. Tesla is considerably further along in its growth cycle and has achieved positive earnings, so it’s expected that rising rates will have less of an impact on TSLA than on RIVN or LCID. RIVN’s recall in October also contributed to the YTD share decline.
Seeking Alpha
YTD price history and basic statistics for RIVN (Source: Seeking Alpha)
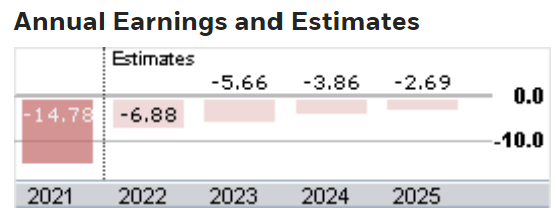
The Q3 EPS came in at -$1.57 per share, and the current consensus estimate is that EPS for the full year will come in at -$6.88 per share. The estimated full-year EPS for 2025 is -$2.69 per year.
ETrade
Consensus annual EPS outlook for RIVN (Source: ETrade)
RIVN’s Q3 results demonstrate how quickly the company is growing, albeit from a very small base. The company produced a total of 7,300 vehicles in Q3, across its R1T, R1S, and EDV vehicle lines. On the earnings call for Q3, management reaffirmed the full-year guidance of 25,000 vehicles produced in 2022. There’s considerable enthusiasm and positive press around Rivian’s vehicles. Management stated that there are 114,000 preorders for the Rivian R1 and noted that the R1T was named MotorTrend’s truck of the year. Another substantial step was the September announcement of a strategic partnership with Mercedes Benz to produce electric vans.
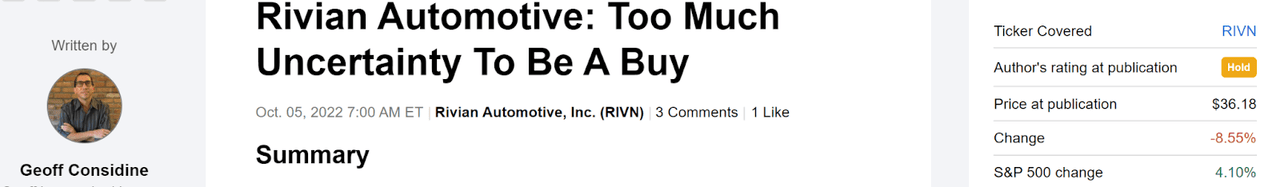
I last wrote about RIVN on Oct. 5, prior to the recall. At that time, I assigned a hold / neutral rating on the stock. Because so much of the valuation comes from projected growth, my opinion on the stock was based on two forms of consensus outlooks. The Wall Street analyst consensus rating was a buy, as it had been for all of the past 12 months. The consensus 12-month price target was about 41% above the share price at that time.
One significant red flag from looking at the Wall Street consensus was the large dispersion among the individual analyst price targets. One study found that the returns implied by the consensus price target are positively correlated with subsequent realized returns when this dispersion is low, but the correlation is negative when the dispersion is high. The high return implied by the consensus price target, combined with the large spread in the individual price targets, may be a bearish indicator (although this is based on just one study).
Seeking Alpha
Previous post on RIVN and subsequent performance vs. the S&P 500 (Source: Seeking Alpha)
The second type of consensus that I considered was the market-implied outlook, a probabilistic price forecast that represents the aggregate view of buyers and sellers of options on a stock. The market-implied outlook for RIVN to mid-January of 2023 (calculated using the prices of options that expire on Jan. 20, 2023) was slightly bearish, with expected volatility of 82% (annualized). The market-implied outlook calculated using options expiring on June 16, 2023, was more bearish, with expected volatility of 82%, matching the shorter-term outlook.
Given the positive overall reception for Rivian’s early vehicles and the company’s early stage in scaling production, my inclination was to give RIVN the benefit of the doubt. With the bullish Wall Street consensus, the consensus price target implying a 41% gain for the next year (albeit with high dispersion), and the bearish market-implied outlooks, I compromised with a hold / neutral rating on the shares. From Oct. 5 until today, including the big post-earnings rally so far on Oct. 10, RIVN has returned -8.55% vs. +4.1% for the S&P 500.
For readers who are unfamiliar with the market-implied outlook, a brief explanation is needed. The price of an option on a stock is largely determined by the market’s consensus estimate of the probability that the stock price will rise above (call option) or fall below (put option) a specific level (the option strike price) between now and when the option expires. By analyzing the prices of call and put options at a range of strike prices, all with the same expiration date, it’s possible to calculate a probabilistic price forecast that reconciles the options prices. This is the market-implied outlook. For a deeper explanation and background, I recommend this monograph published by the CFA Institute.
With the large-scale recall announced since my last post, along with the Q3 results, I have calculated updated market-implied outlooks for RIVN and compared these with the current Wall Street consensus outlook to see whether there are material changes.
Wall Street Consensus Outlook for RIVN
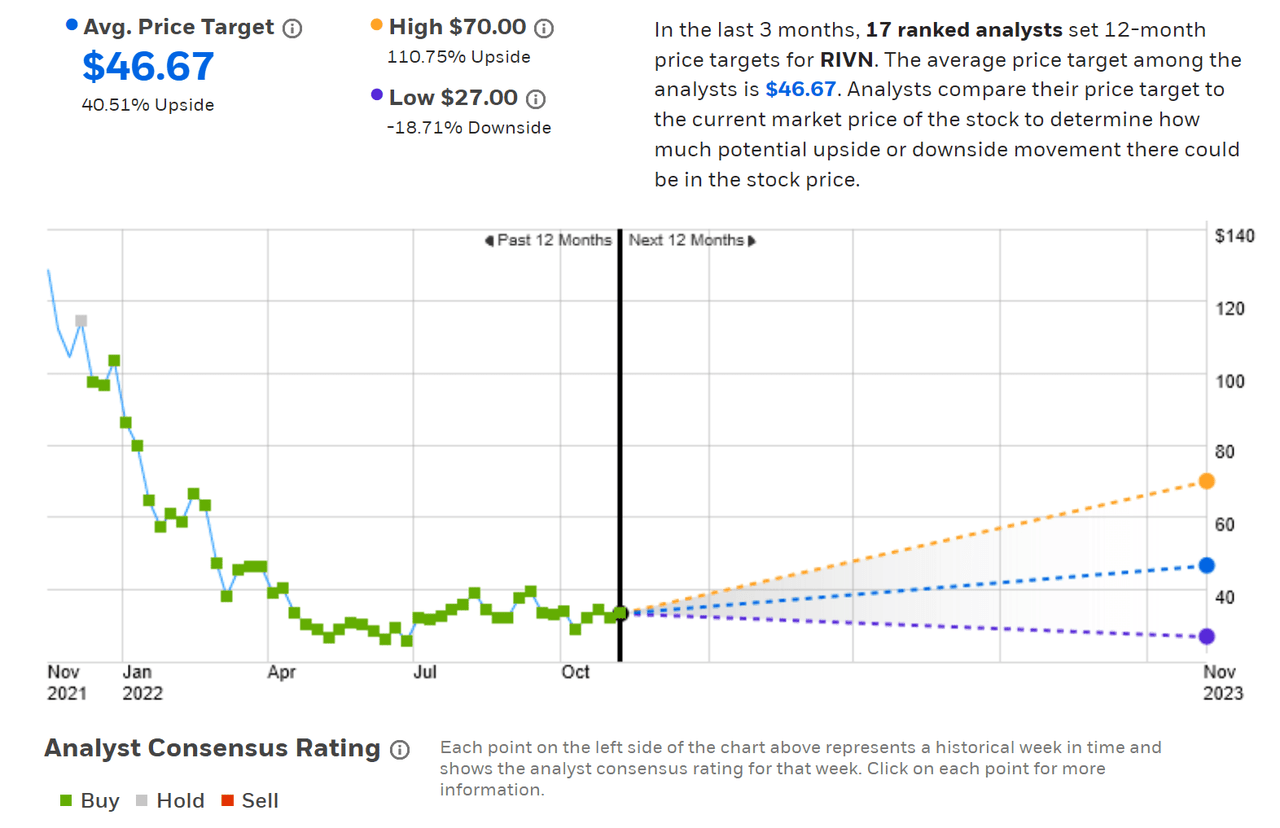
ETrade calculates the Wall Street consensus outlook for RIVN using the views of 17 ranked analysts who have published ratings and price targets within the past three months. The consensus rating is a buy and the consensus 12-month price target is $46.67, down 5% from Oct. 5 when the consensus price target was $49.14. I track dispersion in the price targets by looking at the ratio of the highest and lowest values. The ratio is currently 2.59 ($70 / $27), as compared to a ratio of 2.8 on Oct. 5. As a rule of thumb, I strongly discount the consensus price target when this ratio exceeds a value of 2.
ETrade
Wall Street analyst consensus rating and 12-month price target for RIVN (Source: ETrade)
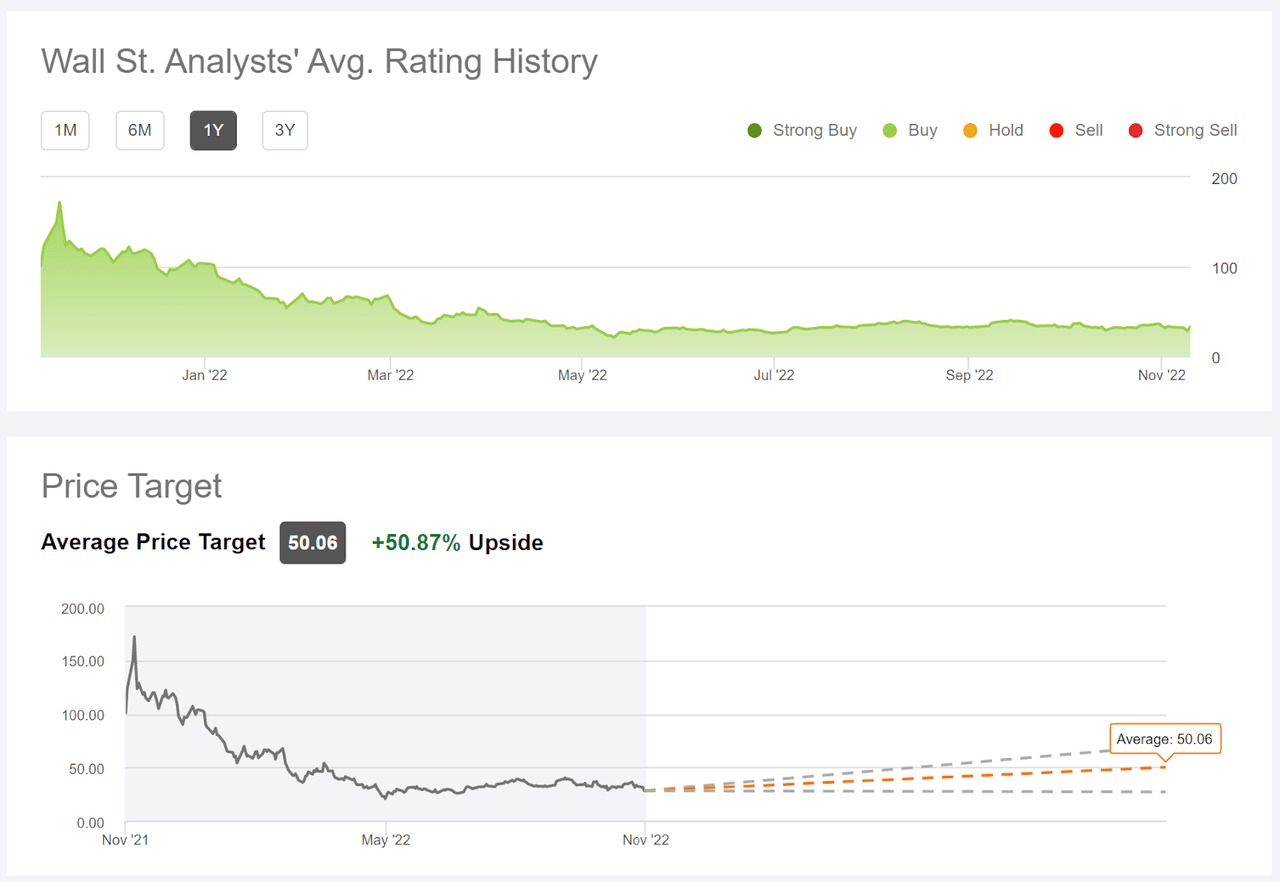
Seeking Alpha’s version of the Wall Street consensus outlook is based on price targets and ratings from 19 analysts who have published opinions in the past 90 days. The consensus rating is a buy and the consensus 12-month price target implied a return of 50.9% over the next year.
Seeking Alpha
Wall Street analyst consensus rating and 12-month price target for RIVN (Source: Seeking Alpha)
The Wall Street consensus outlook for RIVN has not changed materially since Oct. 5, even with the massive recall announced in October. Whether or not we will see substantive revisions in response to the Q3 results remains to be seen. The dispersion in the analyst price targets is a concern, but is far lower than for TSLA, for example.
Market-Implied Outlook for RIVN
I have calculated the market-implied outlook for RIVN for the 2.3-month period from now until Jan. 20, 2023, and for the 7.2-month period from now until June 16, 2023, using the prices of call and put options that expire on these dates. I selected these two expiration dates to provide a view through the end of 2022 and to the middle of 2023. In addition, options with expiration dates in January and June tend to be highly traded, increasing the confidence in the representativeness of the market-implied outlook.
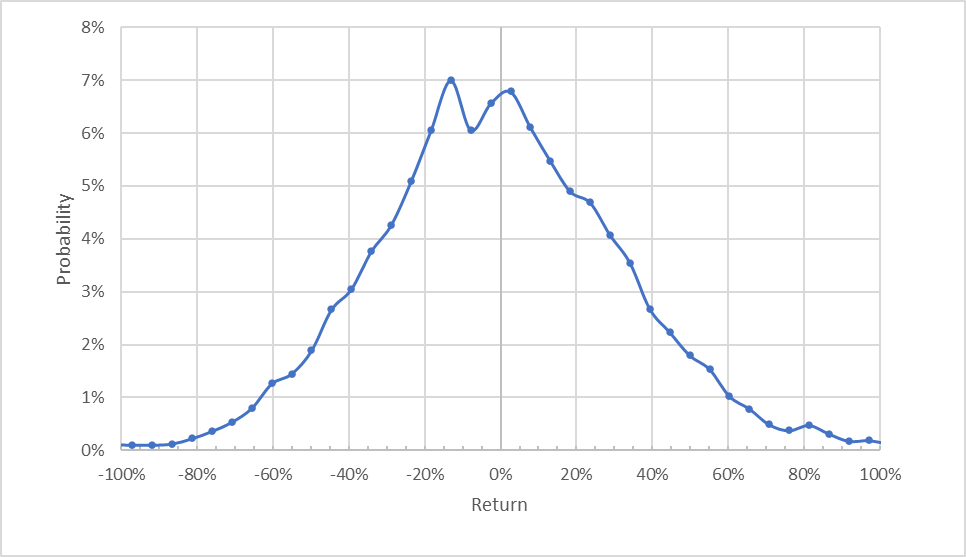
The standard presentation of the market-implied outlook is a probability distribution of price return, with probability on the vertical axis and return on the horizontal.
Geoff Considine
Market-implied price return probabilities for RIVN for the 2.3-month period from now until January 20, 2023 (Source: Author’s calculations using options quotes from ETrade)
The market-implied outlook for RIVN to Jan. 20, 2023, has the peak in probability shifted slightly to favor negative returns. The expected volatility calculated from this outlook is 77.6% (annualized), down slightly from the expected volatility of 82% that I calculated on Oct. 5. The shape of this outlook is qualitatively similar to the results from Oct. 5, including the small double hump in the maximum probabilities, with the absolute peak shifted to the negative returns.
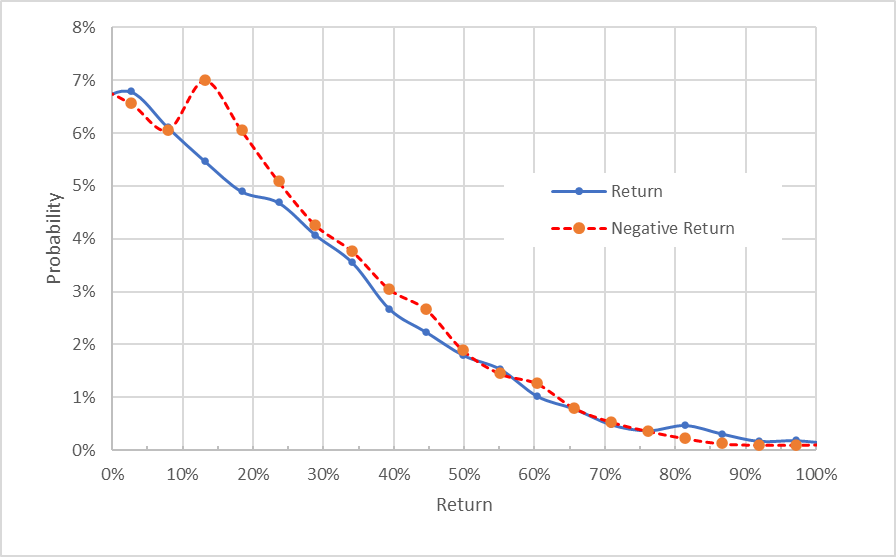
To make it easier to compare the relative probabilities of positive and negative returns, I rotate the negative return side of the distribution about the vertical axis (see chart below).
Geoff Considine
Market-implied price return probabilities for RIVN for the 2.3-month period from now until Jan. 20, 2023. The negative return side of the distribution has been rotated about the vertical axis (Source: Author’s calculations using options quotes from ETrade)
This view shows that the probabilities of positive and negative returns are closely matched over a wide range of outcomes, although the maximum probability at a return of -13% and a range around that value indicates a bearish tilt. This is a less obvious negative-leaning asymmetry than in the previous analysis.
Theory indicates that the market-implied outlook is expected to have a negative bias because investors, in aggregate, are risk averse and thus tend to pay more than fair value for downside protection. There’s no way to measure the magnitude of this bias, or whether it’s even present, however. The expectation of a negative bias leads me to interpret this outlook as predominantly neutral or just slightly bearish.
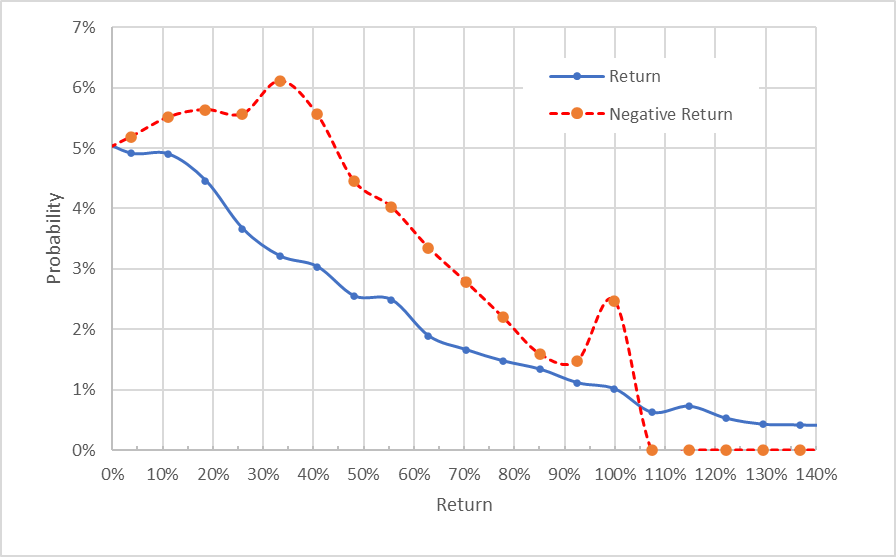
The market-implied outlook for RIVN for the 7.2-month period to June 16, 2023, is markedly bearish, with substantially elevated probabilities of negative returns vs. positive returns, across a wide range of the most probable outcomes. The maximum probability corresponds to a price return of -33% and the expected volatility is 82.9% (annualized). This is a significantly bearish outlook, even considering the expected negative bias.
The secondary peak in probability corresponding to a -100% return occurs at a much lower probability than in the results from Oct. 5, showing that the prices of put options with strikes far below the current share price have moderated over the past five weeks. As I noted in that earlier post, the probabilities of extreme events are unlikely to be well represented by the market-implied outlook so I don’t consider these estimated probabilities to be meaningful.
Geoff Considine
Market-implied price return probabilities for RIVN for the 7.2-month period from now until June 16, 2023. The negative return side of the distribution has been rotated about the vertical axis (Source: Author’s calculations using options quotes from ETrade)
It’s interesting that the short-term market-implied outlook has become less bearish, while the same cannot be said for the view to the middle of 2023. The expected volatility is very high for both outlooks. For context, I calculated the expected volatilities for TSLA for these same option expiration dates in a post on Nov. 8. The expected annualized volatilities were 62% and 63% for the January and June options, respectively.
Summary
Rivian’s Q3 results suggest that the company is advancing as rapidly as can reasonably be expected. The early reception for the Rivian vehicles is very positive and the company has an impressive vote of confidence with 114,000 pre-orders on the books. The uncertainties facing the company at its current stage are, of course, enormous. This is reflected in the substantial spread in analyst opinion and in the extremely high expected volatility reflected in options prices.
The Wall Street consensus outlook continues to be a buy and the consensus price target is 40% to 50% above the prevailing share price, although I have little confidence in the meaningfulness of this target given the dispersion in the individual analyst price targets. The market-implied outlook is neutral or perhaps very slightly bearish to mid-January, but substantially bearish to the middle of 2023, with expected volatility of around 80% (annualized).
Both the Wall Street consensus and market-implied outlooks are largely unchanged from early October. Enough time has passed since the recall that its implications are certainly reflected in both analyst views and options prices. It’s possible the analysts will take some time to process the Q3 results, but I expect that the options market can respond more rapidly. Neither the recall nor the generally favorable Q3 results alter the longer-term view.
RIVN is an innovative company which has not yet demonstrated the ability to scale at the very rapid clip needed to justify the current valuation. This is a statement of the enormous challenges of building a car company from the ground up rather than a criticism of the company or its managers. I’m maintaining a hold / neutral rating on RIVN.
Be the first to comment