

The dollar is the world’s reserve currency, which means it is the foreign exchange instruments that most central banks hold in their reserves. The euro is the second choice when it comes to the currency, central banks around the world hold.
A reserve currency reflects economic stability and is freely convertible, offering liquidity. The dollar index reflects the value of the US currency against a group of other leading world currencies. The composition of the index includes a 57.6% exposure to the euro. The dollar index reached a low of 88.15 in February 2018 after falling from a peak of 103.815 in early 2017. The 2017 high was the highest level for the index since 2002; the low was the lowest since 2014. For more than two years, the dollar index made higher lows and higher highs, with the last peak coming in February at 99.815. The dollar stopped just short of the 100 level before reversing and declining as concerns over Coronavirus gripped markets across all asset classes.
The current risk-off conditions in markets had weighed on the dollar index early last week, but the dollar bounced as volatility in all markets translated to confusion and wide price variance in the foreign exchange arena. The Invesco DB US Dollar Index Bearish Fund (UDN) appreciates as the dollar index drops.
The dollar index is all about the euro
Since the euro currency comprises over half of the dollar index, the euro versus the US dollar currency pair has a significant impact on the direction of the index.
The US dollar index trades on the Intercontinental Exchange and reflects the dollar’s value relationship with the following liquid currencies:
Source: ICE
As the chart illustrates, the path of least resistance for the euro versus the dollar dominates the index.
Another new high and a correction, then a bounce
After a decline from 103.815 in early 2017, the dollar index fell to a low of 88.15 in mid-February 2018.

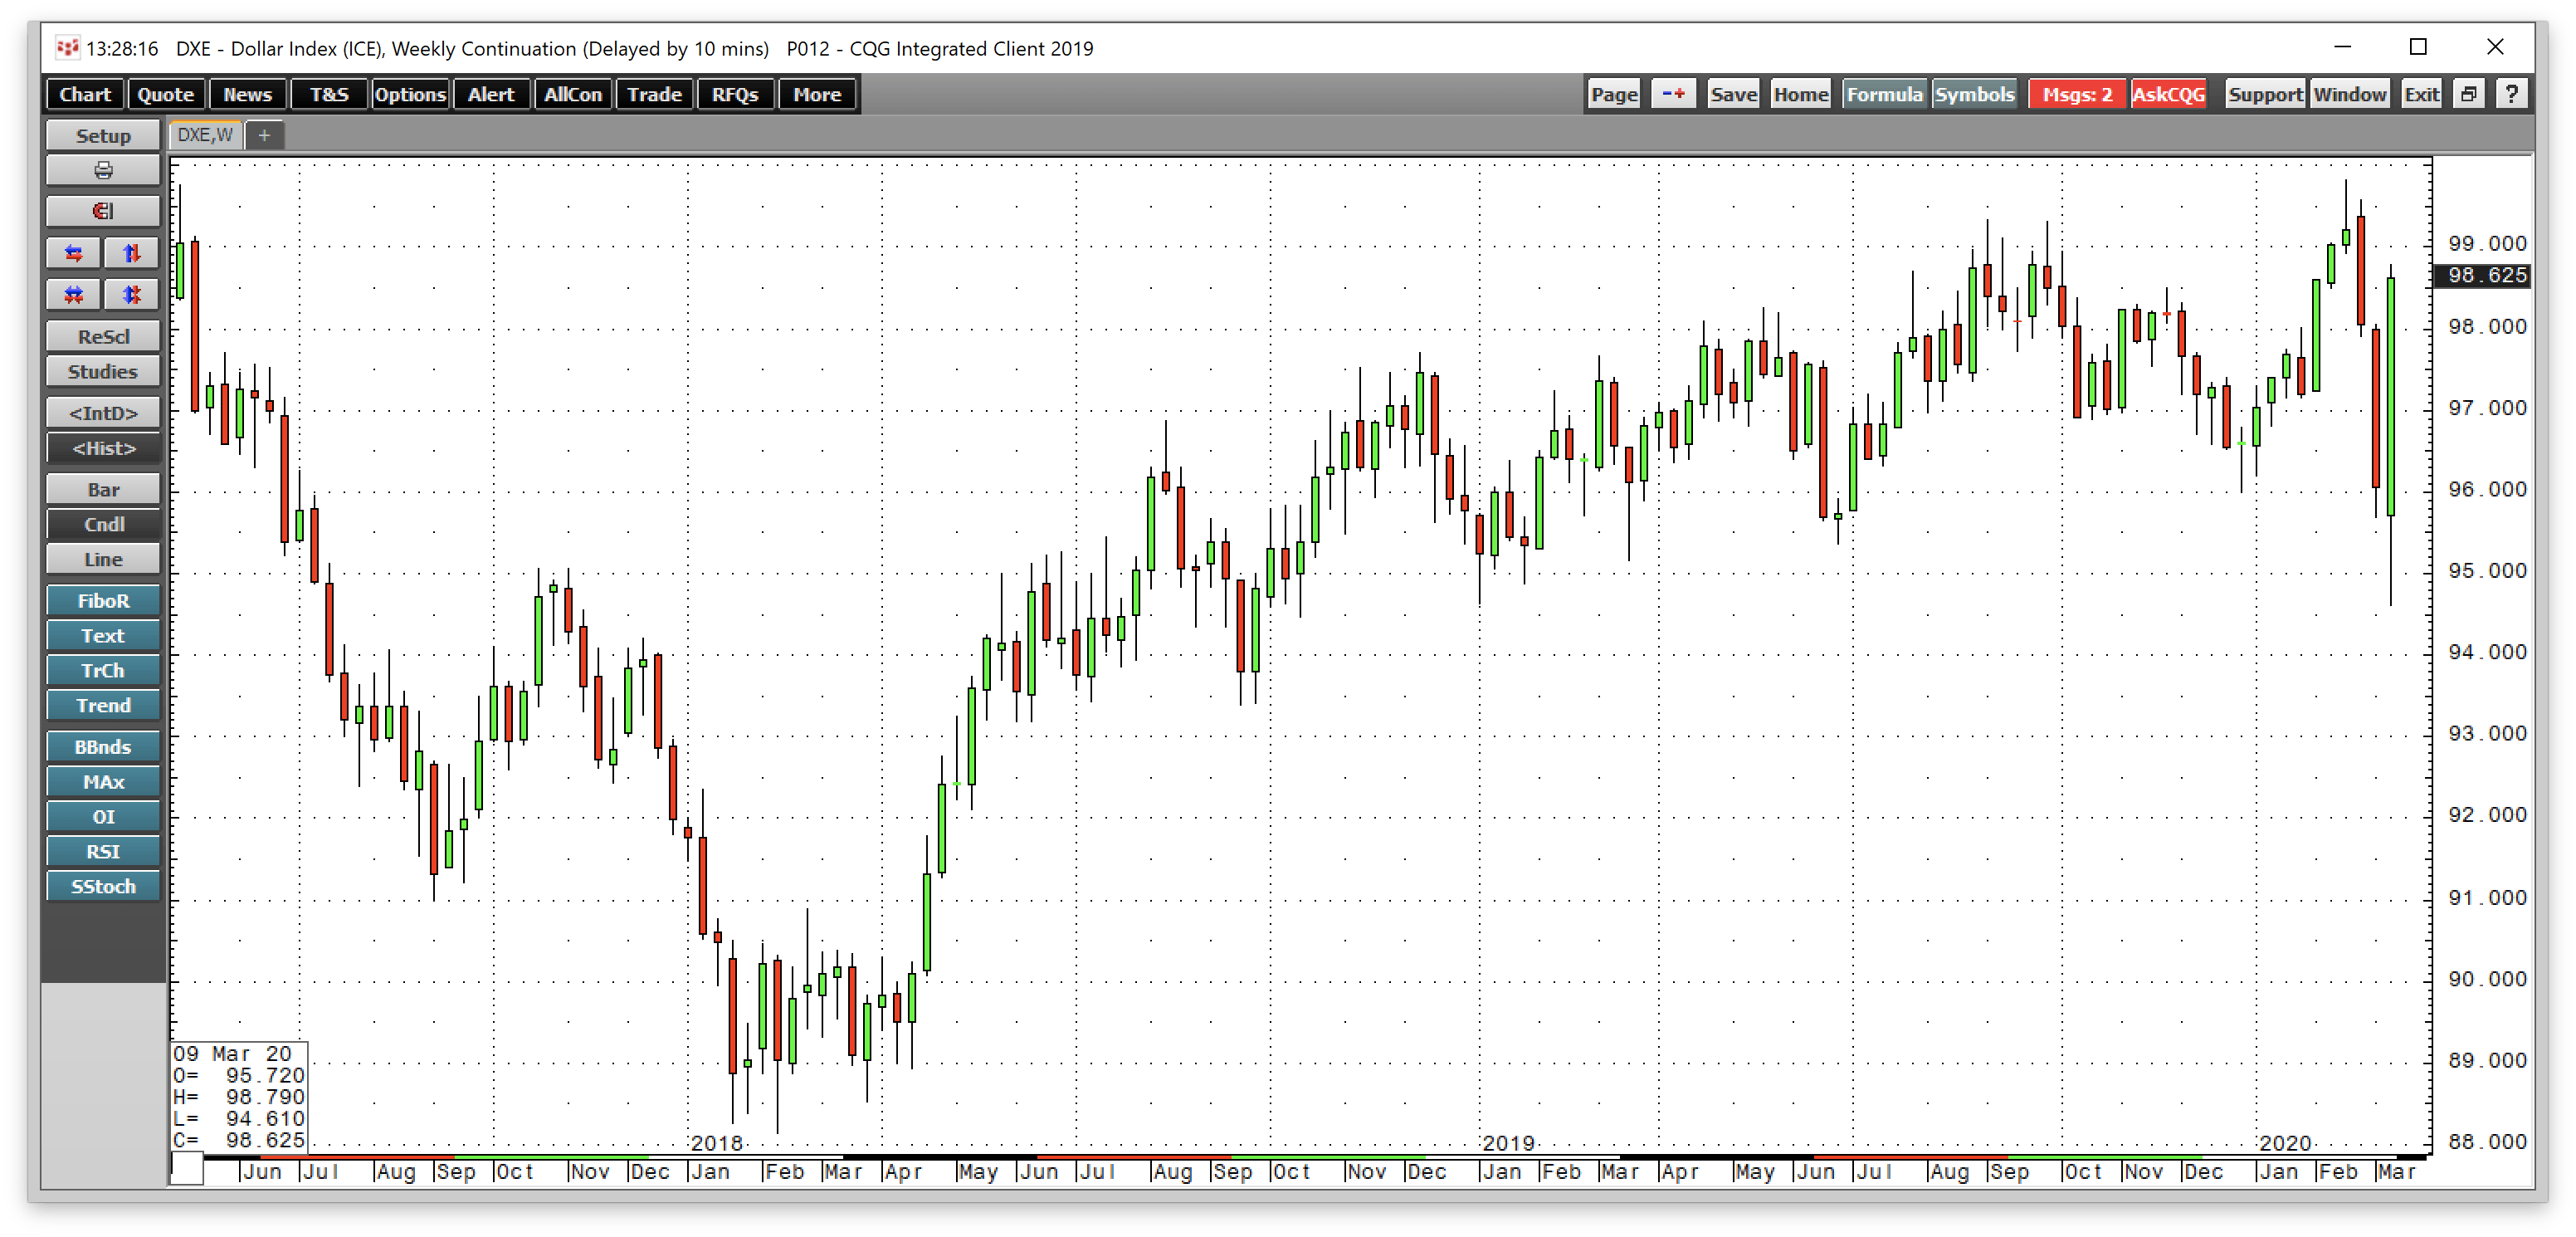
Source: CQG
The weekly chart highlights the ascent of the dollar index, which made higher lows and higher highs from early 2018 through February 2020. The two-year rally took the index to a peak of 99.815 on February 20. Each new high in the index led to a correction, but for two years, the dollar index always came back and rose to a higher high. The most recent new peak took the index to just shy of the 100 level, where it again corrected lower. The weekly chart shows that the latest correction tried to do damage to the bullish technical trend in the index. However, the dollar came steaming back. The Fed added a bazooka full of liquidity to markets during the price carnage last week. However, ECB President Lagarde’s approach to the crisis was met with criticism and selling in the euro, which pushed the dollar index higher after reaching the lowest level since October 2018 during the week.
Risk-off – this time is different
A potent bearish cocktail of the spread of Coronavirus and carnage in the crude oil market created the worst risk-off conditions since the 2008 financial crisis in markets across all asset classes starting during the final week of February. On February 24, reports that the virus was spreading beyond Chinese borders caused panic selling in Markets. On March 3, the US Federal Reserve reduced the short-term Fed Fund rate in the first emergency move since the wake of the 2008 debacle. The Fed addressed the rising potential for a global recession on the back of a worldwide health crisis.
Meanwhile, OPEC had cut production at its late 2019 meeting as concerns over the trade war between the US and China weighed on demand for the energy commodity. The cartel and Russia agreed to meet in early March to review the impact of the output reduction. The January 15 “phase one” agreement on trade between the US and China de-escalated the trade war, but the outbreak of Coronavirus replaced trade as the next factor weighing on China and economic conditions in the rest of the world. The Saudis advocated for a further 1.5 million barrel per day output decline, but Russia balked. In the aftermath of the meeting, the Saudis decided to abandon its production cuts and flood the world with crude oil.
Nearby NMYEX crude oil futures fell to a low of $41.05 per barrel on Friday, March 6, in the wake of the disagreement between Russia and Saudi Arabia. On Sunday night, March 8, the price action in the crude oil market was nothing short of carnage.
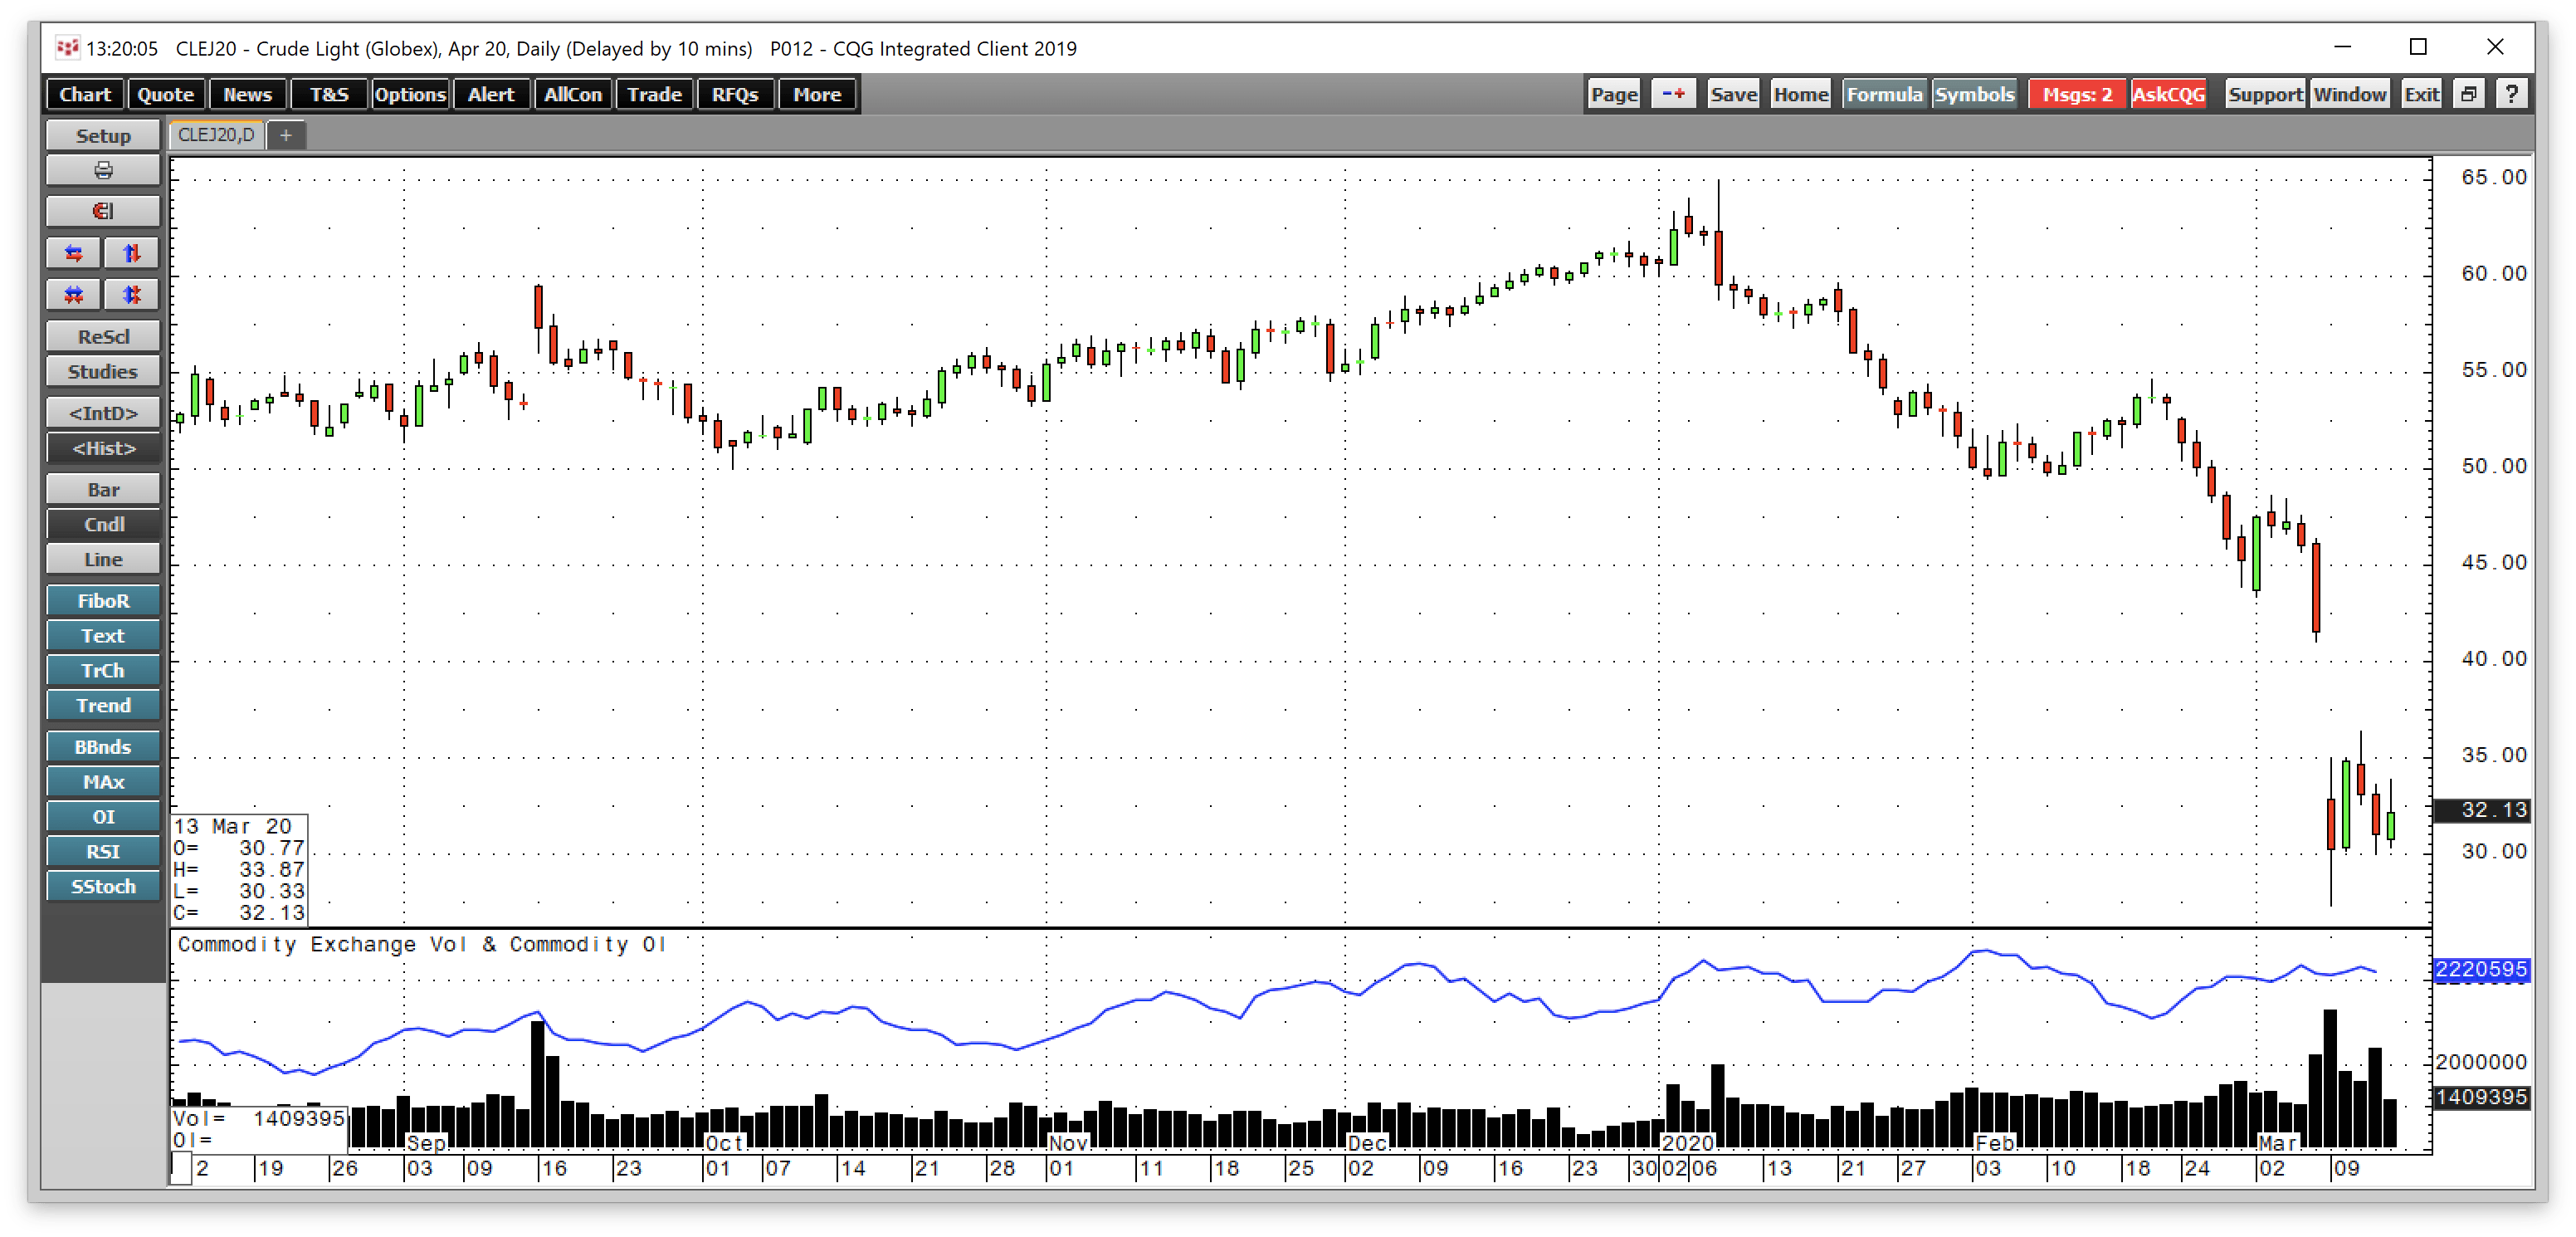
Source: CQG
As the daily chart of April NYMEX crude oil futures shows, the price dropped to a low of $27.34 per barrel on Sunday night, March 8, the lowest level since February 2016. Four years ago, the price found a bottom at $26.05, only $1.29 below the low Sunday evening. On Friday, March 13, the price of April futures was trading at just over $32 per barrel. Crude oil left a massive gap on the daily and weekly charts. The volume on March 9 was at a record level. Shares of oil companies, which had lagged the price of the energy commodity throughout 2019 and 2020, tanked as fears of bankruptcies rose as the price of petroleum fell.
When it comes to the dollar and all markets, risk-off conditions on the back of Coronavirus, and the carnage in the international oil market lifted fear and uncertainty to the highest level in over a decade.
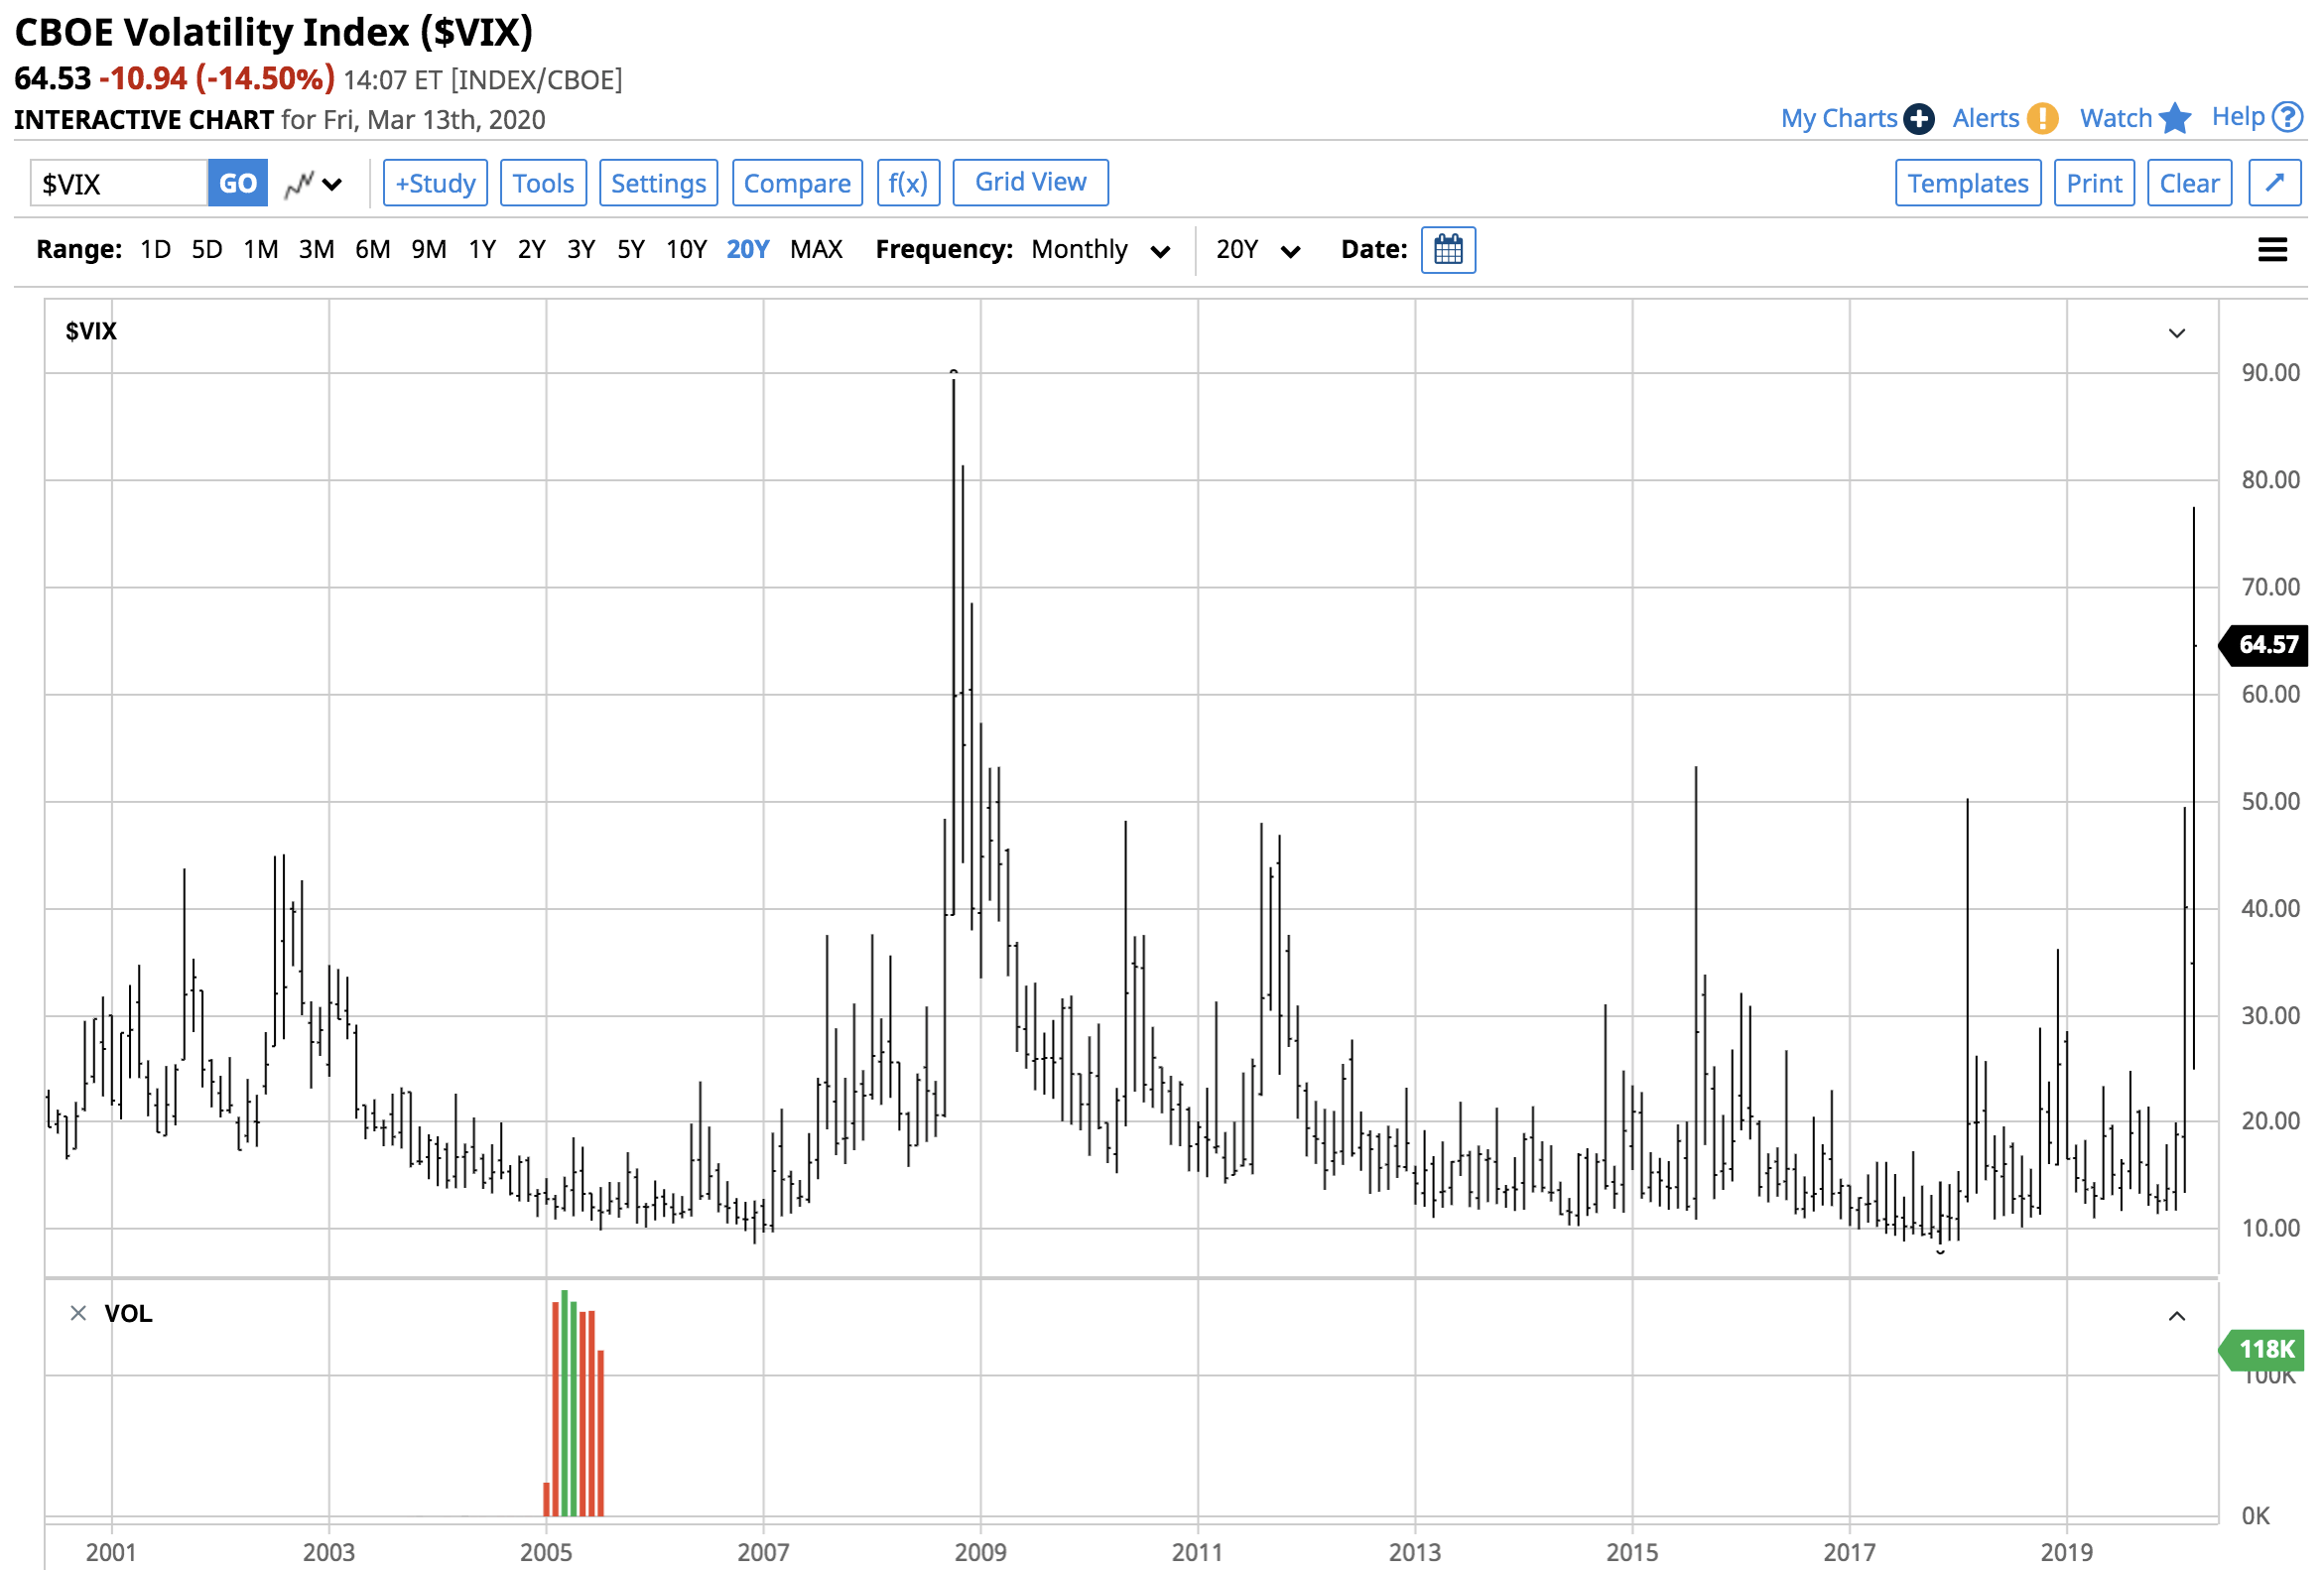
Source: Barchart
The VIX index, which is an indicator of fear and uncertainty in markets, rose to a high of 77.57 on March 13 as the stock market fell precipitously with all of the indices plunging throughout the week. The VIX traded to its higher level since November 2008.
When it comes to the dollar index, this risk-off period is a lot different than in the past. The medical emergency around the globe triggered selling in markets, and the almost unprecedented plunge in crude oil caused by Russia intransigence and the flood of oil from Saudi Arabia means that many traders and investors are moving to the sidelines and exiting risk positions.
Cash and carry economics between the dollar and the euro deteriorate
Until last July, when the US Fed first began reducing short-term interest rates, the rate differential between the US dollar and euro currency stood at 2.65%-2.90%. After 75 basis points of rate reductions in the US in 2019 and a ten-point decline in euro rates, the differential narrowed to 2.00%-2.50%. While holding dollars produced a yield, a long position in the euro involved a cost in the environment of negative short-term rates.
The structure of the currency and interest rate markets caused many market participants to enter cash and carry trades where they were long dollars and short euros to take advantage of the positive yield. Moreover, the buying in the dollars pushed the greenback higher, and selling in euros weighed on the currency pair. The cash and carry trade not only benefited from interest rates but the bullish price action in the dollar and bearish action in the euro. Over time, the position in the currencies rose.
On March 3, the US Fed cut rates by 50 basis points, reducing the yield on the cash and carry to 1.50% to 2.00%. Even though holding euros still involved a cost, risk-off conditions caused market participants to begin unwinding the trade. The rally in the US Bond market accelerated the unwind at the start of last week.
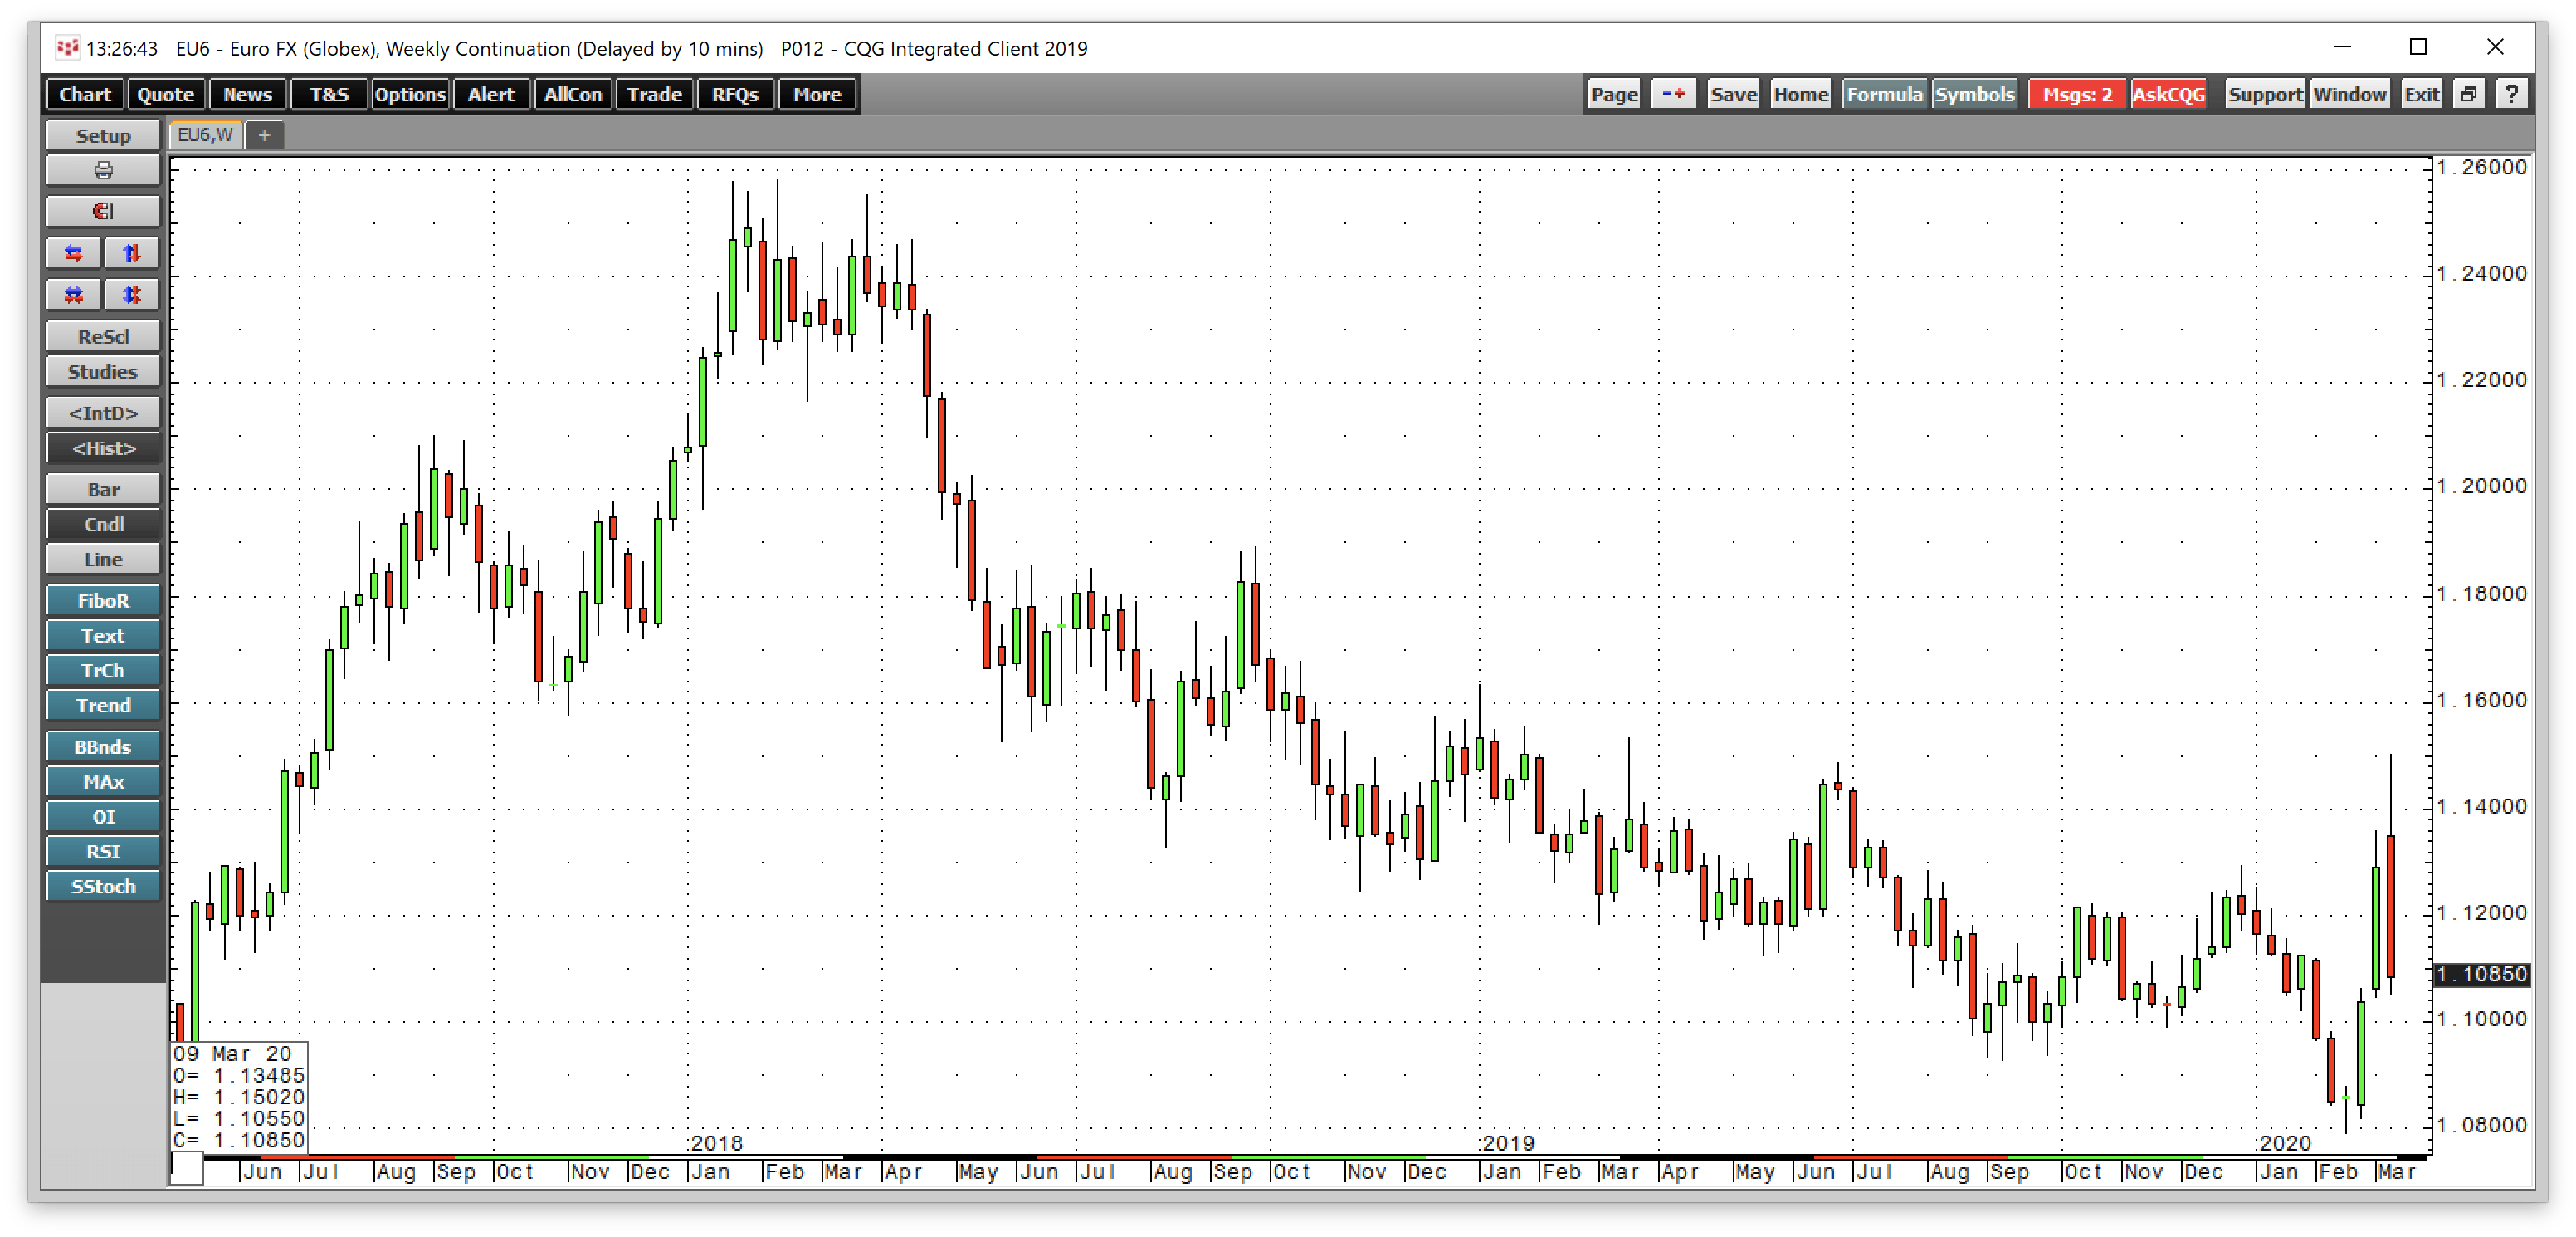
Source: CQG
As the weekly chart of the euro versus the dollar currency pair shows, the European currency moved from $1.0793 in mid-February to a high of $1.15020 on March 9 or 6.57%, a massive move in the currency arena. The euro then turned lower after the market was disappointed with the ECB, and the US imposed travel restrictions during the week.
Source: CQG
Over the same period, the dollar index declined from 99.815 to a low of 94.61 or 5.2%. As risk-off gripped markets, the yield differential had become secondary as the strength of the euro versus the dollar. The dollar came storming back as the euro slipped after the ECB meeting, but a continuation of volatility could cause the liquidation of the cash and carry trade to return, which would weigh on the dollar index.
UDN moved higher when the dollar index falls
The most direct route for a risk position in the dollar index is via the futures and futures options that trade on the Intercontinental Exchange. The Invesco DB US Dollar Index Bearish Fund moves to the upside as the dollar index falls. The fund summary for UDN states:
The investment seeks to track the changes, whether positive or negative, in the level of the Deutsche Bank Short US Dollar Index Futures Index. The index reflects the changes in market value over time, whether positive or negative, of a short position in the DX Contract which expires during the months of March, June, September and December. The fund seeks to track the index by establishing short positions in DX Contracts. DX Contracts are linked to the six underlying currencies, or the index currencies, of the U.S. Dollar Index (USDX®), or the USDX®. The index currencies are Euro, Japanese Yen, British Pound, Canadian Dollar, Swedish Krona and Swiss Franc.
Source: Yahoo Finance
UDN has net assets of $36.19 million, trades an average of 63,127 shares each day, and charges a 0.75% expense ratio. Between February 20 and March 9, the dollar index fell 5.2%.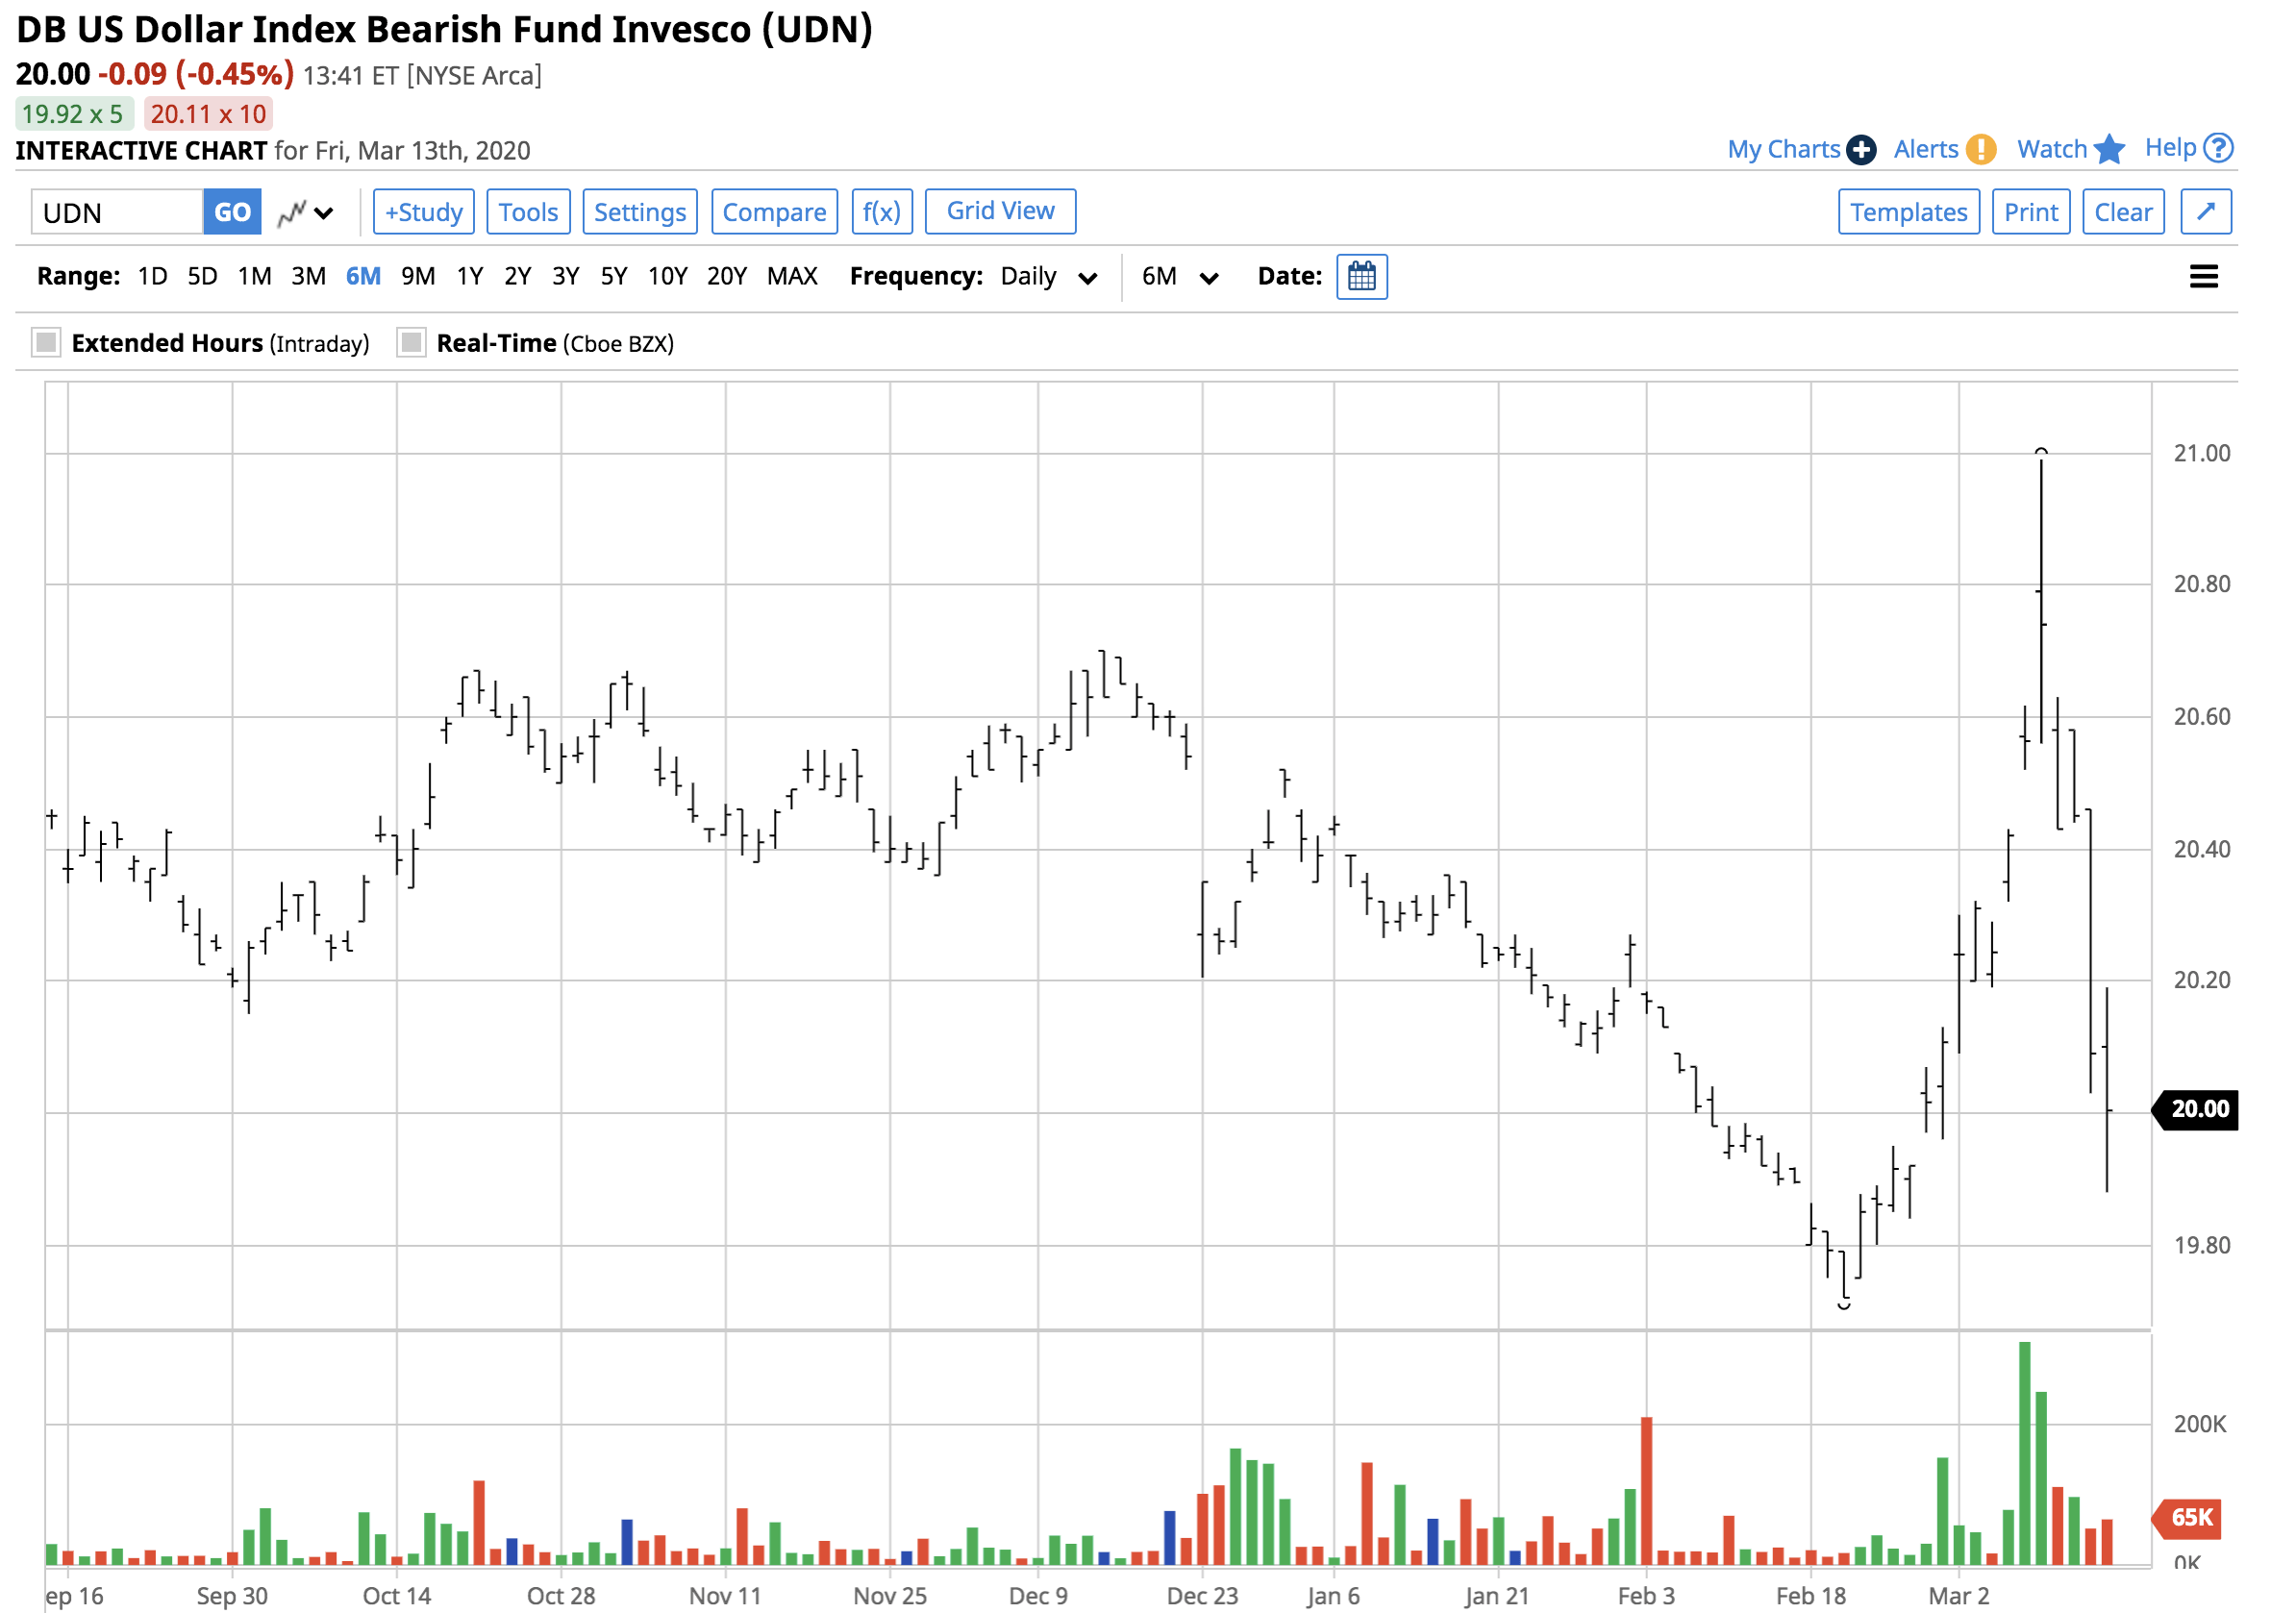
Source: Barchart
Over the same period, UDN rose from $19.72 to $20.99 per share or 6.44%. Risk-off conditions mean that market participants move to the sidelines to protect capital. As the dollar bounces, the inverse UUP product appreciated.
The current level of wild volatility in all markets is likely to continue to impact the foreign exchange arena. A return of the unwind of the cash and carry trade between the euro, and the dollar would push the dollar index lower. Expect lots of volatility over the coming days and weeks in the currency markets.
The Hecht Commodity Report is one of the most comprehensive commodities reports available today from the #2 ranked author in both commodities and precious metals. My weekly report covers the market movements of 20 different commodities and provides bullish, bearish and neutral calls; directional trading recommendations, and actionable ideas for traders. I just reworked the report to make it very actionable!
Disclosure: I/we have no positions in any stocks mentioned, and no plans to initiate any positions within the next 72 hours. I wrote this article myself, and it expresses my own opinions. I am not receiving compensation for it (other than from Seeking Alpha). I have no business relationship with any company whose stock is mentioned in this article.
Additional disclosure: The author always has positions in commodities markets in futures, options, ETF/ETN products, and commodity equities. These long and short positions tend to change on an intraday basis.
Be the first to comment