

monozero/iStock via Getty Images
Background
We’ve recently covered Marathon Digital Holdings (MARA), one of the largest enterprise Bitcoin (BTC-USD) self-mining companies in North America. With many public-traded Bitcoin mining companies to choose from, we found that MARA isn’t a good miner to invest in for the following reasons:
- MARA’s outsized compensation to its management such that it can exceed its total revenue in FY2021 or can contribute to more than 90% of MARA’s expenses (Table 2) should deter prospective investors.
- MARA is highly leveraged.
- Almost all of MARA’s liability came from MARA’s $745mil convertible note offerings in 2021Q4.
- MARA’s total liability ($749.2mil) is now more than MARA’s market cap ($730mil).
- MARA’s total liquidity (cash + BTC reserves) is less than 50% of its total liability and could be depleted by end of 2023 if Bitcoin does not rebound.
We’ve also updated our thesis. Back in May 2021, more than a year ago, we stated that Bitcoin has officially entered its bear market when Bitcoin is near its all-time high and reiterated with fundamental support several months later. We specifically drew references from Bitcoin’s bear markets (2014 and 2018) in the previous 2 cycles and predicted 5 sequences of events that have to occur before Bitcoin bottoming out. Bitcoin has since completed 4 out of the 5 sequences of events:
- Reversal pattern -> Double Top [Checked @ Nov 2021]
- 50% decline from peak -> Reach $34k [Checked @ Jan 2022]
- Rebound back to 20% from peak -> Reach $54k (Missed by 10%) [Checked @ September 2021]
- Another decline to 70% from peak -> Reach $21k [Checked @ June 2022]
- Bottom out at 85% from peak -> Reach $10.5k
We asked a very significant question: Has Bitcoin bottomed out at $20,000? According to Bitcoin’s previous 2 halving cycles, Bitcoin has never dropped below its previous peaks during the bear market as if it became a “hard rule”. The problem is that Bitcoin’s previous peak was $20,000 and Bitcoin has to break that rule to complete its 5th sequence of events. Therefore, it is either Bitcoin has bottomed out from here or it is going to $10,500 to complete its bear market sequences. In summary, we find that completing its 5th sequence of events is more probable than bottoming out from here. We suggest giving it a read for more details.
Aside from discussing where will Bitcoin bottom out, we also cautioned investors against investing in Bitcoin mining companies if Bitcoin were to continue its bear market cycle. Here are the reasons:
- Bitcoin mining companies in general are more volatile than Bitcoin. Riot Blockchains (NASDAQ:RIOT) is 60% more volatile than Bitcoin while MARA is 40% more volatile than Bitcoin. Fig 1 depicts the scenario we wanted investors to avoid.
- Bitcoin mining companies have a total mining cost of more than $30,000 per BTC on average. Should Bitcoin trade below the total mining cost per BTC, the Bitcoin mining business will no longer remain viable.
Therefore, this article aims to pit RIOT against MARA and also determine how RIOT will perform in this current crypto season.
Fig 1. Bitcoin Mining Companies Underperformed Bitcoin in the Bitcoin Bear Market (YCharts)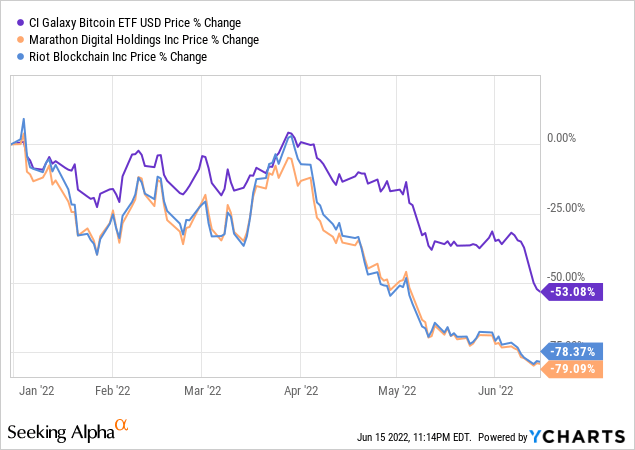
RIOT vs MARA
Compensation Expense: 24% vs 85% of Revenue
It is safe to say that RIOT is generous in its management stock compensation. Over the last 5 quarters since 2021Q1, RIOT has awarded its management team approximately $70mil worth of stock compensation (Table 1). This represents 24% of total revenue in 5 quarters since 2021Q1.
RIOT’s compensation plan may be too generous for some investors’ liking, but MARA’s management stock compensation is much more generous compared to RIOT’s relative to revenue and expenses. MARA paid $173miil in compensation since 2021Q1 which represents 85% of all total revenue ($202mil) over the period. It can be interpreted as almost all generated revenue being used to reward its management. The effort required to run MARA that justifies such a reward remains unclear.
Therefore, RIOT is more desirable in this department.
Table 1. RIOT’s Management Stock Compensation Since 2021.
|
QR |
Mgnt Comp ($mil) |
Total Self Mining Cost ($mil) |
Proportion (%) |
|
3 |
43.25 |
7% |
|
|
30.5 |
60.17 |
50% |
|
|
36 |
65.2 |
55% |
|
|
1 |
18.54 |
5.4% |
|
|
1 |
15.85 |
6.3% |
Table 2. MARA’s Management Stock Compensation Since 2021
|
QR |
Mgnt Comp ($mil) |
Total Mining Cost ($mil) |
Proportion (%) |
|
$10.34 |
$40 |
26% |
|
|
$10.61 |
$28.57 |
37% |
|
|
$97.2 |
$109.263 |
89% |
|
|
$4 |
$13.545 |
30% |
|
|
$54.4 |
$57.544 |
95% |
Fig 2. MARA’s 2021Q3 Stock Compensation (Form 10-Q)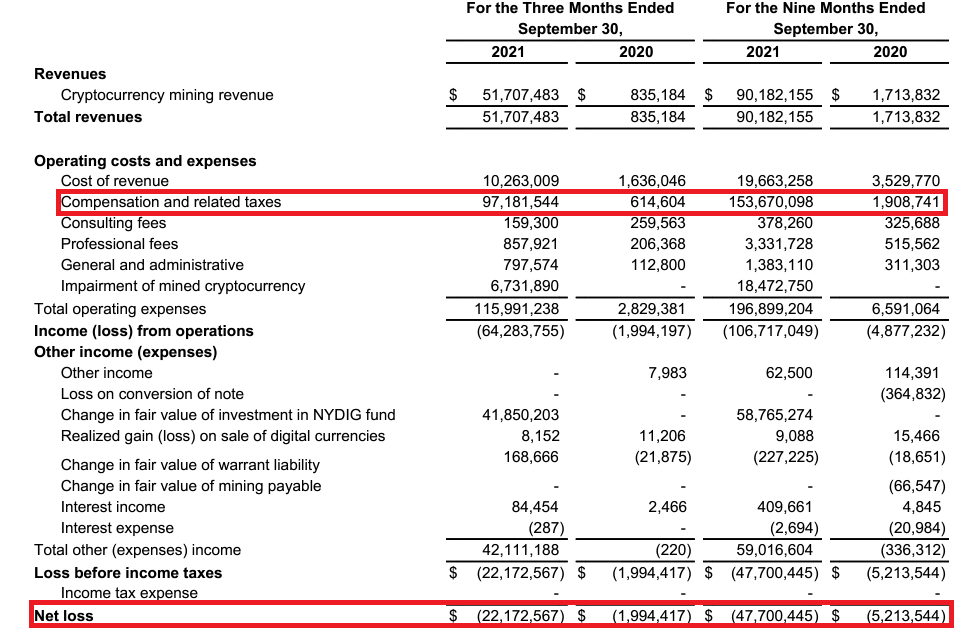
Leverage: Highly Leveraged vs (almost) No Debt
Back in 2021Q1, RIOT proudly announced that it has no debt.
Completed the first quarter of 2021 with record current assets and zero debt.
Fortunately, still not much has changed today. The amount of liability RIOT has is negligible. According to the 2022Q1 quarterly report, RIOT only has $0.162bn worth of liability compared to total liquidity of $0.253bn ($0.114bn in cash + $0.139bn in BTC @ $22,000 per BTC) or total asset of $1.55bn. This means that RIOT’s total liability is only 10% of total assets and 64% of total liquidity.
On the other hand, MARA has $1.54bn in total assets and $336.7 in liquid assets (cash + Bitcoin reserves). MARA’s total liability stands at $749.2mil. This implies MARA’s total liability is 50% and 222% of total assets and liquid assets respectively.
Therefore, RIOT is significantly less leveraged.
Based on the 2022Q1 operating cash flow (Fig 3), RIOT can survive 5 quarters on its liquid assets (cash and BTC reserves) compared to MARA’s 13 quarters. But there’s more to this.
During 2022Q1, Bitcoin was trading comfortably above $30,000, ranging from $33,000 to $48,000. MARA’s total mining cost per BTC is $31,700 while RIOT’s self-mining cost per BTC is $30,800 (excluding impairments, changes in fair value, and realized gains) during the period. Hence, it is still profitable for both RIOT and MARA to mine Bitcoin. At the current Bitcoin price of $22,000, MARA and RIOT are mining Bitcoin at a loss of $9,700 and $8,800 respectively. This would’ve translated to an additional negative operating cash flow of $12mil for both MARA (1,259 BTC mined * $9,700 loss per BTC) and RIOT (1,405 BTC mined * $8,800 loss per BTC. This implies that MARA’s and RIOT’s operating cash flow would become -$38mil and -$57mil respectively, reducing their runway to 8.8 quarters and 4.4 quarters.
In our worst-case scenario, if Bitcoin were to complete its bear market by reaching $10,500 per BTC, MARA and RIOT are expected to incur an additional – $26.7mil and – $28.5mil operating cash flow respectively which further reduces their runway to 6 quarters and 3.42 quarters respectively. Note that this is only operating cash flow and investment cash flow is assumed to be 0 as a drastic countermeasure to survive.
Does this mean MARA is better than RIOT? Not necessarily.
Recall that MARA is already highly leveraged where total liability accounted for 50% of total assets. Should RIOT also incur the same amount of debt as MARA ($749.2mil), RIOT can extend its runway from 3.42 quarters to 13 quarters compared to MARA’s 6 quarters of runway.
Fig 3. Operating Cash Flow of RIOT and MARA (YCharts)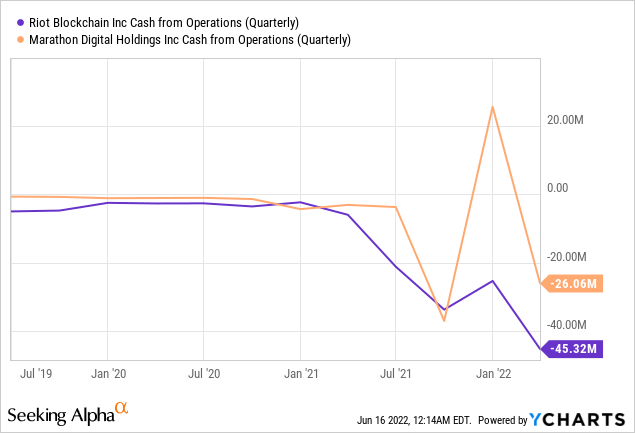
Valuation: Should MARA be valued 2x more than RIOT?
The total mining costs of MARA ($31,700) and RIOT ($30,800) are similar. Hence, the other metric affecting their profitability is the mining capacity. RIOT’s 2022Q1 mining capacity is 4.3 EH/s and is expected to reach 12.8 EH/s by 2023Q1. On the other hand, MARA’s 2022Q1 mining capacity is 3.9 EH/s and is expected to reach 23.3 EH/s by end of 2023.
Based on built-up capacity, RIOT and MARA should be valued similarly. Based on expected capacity, MARA should be valued 2x higher than RIOT. Since MARA has 2x more expected capacity by the end of 2023, does this mean that MARA should be valued 2x more than RIOT? The answer is no.
MARA’s QoQ capacity growth rate is declining while RIOT’s is consistently near 10%. Table 3 and Table 4 represent MARA’s and RIOT’s built-up capacity vs the announced expected capacity by quarter. In 2021Q1, MARA announced that it is expected to achieve the targeted 10.37 EH/s capacity. However, as of 2022Q1, MARA only managed to achieve about 40% of that target. Therefore, given global supply chain shortages and MARA’s decreasing QoQ built-up growth rate, MARA is only expected to achieve a mining capacity of 6.9 EH/s at an 8.5% QoQ growth rate. MARA can only achieve its targeted 23.3 EH/s only if it grows at its historical 29% QoQ rate, which is unlikely. This growth rate is also similar to RIOT’s historical average growth rate.
Hence, it is expected that both RIOT and MARA are currently priced (Fig 4) similarly with a slight edge to MARA just due to its 2x higher expected mining capacity (though not probable in achieving it).
Table 3. MARA’s Built-up vs Expected Capacity
|
QR |
Built-up hash rate |
Built-up QoQ Growth Rate |
Expected hash rate |
|
3.9 EH/s |
8.5% |
||
|
3.5 EH/s |
29% |
23.3 EH/s (early 2023) |
|
|
2.7 EH/s |
29% |
13.3 EH/s (N/a) |
|
|
2.09 EH/s |
43% |
13.3 EH/s (N/a) |
Table 4. RIOT’s Built-up vs Expected Capacity
|
QR |
Built-up hash rate |
Built-up QoQ Growth Rate |
Expected hash rate (EH/s) |
|
4.3 |
38.7% |
12.8 (2023Q1) |
|
|
3.1 |
11% |
12.8 (2023Q1) |
|
|
2.8 |
8% |
8.6 (2022Q4) |
|
|
2.6 |
13% |
7.7 (2022Q4) |
|
|
2.3 |
7.7 (2022Q4) |
Fig 4. Market Cap of RIOT and MARA (YCharts)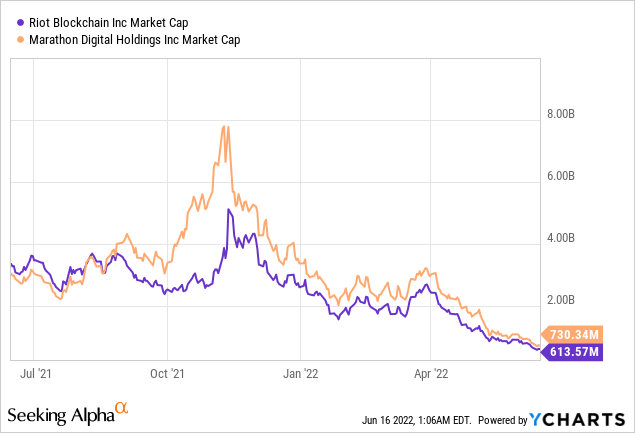
Verdict
After pitting RIOT against MARA, we find that the higher expected mining capacity has helped price MARA slightly higher than RIOT. However, in this Bitcoin bear market which is expected to get worse, we prefer several advantages held by RIOT:
- Almost no debt. Debt is lesser than total liquidity and is only 10% of total assets.
- RIOT has a lower total mining cost per BTC than MARA.
- RIOT has 3+10 quarters of runway compared to MARA’s 6 quarters.
- Despite MARA’s higher expected mining capacity, in reality, we expect both to increase capacity at a similar rate. Hence, RIOT is 20% more undervalued than MARA in this sense.
Therefore, we would pick RIOT over MARA.
That being said, we discourage investors to invest in Bitcoin mining companies during a bear market due to higher volatility than Bitcoin and the additional risk of insolvency. Since Bitcoin mining companies’ performance tracks Bitcoin’s price, we expect further turbulence in this sector. As for layout in our recent coverage on Bitcoin, it is more probable for Bitcoin to reach $10,500 than to bottom out from here.
In an interview, Kevin O’Leary revealed that he has invested in hydropower facilities to mine Bitcoin. Kevin O’Leary claimed that it is not a feasible business to mine Bitcoin below $30,000. Our cost analysis of MARA and RIOT validated his claim.
Be the first to comment