

Pascal Le Segretain/Getty Images Entertainment
Much like other luxury stocks, Compagnie Financière Richemont (OTCPK:CFRUY) has also sunk more than both the S&P 500 (SP500) and STOXX Europe 600 index (STOXX) this year. The fact that the indices themselves have seen pretty bad falls of 25% and 20% respectively, puts this trend in perspective. Worse could be in store, as there’s increasing speculation of an impending global recession. But Richemont has an additional challenge. Its long-term price performance is nowhere close to its peers. This article first looks at its performance in detail, it then analyses the company’s fundamentals to see where the problem lies. It concludes that there could be some upside, but there are risks too.
Lagging price performance
To get a better understanding of its price performance, it was compared with four other luxury stocks – LVMH (OTCPK:LVMUY), Hermes (OTCPK:HESAY), Kering (OTCPK:PPRUY), all of which I have covered in recent articles, as well as another Swiss company and Longines, watches owner Swatch (OTCPK:SWGAY). The performance of the S&P 500 and the European equities index STOXX Europe 600 have been added to the mix for reference.
Richemont, of Cartier jewellery and Omega watches, has a relatively underwhelming performance across the five time periods under consideration (see table below). It’s not the worst performing, but it’s far from being the best performing either. To be fair, both year-to-date (YTD) and the past year’s performances have been a complete washout across the stocks under consideration. LVMH is best-off YTD, but with a decline of 27.2%, that’s not saying much. Over the past year too, it’s a similar story, with Hermes showing the lowest drop of 17.7%. Seen in this context, Richemont’s performance isn’t all too bad over the past year and is actually quite healthy over the past three years.
Source: Seeking Alpha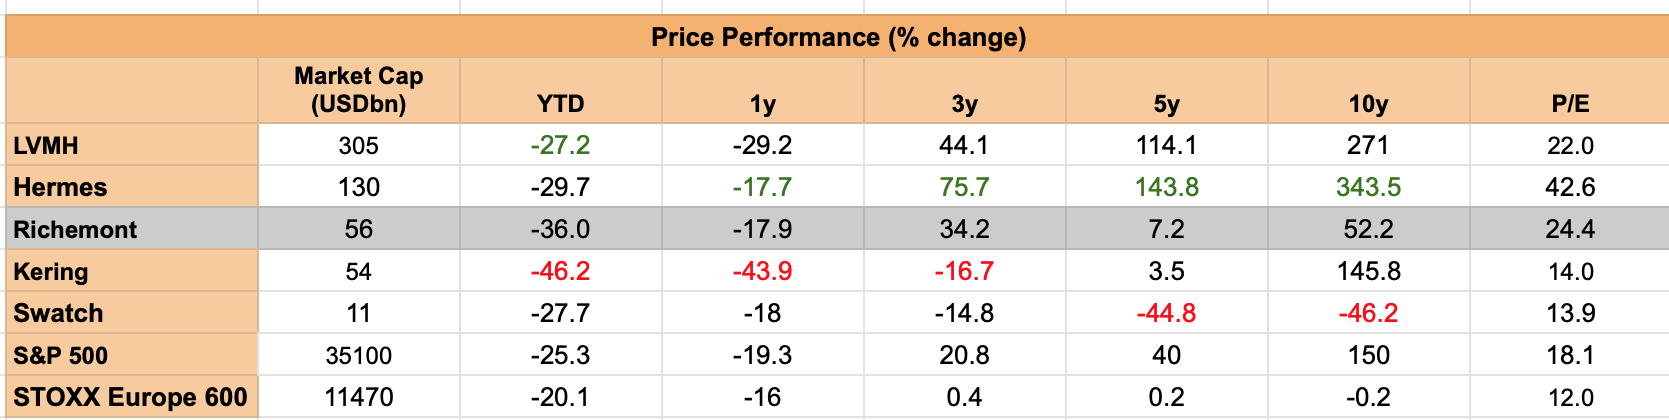
However, if we go back further, over the past five and 10 years, returns from investing in CFRUY are far smaller than those from LVMH and Hermes. Even S&P 500 has delivered more over the period. That’s a red flag, right there.
Comparing key financials with peers
To assess what might be holding Richemont back, the next step was to compare its key financials with peers. Turns out, that for the last financial year, it saw the sharpest revenue growth of 37.7% among the companies considered in USD terms. Its net profit growth at 50.4% was only the third best, but by itself, it’s still a strong number.
The stock’s big downside is its operating margin of 17.9%, which is better only than Swatch at 14%. On its own, it’s not too bad, but it definitely lower than the average of 25.4% for the luxury stocks in focus. Since inflation is high, margins could come under greater pressure, which makes this number of particular significance right now. This is one reason why I felt less than confident buying Kering, especially since its current growth is being supported by low-margin segments.
Sources: Seeking Alpha, Author’s Estimates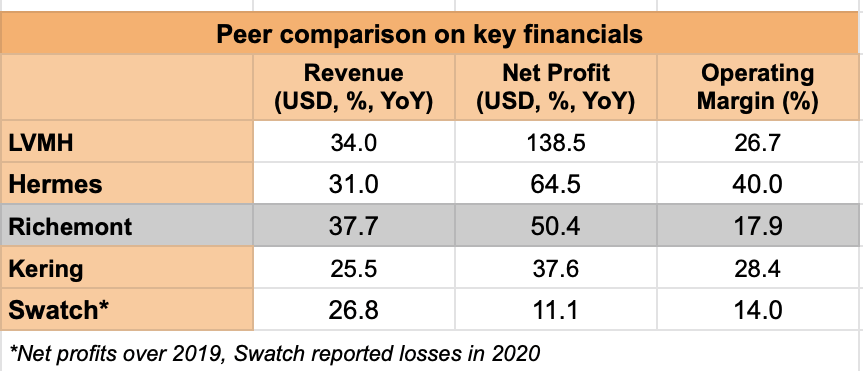
Margins can improve
However, the case of Richemont is different. Its biggest segment, with a 58% share in revenue, is Jewellery Maisons, which comprises of brands like Buccellati, Cartier and Van Clef & Arpels. This category saw a robust 49% revenue increase and had an operating margin of 34.3% in the last financial year. Its second biggest segment of Specialist Watchmakers, with an 18% share also showed strong revenue growth, though its margins are lower at 17.3%. However, if only these two segments were considered, CFRUY’s operating margin is still over 30%.
The real drag comes from its remaining two segments. Its third largest segment is Online Distributors, with a 14% share comprises of Watchfinder and Yoox Net-a-Porter (YNAP). It reported operating losses. A smaller loss came from its final and smallest segment, Others, which includes its fashion and accessories businesses, its watch component manufacturing and real estate activities.
Source: Richemont, Annual Results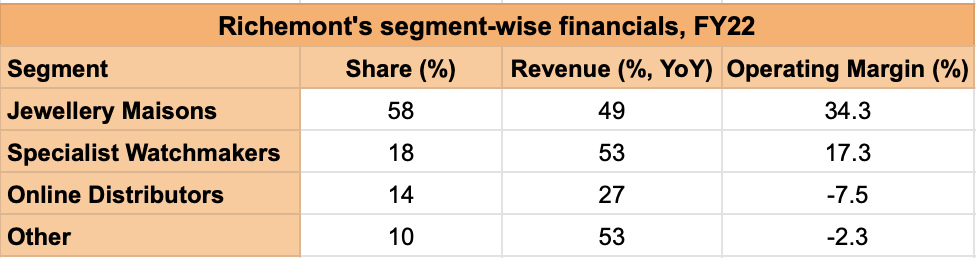
However, some of this drag will be eliminated now that YNAP has now been sold to the London-based online luxury fashion company Farfetch (FTCH), which will boost margins. For lack of financial details on YNAP alone, I calculated operating margins after deducting the impact of Online Distributors on both its profits and revenue. This alone brings its margins up to almost 22%, closer to the likes of LVMH. Moreover, its growth would also improve since at a 27% revenue increase, Online Distributors lags behind Richemont’s biggest segments. The same calculation reveals that its sales growth without the segment would have been almost 50% in home currency terms compared to the reported 46% figure.
Consider the risks
The deal, however, is likely to complete only by the end of 2023, which is still over a year away. Already, the company’s revenue growth for the first quarter of its current financial year has been impacted by lockdowns in China. It saw an 8% YoY decline in sales from the Asia-Pacific market at market exchange rates. On the face of it, this looks like a worse performance than that for other companies. But here’s the difference.
Peers have reported performance for the first half of 2022, which includes the better-placed first three months of the year. Digging deeper, however, reveals that CFRUY isn’t particularly worse off than the others. For instance, Kering saw a 15% decline in Asia-Pacific sales in Q2 2022 from its retail channel, which is quite indicative since the retail segment accounts for 77% of its total sales. LVMH too saw an 8% decline in Asia ex-Japan growth in the same quarter. With a growth pickup expected from China in 2023, the market could perform better for Richemont and possibly contain the expected weakening in the US and Europe as well. I’m not holding my breath though, not with risks from COVID-19 still persisting in the winter months, which could depress demand from China again.
Wait for later
Additionally, its price-to-earnings (P/E) ratio is at 24x, which is around the average of stocks considered earlier, indicating that Richemont is fairly valued. Going by the current state of equity markets, it’s possible that it could become more attractive at lower prices, but then its financial performance could also be impacted by lower economic growth. With the real impact of the YNAP sell-off likely to be evident only next year, the margin boost would also show up in numbers only later. Also, its long-term price performance doesn’t encourage confidence either, especially with better-performing peers around. Richemont’s ADRs could look more attractive at a later date.
Be the first to comment