

Amax Photo/E+ via Getty Images
Investors who are searching for a portfolio of better-priced defensive equities have reasons to turn to smart beta funds like the Invesco S&P 500 Equal Weight Consumer Staples ETF (NYSEARCA:RHS), an ETF providing exposure to the equally weighted portfolio of the bellwether U.S. consumer staples stocks.
As I explained in the recent article on the First Trust Nasdaq Food & Beverage ETF (FTXG), defensive investing requires a certain level of tolerance to premium multiples. Put another way, recession-proof names benefitting from inelastic demand are rarely attractively priced, and it is especially preposterous to anticipate them to carry a solid discount in the current environment after a strong YTD run bolstered by inflation issues and higher interest rates.
In theory, there are ways that make this issue a bit less acute, for instance, by assigning equal weights to holdings. And this is essentially what RHS does. Yet, as uncovered upon deeper inspection, smart beta is not always supportive of better valuations. At times, it could oddly be quite the contrary.
Comparing RHS, IYK, and XLP
The ETF tracks the quarterly rebalanced S&P 500 Equal Weight Consumer Staples Index. In the current iteration, its portfolio includes 33 stocks, with the top ten accounting for just 32.3%. Its peer iShares U.S. Consumer Staples ETF (IYK), which tracks the Russell 1000 Consumer Staples RIC 22.5/45 Capped Index, has 52 holdings (including A and B class shares in Brown-Forman (BF.A) (BF.B)), with the principal ten accounting for 64.5%. Another investment vehicle of interest, the Consumer Staples Select Sector SPDR Fund (XLP), an ETF with the largest AUM among those funds targeting consumer defensive stocks, has a portfolio of 33 stocks and 69.4% on the net assets deployed to the key ten names; its investment strategy is based on the Consumer Staples Select Sector Index.
More specifically, while RHS’ top holding is Walgreens Boots Alliance (WBA), a $35.9 billion drug retail company, both IYK and XLP are concentrated in Procter & Gamble (PG), a $357 billion branded consumer packaged goods heavyweight, with 15.8% and 15% allocated, respectively.
So does RHS have an edge over IYK or XLP? It does, though a surprising one.
The table below provides a comprehensive look at the valuation, growth, and quality characteristics of this peer group.
Calculated by the author using data from Seeking Alpha, IYK, RHS, and XLP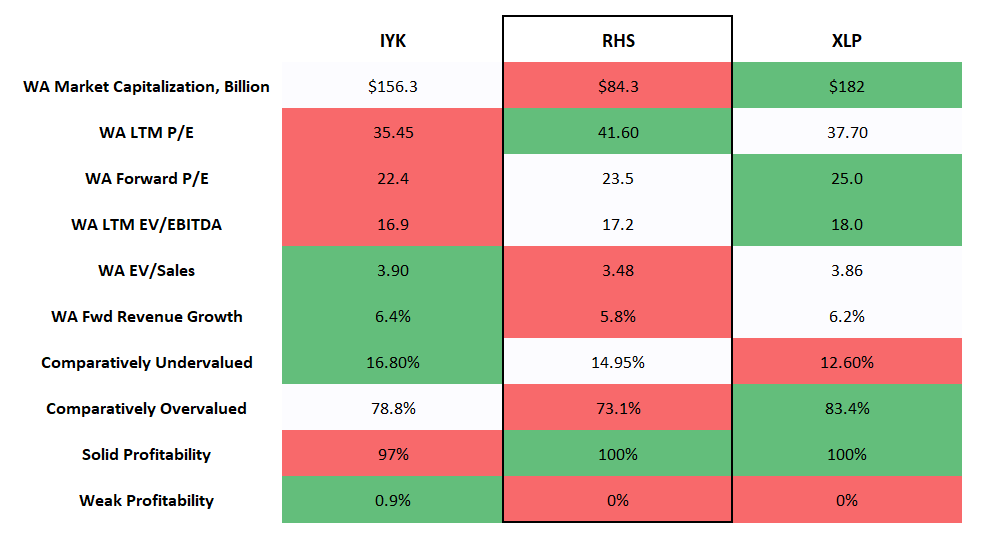
As my dear readers could see, RHS has the smallest weighted-average market capitalization in the group, of about $84.3 billion, little wonder for an equally weighted portfolio with just 18.3% allocated to mega-caps vs. 49.5% in the case of IYK, for example.
However, why RHS has the highest weighted-average LTM Price/Earnings? This is counter-intuitive, to say the least, essentially meaning that smart beta strategies are useless and powerless when it comes to creating cheaper equity mixes.
The explanation here is simple and tedious. Constellation Brands (STZ), a $48.2 billion distillers and vintners industry player with a gargantuan ~469x P/E, has a 3% weight in it juxtaposed with 1.9% in XLP and 2% in IYK. In contrast, companies with less volatile earnings and more realistic P/Es like PG mentioned above have a much larger share of the net assets.
For better context, the table below shows IYK’s top five holdings and their weights, sizes, and P/Es.
| Stock | Weight, % | Market Cap, $Billion | Enterprise Value, $Billion | P/E TTM | P/E FWD |
| Procter & Gamble (PG) | 15.8 | 353.67 | 381.06 | 26.1 | 25.9 |
| PepsiCo (PEP) | 11.4 | 259.13 | 291.79 | 26.6 | 27.4 |
| Coca-Cola (KO) | 11 | 275.86 | 305.46 | 28.2 | 25.8 |
| Philip Morris (PM) | 7.1 | 158.83 | 182.31 | 18.6 | 18.5 |
| CVS Health (CVS) | 4.3 | 133.56 | 184.97 | 43.1 | 11.9 |
RHS’ top five is, expectedly, completely different, with WBA, an ultra-low P/E stock, being its main holding at the moment.
| Stock | Weight, % | Market Cap, $Billion | Enterprise Value, $Billion | P/E TTM | P/E FWD |
| Walgreens Boots Alliance (WBA) | 3.32 | 35.72 | 74.78 | 8.27 | 9.231 |
| General Mills (GIS) | 3.26 | 50.69 | 61.91 | 18.21 | 21.07 |
| Campbell Soup (CPB) | 3.25 | 16.06 | 21 | 21.55 | 18.60 |
| Walmart (WMT) | 3.23 | 413.60 | 475.53 | 47.04 | 25.25 |
| Monster Beverage (MNST) | 3.23 | 53.87 | 51.25 | 46.03 | 44.95 |
Created by the author using data from Seeking Alpha and the funds
At the same time, RHS’ forward-looking WA P/E looks totally normal, as STZ has a Forward P/E of just 23.6x.
Next, the fund has a WA Enterprise Value/EBITDA above IYK’s, though marginally; this is clearly a disappointment, and STZ with a reasonable multiple of 16.6x is not the culprit. However, when it comes to the EV/Sales ratio, the Invesco fund is meaningfully ahead, with the best result in the group. Also, this chimes well with the fact that the ETF has the lowest WA Forward revenue growth at 5.8% vs. IYK’s 6.4% and XLP’s 6.2% as robust sales growth stories imply higher EV/S and P/S multiples and vice versa.
Besides, I have added the share of comparatively overvalued and undervalued stocks; specifically, those companies that are relatively underappreciated have a Quant Valuation grade of B- and better, while those seemingly overappreciated have a D+ rating and worse. Here, RHS has the lowest share of overvalued consumer staples plays, yet IYK holds a larger share of those attractively priced compared to the sector medians and historical averages.
Regarding quality, there is a surprise. RHS and XLP have the largest share of stocks with at least B- Quant Profitability rating in the peer group, while IYK lags a bit, owing to Freshpet (FRPT), Bunge (BG), and Spectrum Brands Holdings (SPB).
Created by the author using data from Seeking Alpha and the fund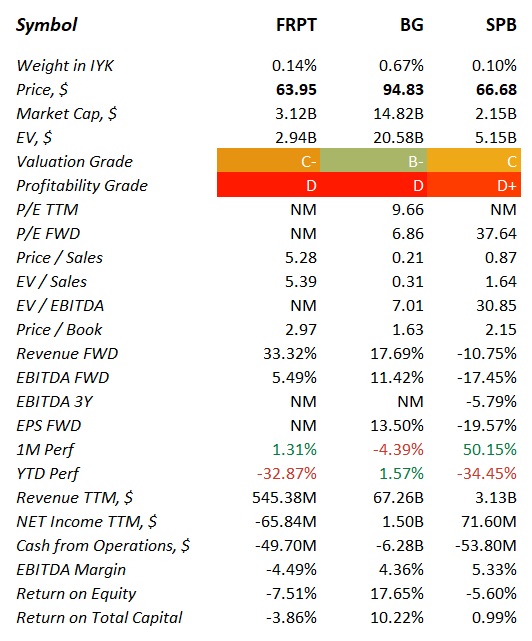
Overall, RHS has no exposure to cash-burning, EBITDA-negative, or unprofitable companies, which is an incredible level of quality. IYK is close, yet there is one loss-making firm in the portfolio, namely FRPT, and three cash flow-negative ones.
Performance: mixed impression
Was RHS’ strategy supportive of robust returns in the past?
First, let us look at the December 2006 – November 2022 period (it was incepted on 1 November 2006). IYK was intentionally removed from the comparison as it changed its underlying index in September 2021, which I discussed in greater depth in the May article, with results before the recalibration being of little relevance owing to profound changes in exposure, e.g., the removal of Tesla (TSLA), Ford (F), Corteva (CTVA), etc.
| Portfolio | RHS | IVV | XLP |
| Initial Balance | $10,000 | $10,000 | $10,000 |
| Final Balance | $50,402 | $39,944 | $46,059 |
| CAGR | 10.64% | 9.04% | 10.02% |
| Stdev | 13.03% | 15.86% | 12.43% |
| Best Year | 32.54% | 32.30% | 27.43% |
| Worst Year | -22.45% | -37.02% | -15.02% |
| Max. Drawdown | -30.47% | -50.78% | -28.12% |
| Sharpe Ratio | 0.77 | 0.57 | 0.76 |
| Sortino Ratio | 1.2 | 0.83 | 1.19 |
| Market Correlation | 0.77 | 1 | 0.74 |
Created by the author using data from Portfolio Visualizer
Over that period, RHS delivered the strongest compound annual growth rate and the highest risk-adjusted returns (the Sharpe and Sortino ratios) compared to the iShares Core S&P 500 ETF (IVV) and XLP, even though it trailed the latter in 2008 (the worst year for all the funds analyzed).
However, it was not as strong over shorter timeframes. For instance, in the five-year period (December 2017 – November 2022), its CAGR appeared to be the weakest in the group, being about 1% below XLP’s, partly owing to differences in the expense ratios, with risk-adjusted returns being also rather soft.
| Portfolio | RHS | IVV | XLP |
| Initial Balance | $10,000 | $10,000 | $10,000 |
| Final Balance | $15,009 | $16,796 | $15,762 |
| CAGR | 8.46% | 10.93% | 9.53% |
| Stdev | 14.69% | 18.41% | 14.66% |
| Best Year | 28.17% | 31.25% | 27.43% |
| Worst Year | -10.84% | -13.18% | -8.07% |
| Max. Drawdown | -14.62% | -23.93% | -13.63% |
| Sharpe Ratio | 0.54 | 0.59 | 0.61 |
| Sortino Ratio | 0.86 | 0.88 | 0.96 |
| Market Correlation | 0.75 | 1 | 0.74 |
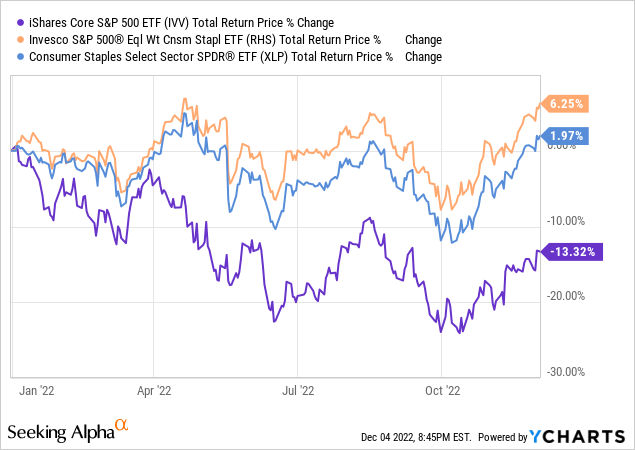
This is despite the fact that in 2022, it has outshined the SPDR ETF, let alone the market, which has been dragged down by growth stocks’ underperformance.
Final thoughts
Investors have a few options to play defense, with RHS being a solid, smart beta choice. However, the analysis presented revealed that the equal weight schema is not necessarily supportive of cheaper valuations (depending on a definition), with performance (including volatility, risk-adjusted returns, and drawdowns) also being mixed. That said, considering its advantages and vulnerabilities, RHS deserves a Hold rating.
Be the first to comment