

pic_studio/iStock via Getty Images
Reynolds Consumer Products Inc. (NASDAQ:REYN) has had a rocky year in terms of financial returns, but the company has done well compared to the Vanguard S&P 500 Index ETF (VOO). REYN is overvalued at current levels, sees lower sales volumes, and has high debt. It is best to wait for a pullback in Reynolds Consumer Products Inc.’s stock to buy it at a more attractive valuation.
Good Total Revenue Growth, but Profit Margins are Under Pressure
The company had robust revenue growth in 2020 and 2021, driven by the pandemic. Before 2020, its annual revenue growth was 0.75%, 6.2%, and negative 3.5% in 2017, 2018, and 2019 respectively. Even Q1 2022 (March 2022) was a good one regarding revenue growth (Exhibit 1). In 2022, the company has successfully increased its prices, thus driving revenue growth, but sales volumes are down for most product segments (Exhibit 2).
The only bright spot is the company’s Hefty Tableware segment, which continues to see volume increases due to the daily use of its products and strong club channel sales (Exhibit 2). The company may be seeing a normalization of demand after two heady years of increased meal preparation and consumption at home. In 2022, consumers have started eating at restaurants, which may be the cause for the double-digit decrease in volumes for the Reynolds Cooking & Baking segment. Sales should stabilize in 2023, given a better comparison to 2022. But Reynolds’ products are not fast-growing; instead, one should expect steady low-single-digit growth in volumes.
Exhibit 1:
Reynolds Consumer Products Year-over-Year Change in Quarterly Revenue, Gross Profits, and Diluted EPS (Seeking Alpha, Author Compilation)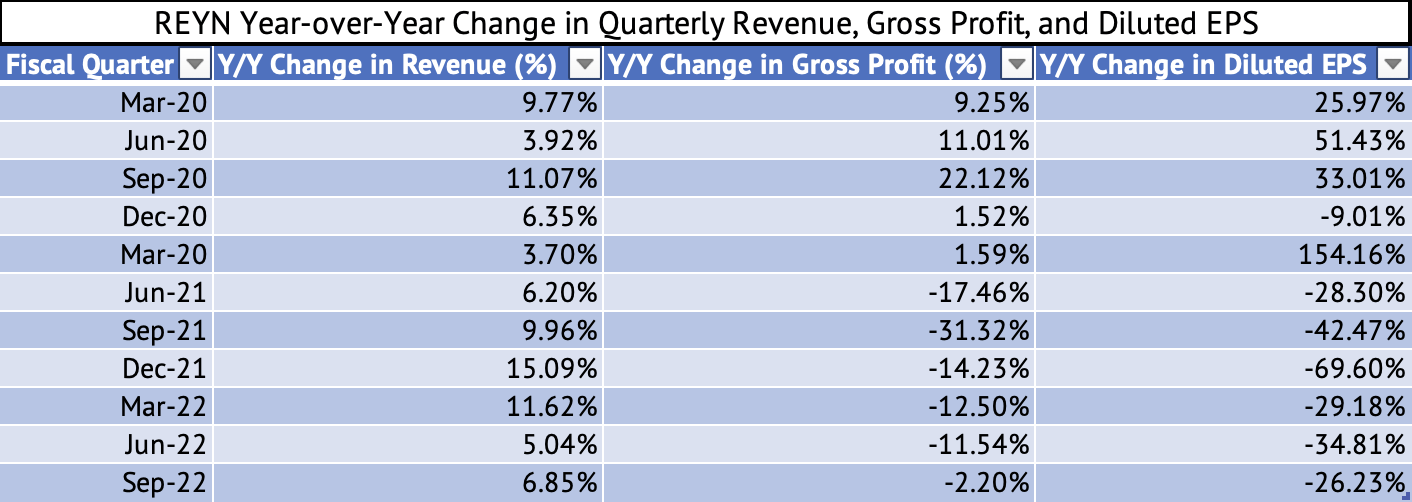
Exhibit 2:
Reynolds Consumer Products Year-over-Year Change in Sales Volumes (Reynolds’ Consumer Products, Author Compilation)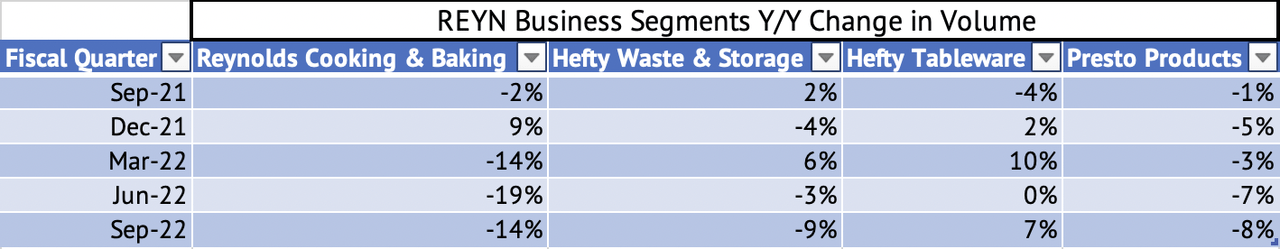
The company’s gross profit and diluted EPS have seen a massive year-over-year decline. Even though the company was able to increase prices, inflation and higher inventory reduced profits. The company’s gross margin has declined below 20% for the quarter ending September 2022 (Exhibit 3). This declining gross profit margin had a cascading effect on operating income and net income margins, with the operating margin at 8.5% and the net income margin at 4.9% for the quarter ending September 2022.
Exhibit 3:
Reynolds Consumer Products Quarterly Gross Profit, Operating, and Net Income Margins (Mar 2020-Sep 2022) (Seeking Alpha, Author Compilation)![Reynolds Consumer Products Quarterly Gross Profit, Operating, and Net Income Margins [Mar 2020 - Sep 2022]](https://static.seekingalpha.com/uploads/2022/12/5/28462683-16702945391127_origin.png)
High Inventory Levels Might Keep Profits Depressed in 2023
At the end of Q3 2022, Reynolds Consumer Products Inc. had $796 million in inventory, an increase of 36% from the same period in 2021. At the end of 2021, the company had 78 days of sales in its inventory. On a trailing 12-month basis, the company has about 97 days of sales in inventory (Exhibit 4). This inventory level can be another headwind for sales growth and profitability in a slowing consumer demand environment.
Exhibit 4:
Reynolds Consumer Products Days Sales in Inventory (Seeking Alpha, Author Calculations)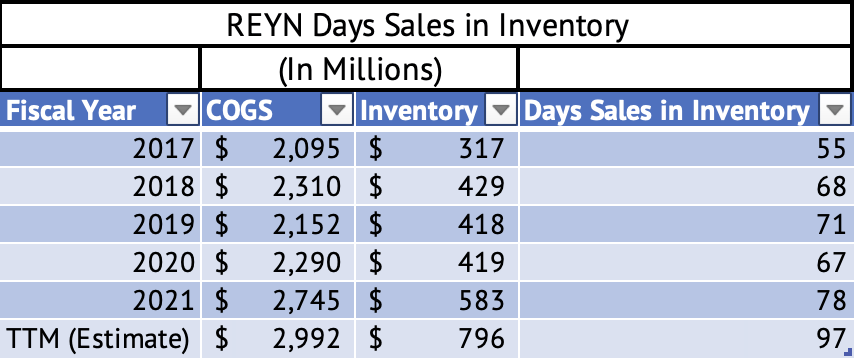
In Q3 2022, the company’s Reynolds Cooking & Baking segment experienced unplanned downtime that impacted throughput and extended the timeline for reducing its higher-cost aluminum inventory. The company faced a steep increase in material costs, which may be reflected in the inventory carrying cost on its balance sheet.
In short, these high inventory levels may be due to inflation and downtime, but either way, this will affect sales and margins in the coming quarters. The increase in inventory has led to a sharp decline in operating cash flows. In the trailing 12 months, the company had an operating cash flow of $306 million, its lowest level in the past six years.
Reynolds Gets a Poor Dividend Grade
The company has a short history of paying dividends, and the stock offers a 2.85% yield, much lower than the current 2-year US Treasury yield of 4.3%. The company’s payout ratio is a high 72%. In the trailing 12 months, the company paid total dividends of $192 million and had operating cash flows of $306 million. The company uses 62% of its operating cash flows for dividends, a high and unsustainable number. If its sales weaken further, the company may see further deterioration of its cash flows, thus hurting the company’s ability to sustain a dividend. Seeking Alpha gives a quant rating of “D+” for the company’s dividend safety, a poor grade; the financials support that low grade for the company (Exhibit 5).
Exhibit 5:
Reynolds Consumer Products Gets Low Dividend Grades (Seeking Alpha)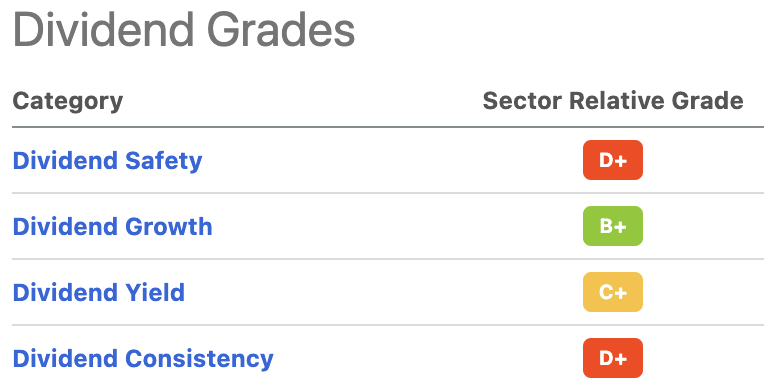
Reynolds is Saddled with High Debt Levels
Even though the company has repaid $1.22 billion in long-term debt in the past six years (Exhibit 6), it still has high debt levels. As of Q3 2022, the company had outstanding long-term debt of $2.07 billion. Its debt to EBITDA ratio is a worrying 4.1x. Its current and quick ratios are much more tolerable at 2.2x and 1x, respectively (Exhibit 7).
Exhibit 6:
Reynolds Consumer Products Debt Reduction (2016-2021) (Seeking Alpha, Author Compilation)![Reynolds Consumer Products Debt Reduction [2016 - 2021]](https://static.seekingalpha.com/uploads/2022/12/6/saupload_WDzYcAJmVQvQ4UAOgR2pC97nz23CyEqFrXaHkpmNL_-pQXQVszfRDMb5xIVpV112QT7a8acWdn3ScXv4y24GBEaajxfkHQOLfsqfKzw7R5y4aq0b7cPdKMlH3DyksxyTMkmiPXsYyz_TX8J_QWaZ9ex9SRcIYKHPaalMbJnVNo85SpA_fmteZ8hePRm-2Q.png)
Exhibit 7:
Reynolds Consumer Products Debt to EBITDA, Current, and Quick Ratios (Seeking Alpha)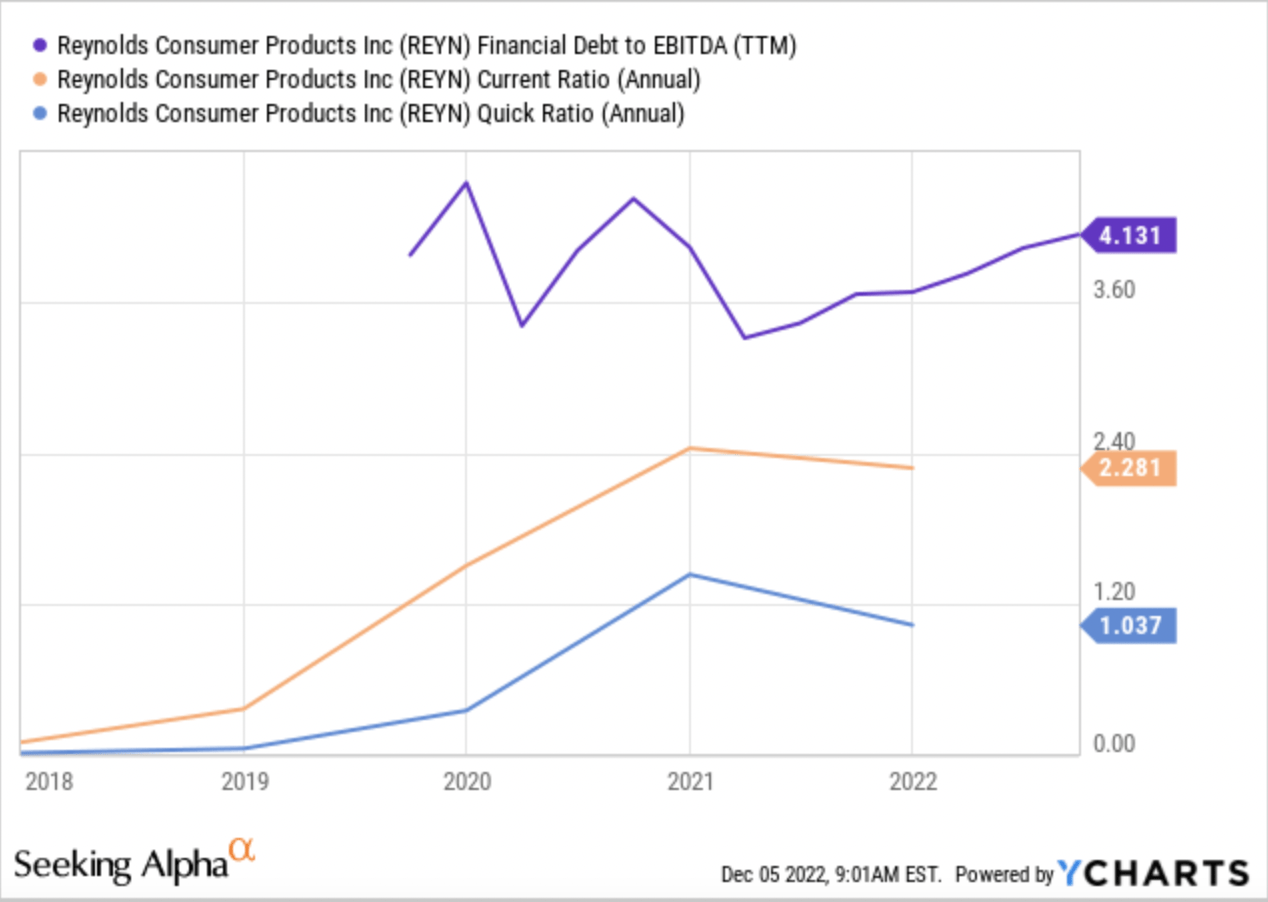
When interest rates were low during the past decade, it was easy for companies like Reynolds to take on high debt levels without much impact on cash flows. Reynolds is an excellent example of how high debt levels can come back to haunt a company. The company’s borrowing costs will increase as it tries to manage its debt levels, but it does not have large operating cash flows to pay down the debt quickly.
Monthly Return Volatility Compared to the Vanguard S&P 500 Index ETF
Reynolds has had less volatility in the monthly returns than the Vanguard S&P 500 Index ETF. A linear regression of the monthly returns of Reynolds and the Vanguard S&P 500 Index ETF yields a beta of 0.44. With this beta, the company’s monthly return would change on an average of 0.44% for every 1% change in the monthly return of the Vanguard S&P 500 Index ETF.
Reynolds, like other stocks in the consumer staples stocks, is less volatile compared to the market. Thus, Reynolds and other consumer staples stocks can protect a portfolio in a down year such as 2022. Reynolds has returned 4.79% compared to a negative 12.9% return for the Vanguard S&P 500 Index ETF.
High Valuation of Reynolds Consumer Products
The company is overvalued at current prices. Reynolds trades at a trailing GAAP P/E of 26x and a forward GAAP PE of 25x. With its massive cash flows, even technology giant Apple (AAPL) is trading at 23x forward GAAP P/E, and Alphabet (GOOG, GOOGL) is trading at a forward GAAP P/E of 21x. But, do not expect a correction during these volatile periods for the market.
Conclusion
Reynolds Consumer Products Inc. has poor volume growth, price increases may not continue to bolster its sales and high debt levels. Other much safer investments offer a higher yield than Reynolds, and the company is overvalued. But, until the market stays volatile, investors will continue taking shelter in the consumer staples sector because the sector protects a portfolio against a market downturn.
Every cycle turns, and this one will shift too. The turn may come when the U.S. Federal Reserve is done raising rates, or the U.S. economy enters recession. Once investors are comfortable with taking risks, consumer staples stocks will slide, allowing investors to buy Reynolds Consumer Products at a reasonable valuation.
Be the first to comment