

Marcus Lindstrom/E+ via Getty Images
Buying into rapidly growing companies can be exciting and profitable. But at the same time, paying a premium for them as often happens can be fraught with risks. Missing out on strong upside can be rather painful, especially at a time when the broader market is down significantly. One such company that I have so far gotten wrong is Rexford Industrial Realty (NYSE:REXR). This high-quality industrial REIT continues to grow at a rapid clip. However, the price investors must pay for it is rather lofty. Given how developments have changed recently, I have come to develop a new appreciation for the business. I do still think it is a risky prospect for investors to buy into. But in the long run, further upside potential is probable. Because of this, I’ve decided to change my rating on the company from ‘hold’ to a soft ‘buy’.
Rapid growth continues
Back in April of 2021, I wrote my first article about Rexford Industrial Realty. At that time, I detailed the rapid growth the company was experiencing. I knew then that I was dealing with a quality operator in the industrial REIT space that would likely continue to grow in the years to come. But even so, I was aghast by the high trading multiples of the company. As a value investor, I eschew paying a premium for stock and opt to search for low-priced, underappreciated businesses in most cases. Because of this, I ended up rating the company a ‘hold’, which is my way of saying I think overall performance for the company will more or less match what the broader market achieves over an extended timeframe. So far, my call on the company has been woefully inadequate. Due to rapid growth created by management, shares of the company have generated a return for investors of 11.8%. This comes at a time when the broader market, as measured by the S&P 500, is down by 9.8%.
Author – SEC EDGAR Data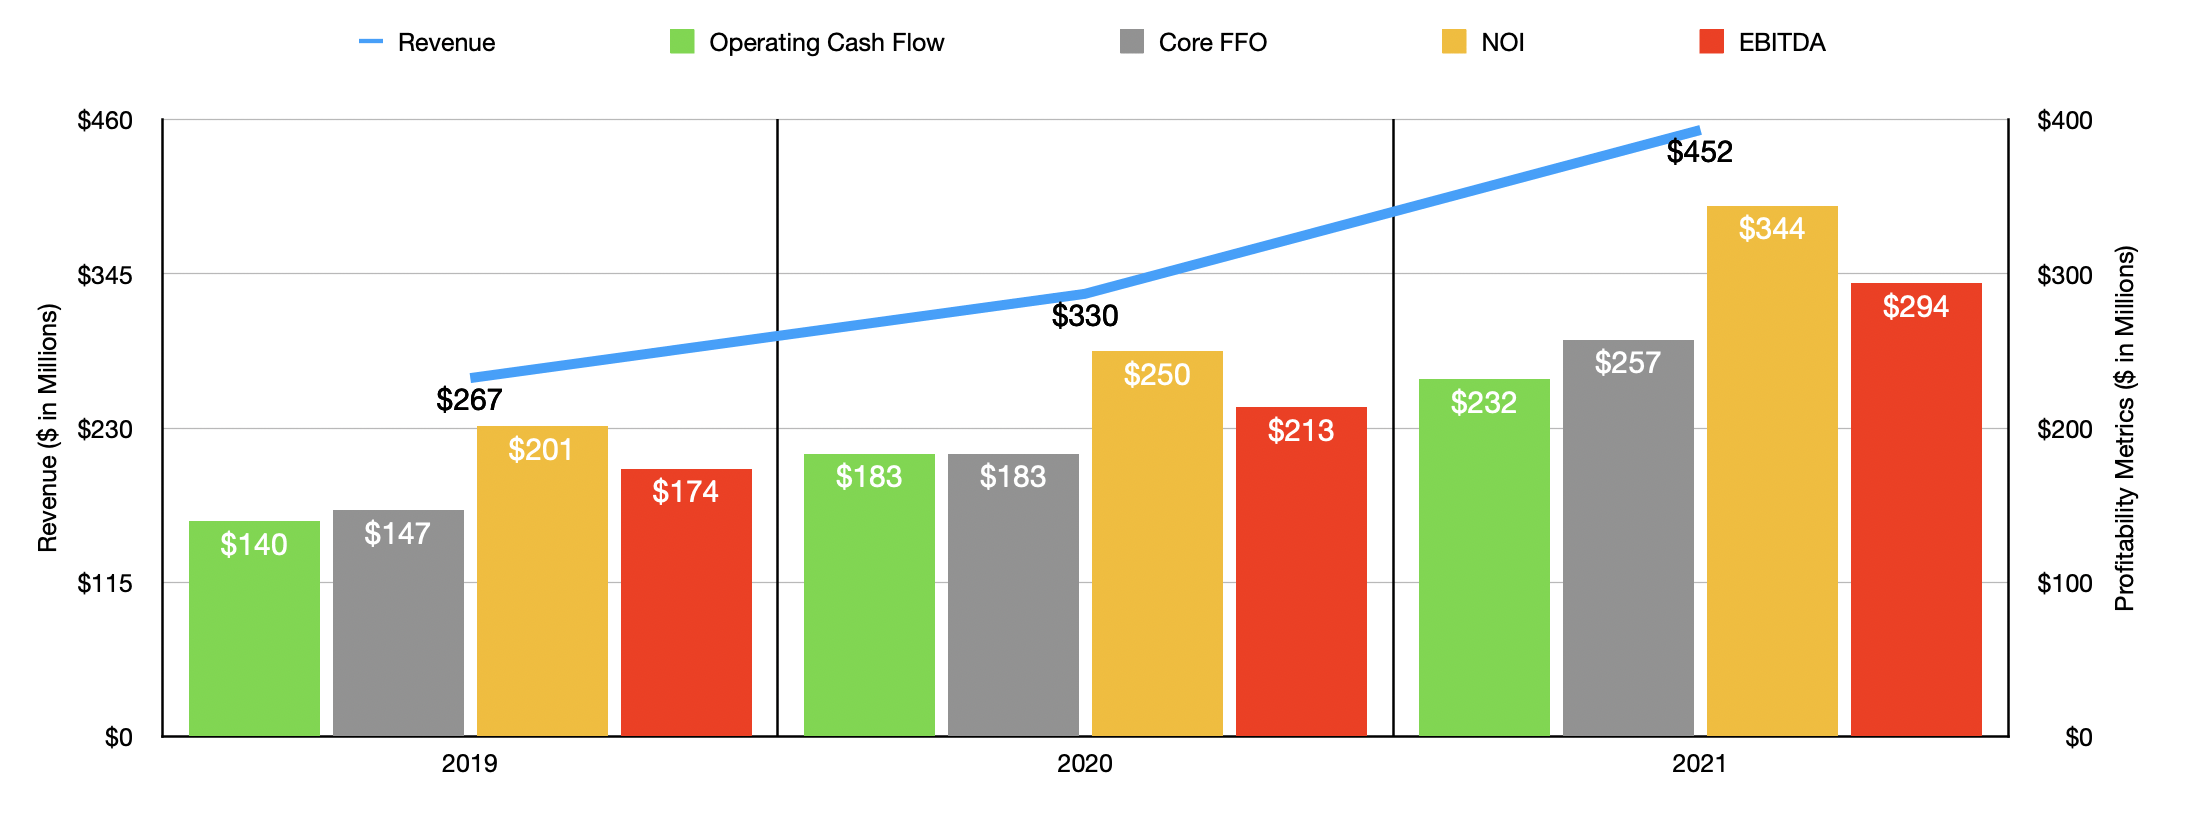
To best illustrate what I mean by rapid growth, it would be wise to discuss how the company performed during its 2021 fiscal year. Revenue for that year came in at $452.2 million. That’s 37% higher than the $330.1 million generated in 2020. That’s not the first strong year for the company. Revenue growth between 2016 and 2021 has come out at an annualized rate of 29.1%. This has been driven by consistently high occupancy at the company’s properties, combined especially with a surge in the number of properties it owns. In 2016, the business had just 136 properties. By the end of 2021, this number had grown to 296, representing an increase of 19.4% over the 248 the company had at the end of 2020.
Financial performance on the bottom line has been equally robust. Operating cash flow in 2021 totaled $231.5 million. That compares to the $183 million reading the company reported for 2020. Of course, we should also look at other profitability metrics. FFO, or funds from operations, expanded from $182.5 million to $257.3 million. NOI, or net operating income, soared from $249.7 million to $344 million. Meanwhile, EBITDA for the company expanded from $213.4 million to $293.7 million.
Author – SEC EDGAR Data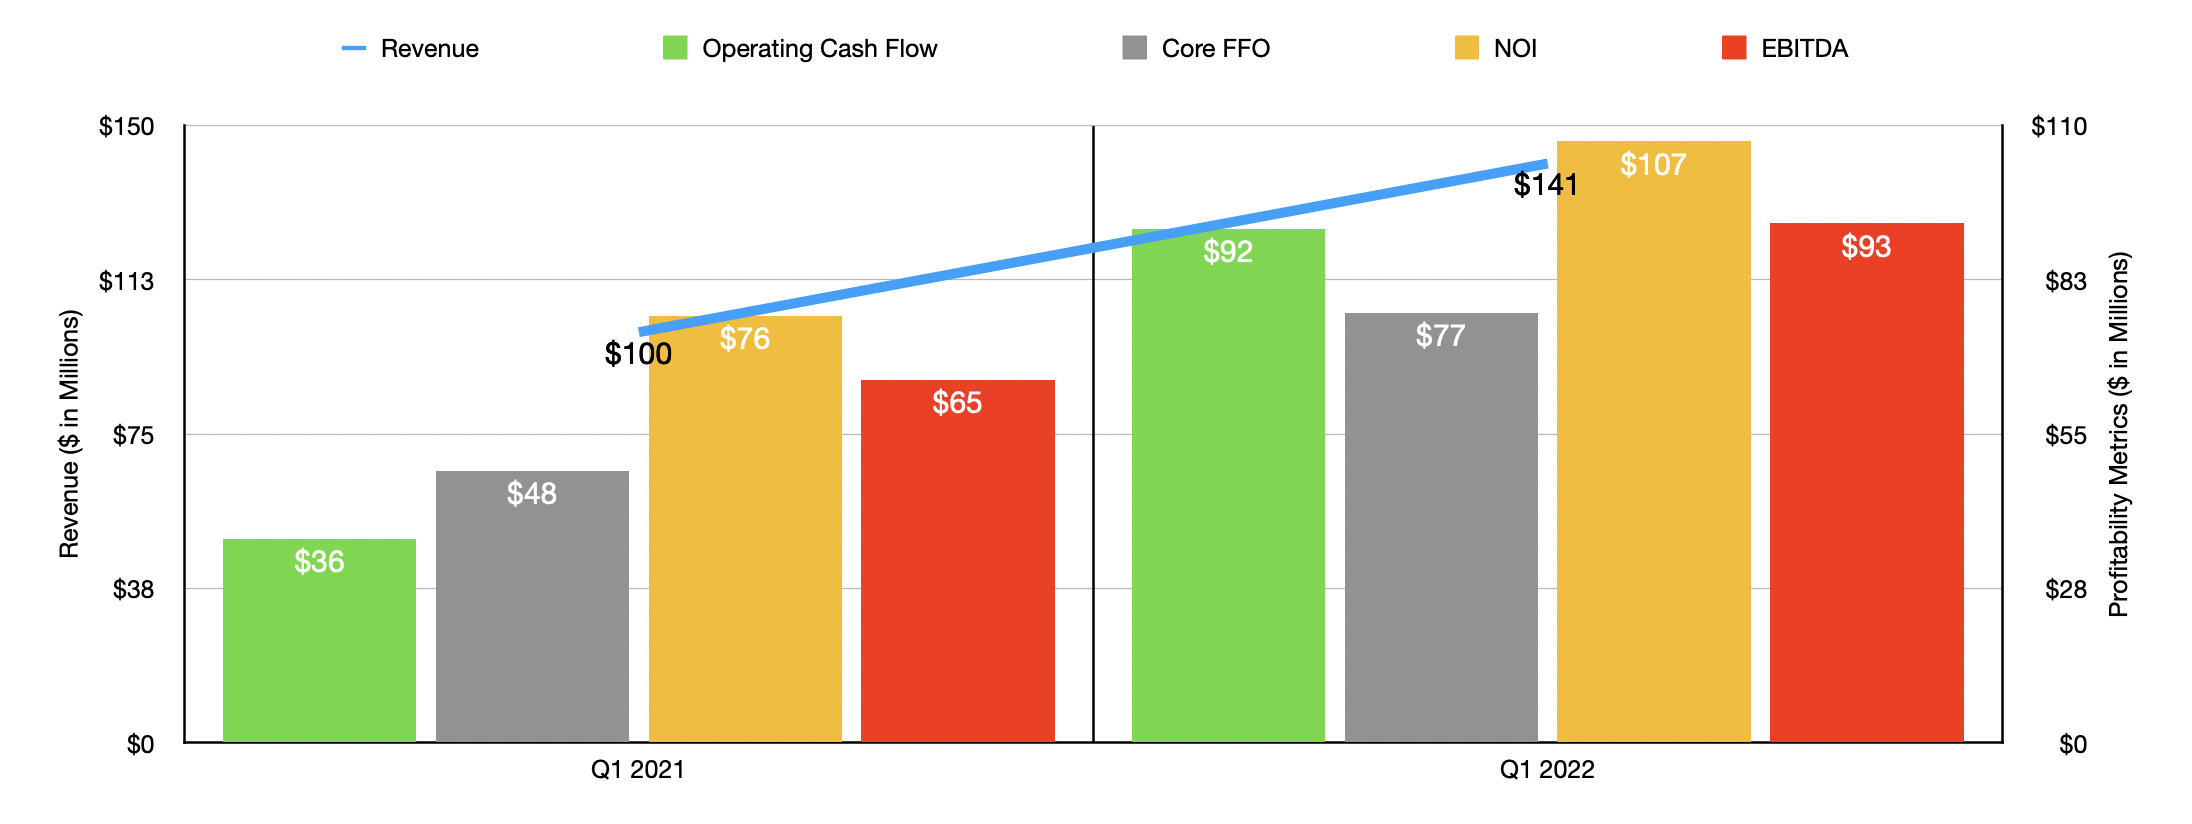
This strong performance has continued into the 2022 fiscal year. Revenue in the first quarter of the year totaled $140.8 million. That’s a massive year-over-year increase of 41.1% compared to the $99.8 million achieved the same time one year earlier. In addition to seeing the occupancy rate of its properties rise from 95.8% to 96.3%, the business also grew its number of properties to 312. That compares to the 257 reported in the first quarter of 2021. During the first quarter alone, the company purchased 17 properties, representing 1.51 million square feet of leasable space, bringing the company’s total square footage to 38.1 million. Of course, these purchases did not come cheap. The business ultimately paid $457.65 million for these latest assets. Of its properties, 134 fit into the warehouse and distribution category, while a further 79 fall under the warehouse and light manufacturing niche. Combined, these two property types make up 73% of the firm’s annualized base rent. The business is clearly focused on the e-commerce market which should prove to be fertile ground for further expansion for the foreseeable future. This statement is further qualified by the fact that 13 of these properties are located in Los Angeles, which, for the US, is the single largest port of entry for international goods.
Rexford Industrial Realty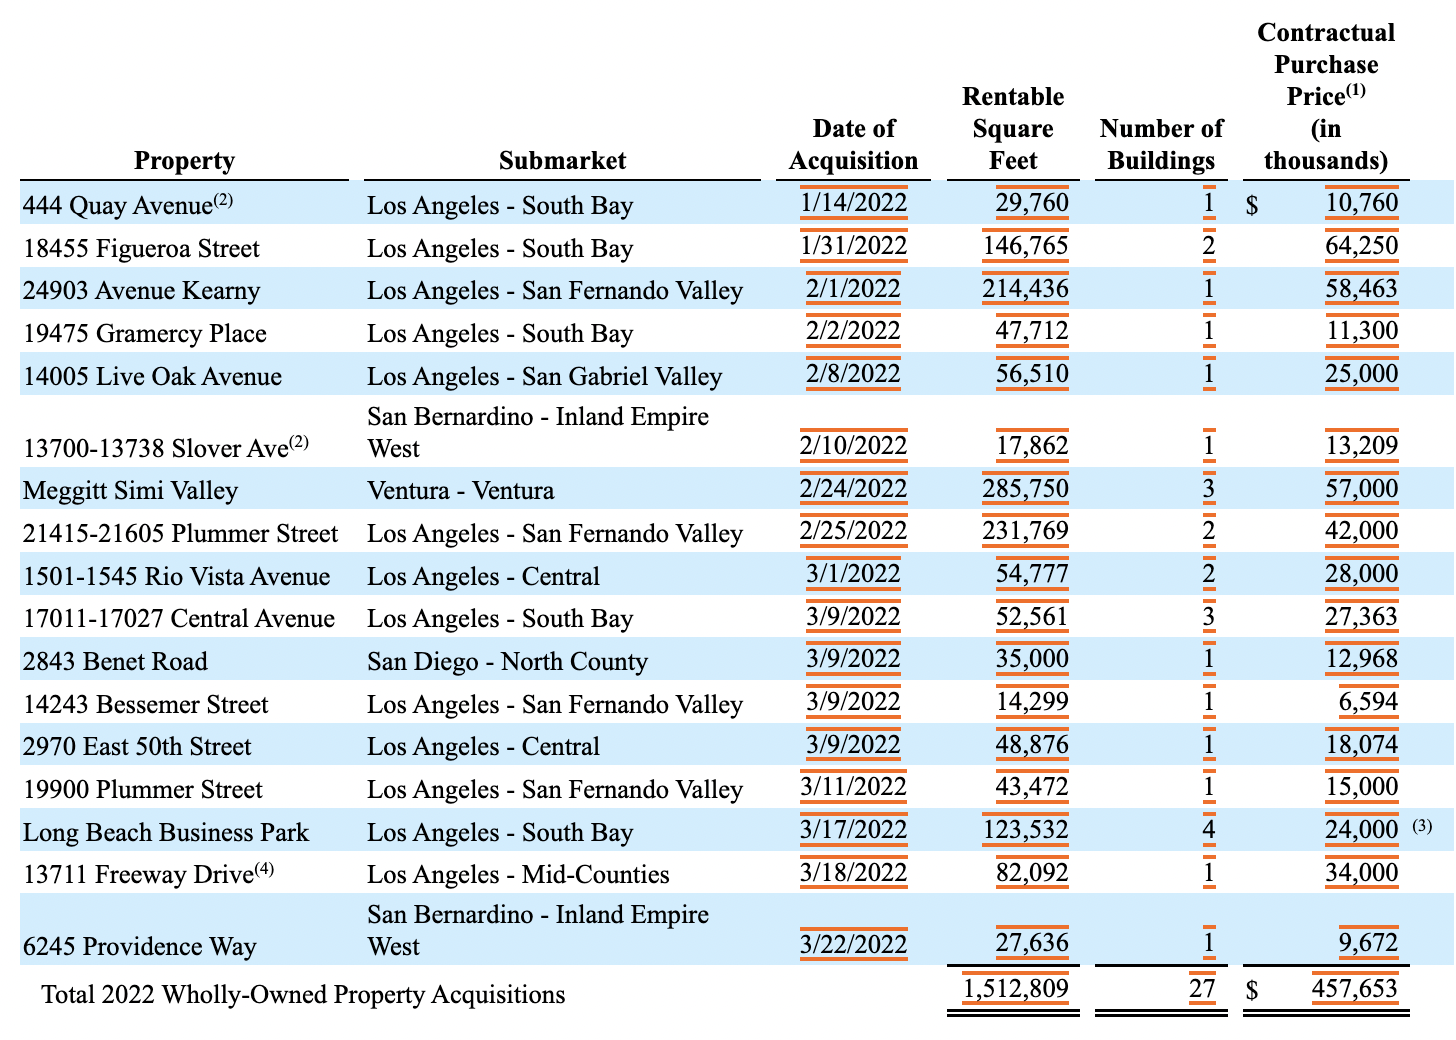
As revenue increased, so too did profitability. Operating cash flow of $91.6 million dwarfed the $36.4 million generated the same time one year earlier. Core FFO rose from $48.4 million to $76.6 million, while NOI jumped from $76.1 million to $107.2 million. Meanwhile, EBITDA also increased, climbing from $64.7 million to $92.6 million. When it comes to the 2022 fiscal year as a whole, management expects the company’s same-store occupancy to be between 98.25% and 98.75%. This implies an increase in occupancy throughout the rest of the year. Core FFO per share should be between $1.84 and $1.88. At the midpoint, this should translate to FFO of roughly $306.9 million. If we assume that other profitability metrics will grow at a similar rate, we can expect operating cash flow of $276.1 million, NOI of $410.3 million, and EBITDA of $350.3 million.
Author – SEC EDGAR Data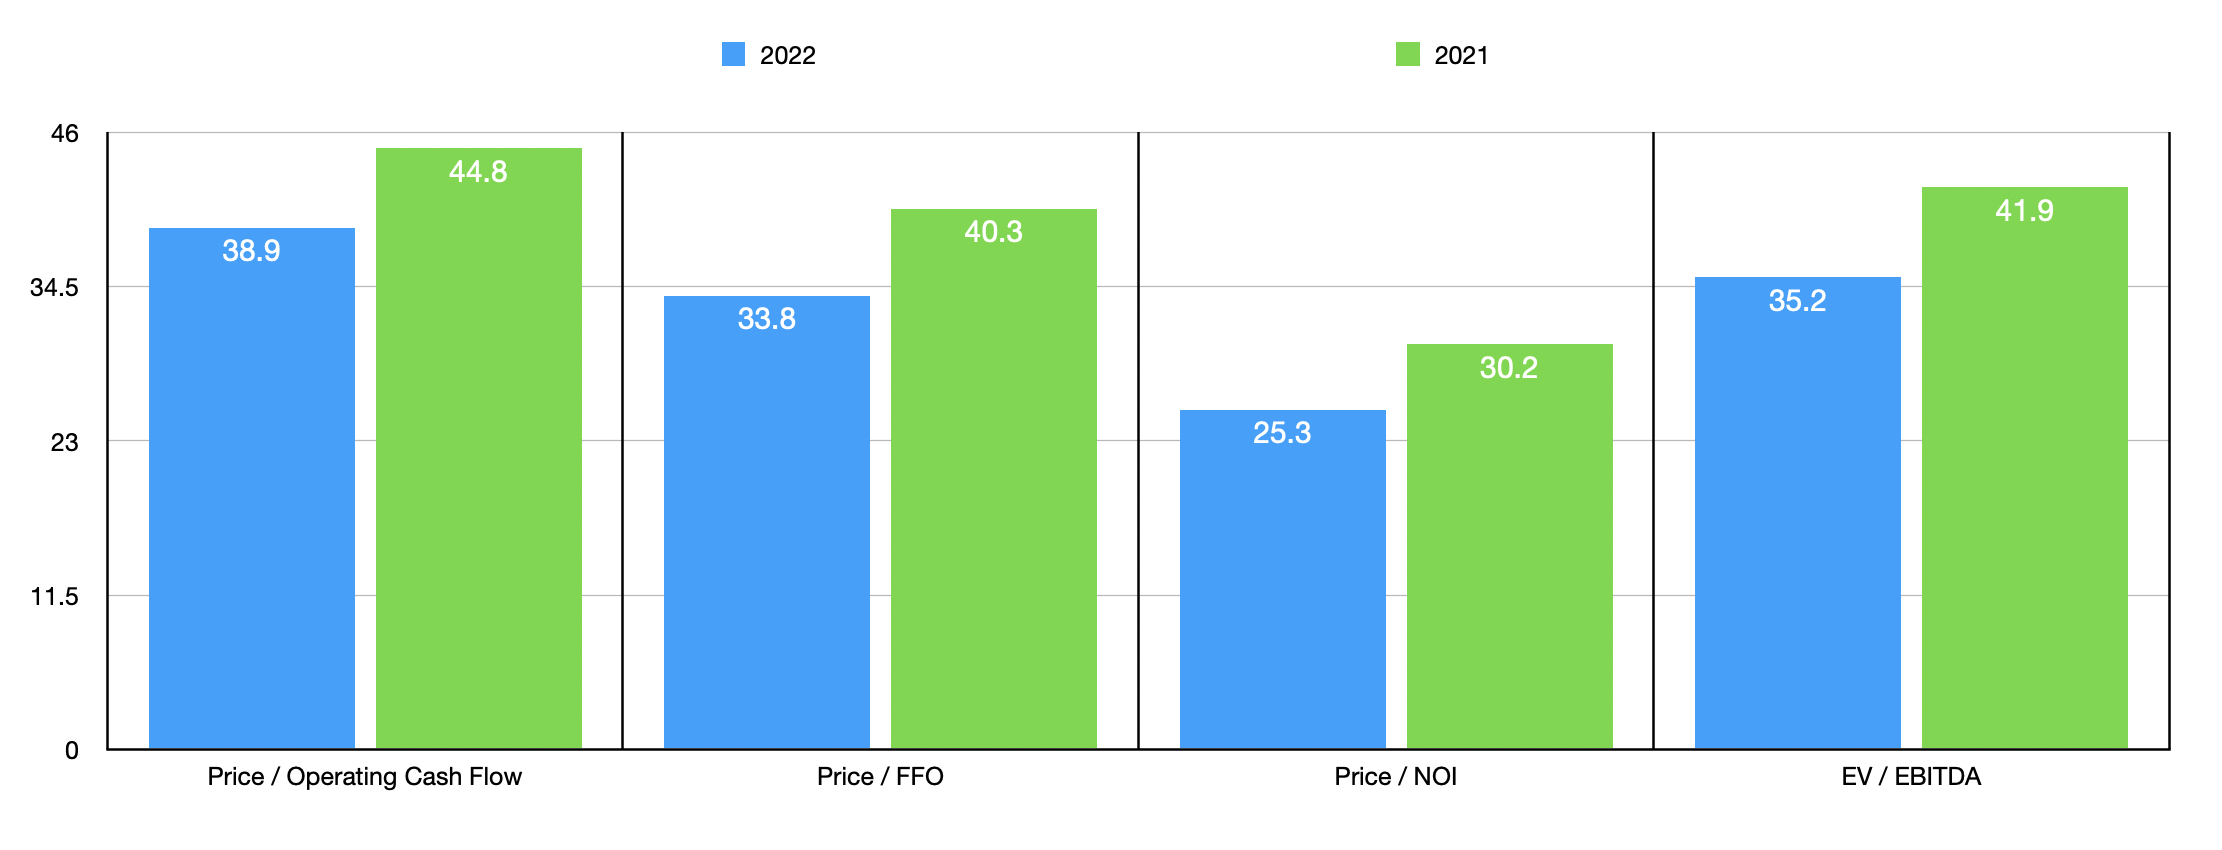
Using this data, it’s not a stretch to price the company. Using the 2022 estimates, we can see that the firm is trading at a price to operating cash flow multiple of 38.9. This is down from the 44.8 figure that we get if we use 2021 results. The price to FFO multiple should drop from 40.3 if we use 2021 figures to 33.8. Meanwhile, the price to NOI multiple should improve from 30.2 to 25.3, while the EV to EBITDA multiple should decline from 41.9 to 35.2. To put the pricing of the company into perspective, I took two of these metrics and compared them to the results of five similar firms. On a price to operating cash flow basis, these companies ranged from a low of 14.7 to a high of 31.7. And using the EV to EBITDA approach, the range was from 14.6 to 29.4. In both of these scenarios, Rexford Industrial Realty was the most expensive of the group.
| Company | Price / Operating Cash Flow | EV / EBITDA |
| Rexford Industrial Realty | 38.9 | 35.2 |
| Americold Realty Trust (COLD) | 31.7 | 27.6 |
| EastGroup Properties (EGP) | 34.1 | 21.9 |
| First Industrial Realty Trust (FR) | 21.5 | 18.3 |
| STAG Industrial (STAG) | 14.7 | 14.6 |
| Terreno Realty Corp (TRNO) | 29.9 | 29.4 |
Takeaway
Generally speaking, I am no fan of high-growth companies that are trading at high prices. However, I do believe that further upside potential exists for Rexford Industrial Realty moving forward. The company has demonstrated continued rapid growth even during uncertain times and, absent a significant downturn or leveling off in global trade, I do not expect this picture to change anytime soon. I do think that the company is risky because of the high multiples, especially if we do go into a recession. But for those focused on the next five or ten years, I think there is some nice upside to be had so long as management can continue expansion.
Be the first to comment