

Imgorthand
I introduced the Simple Retirement Portfolios a bit more than two years ago. Portfolios are meant to provide retirees with a simple, yet effective way to invest their retirement savings, with varying levels of risk, yield, and passive / active exposure. Portfolios hold a diversified set of equity and fixed income funds, with diversified exposure to most relevant asset classes. Portfolios are as follows.
Seeking Alpha – Chart by author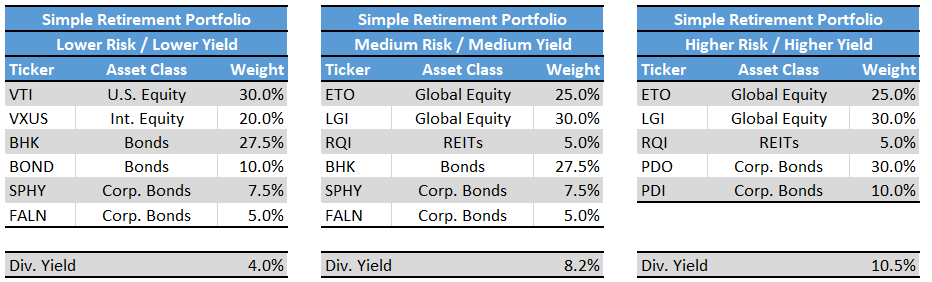
I’m doing semi-regular updates on these portfolios and their performance. The following article is the (belated) update for first half of 2022. Meant to write this in July, but was vacationing that month.
These past few months have seen broad-based losses across most relevant asset classes, including equities, bonds, preferreds, REITs, and more. These portfolios were not spared, and all are down double-digits YTD.
All portfolios have moderately underperformed their benchmark, due to narrowing CEF discounts, greater exposure to underperforming European equities, and lack of exposure to inflation-hedge securities or asset classes. Increased exposure to high-yield corporate bonds had a limited impact these past few months, a somewhat unexpected result, as said securities have held up relatively well.
All portfolios have outperformed their benchmark since inception, due to savvy selection of funds, narrowing discounts, and greater exposure to high-yield corporate bonds.
Portfolios outperform during bull markets, underperform during bear markets, but the net effect is overwhelmingly positive. So far at least.
The risk-return profile of the medium risk and higher risk portfolios looks particularly compelling. Both have significantly outperformed their benchmark since inception, with only a moderate increase in risk / losses during downturns. Income investors would almost certainly ignore these short-term losses, and focus on distributions and long-term capital sustainability, both of which are quite strong. The risk-return profile of the lower risk portfolio does not look compelling, as the portfolio has only slightly outperformed since inception, with moderately increased risk.
In general terms, I’m reasonably happy with how these portfolios have performed, although the lower risk portfolio has been something of a letdown, and underperformed expectations. This has been the case for most ‘safe’ funds and portfolios YTD, as very few asset classes, securities, and strategies have posted positive returns. Everything is down YTD, with a few exceptions, and the portfolio is not one of these.
Moving forward, returns for most portfolios will almost certainly be higher, due to rising interest rates and dividend yields.
Finally, a quick table summarizing the performance of the portfolios.
Seeking Alpha – Chart by author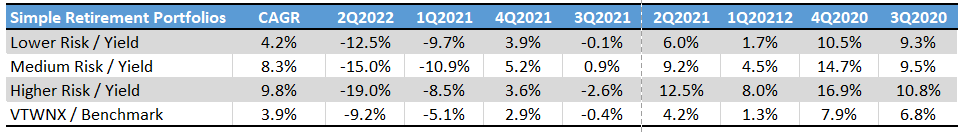
Simple Retirement Portfolios – Overview and Analysis
I’ll start with a brief overview of the construction and rationale behind the portfolios. Feel free to skip this section if you’ve read my previous articles on the subject.
The Simple Retirement Portfolios are based on the Vanguard Target Retirement 2020 Fund (VTWNX). VTWNX invests in a diversified portfolio of low-cost fixed income and equity index funds and is aimed towards recent retirees. Asset allocations change every quarter to reduce risk as retirees age.
Balanced funds, including VTWNX, generally provide retirees with superior returns than equity index funds. This includes those indexed to the S&P 500, as the said index is simply too volatile to fund the monthly income needs of the average retiree. I’ve done the math on this here.
VTWNX seemed like a perfect low-risk fund for retirees, so I used it as the basis for my model portfolios. The portfolios used VTWNX’s holdings in May 2020 as a starting point. Current holdings are only marginally different. These were as follows:
Vanguard Corporate Website To construct the portfolios, I simply swapped some of VTWNX’s holdings for stronger, higher-yielding alternatives with the potential for market-beating returns.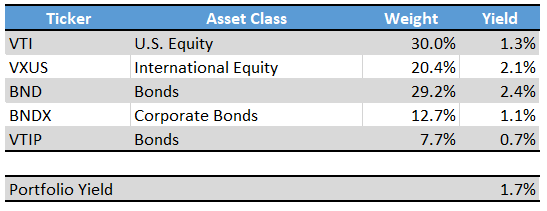
I created three portfolios, some more closely tracking their benchmark than others.
A lower-risk portfolio with few changes meant to closely track VTWNX but with the possibility of some excess returns and income.
A medium-risk portfolio with some more changes, somewhat tracking VTWNX, and with the possibility of excess returns and income.
A higher-risk portfolio with significant changes, less concerned with tracking VTWNX, and with the possibility of substantial excess returns and income.
The resultant portfolios were as follows.
Seeking Alpha – Chart by author
Simple Retirement Portfolios – Performance Analysis
Since inception, all portfolios and underlying funds have outperformed their benchmark, due to a combination of alpha, beta, and narrowing CEF discounts. As I’ve already covered these issues in previous articles, thought to focus on YTD portfolio performance / losses instead. These past few months have been the first real downturn experienced by these portfolios, so a closer look at their performance seems like a no-brainer.
Lower Risk/Yield Portfolio
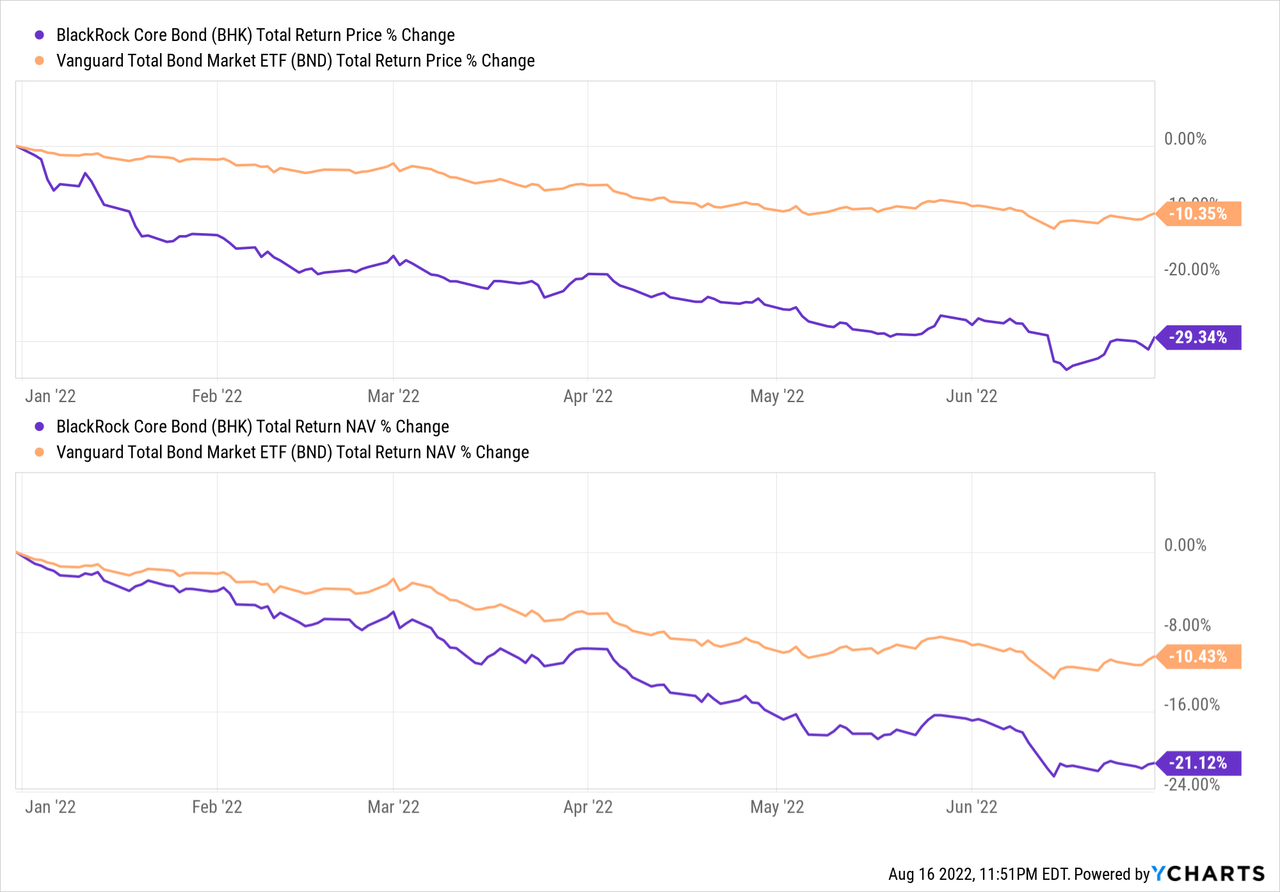
The lower risk portfolio has moderately underperformed relative to its benchmark for the first half of the year, suffering losses of 21% versus 14% for VTWNX. Biggest contributor to said losses was the BlackRock Core Bond Trust (BHK), a broad-based leveraged bond CEF.
BHK significantly underperformed its benchmark due to narrowing discounts, use of leverage, and overexposure to underperforming long-maturity investment-grade corporate bonds. BHK had seen lower losses during prior downturns due to savvy positioning and market timing, not so much this time around.
The iShares Fallen Angels USD Bond ETF (FALN) slightly underperformed relative to its benchmark too, as the fund, quite frankly, had performed too well in prior months. Bond prices had risen far above fundamentals, so a correction was in order.
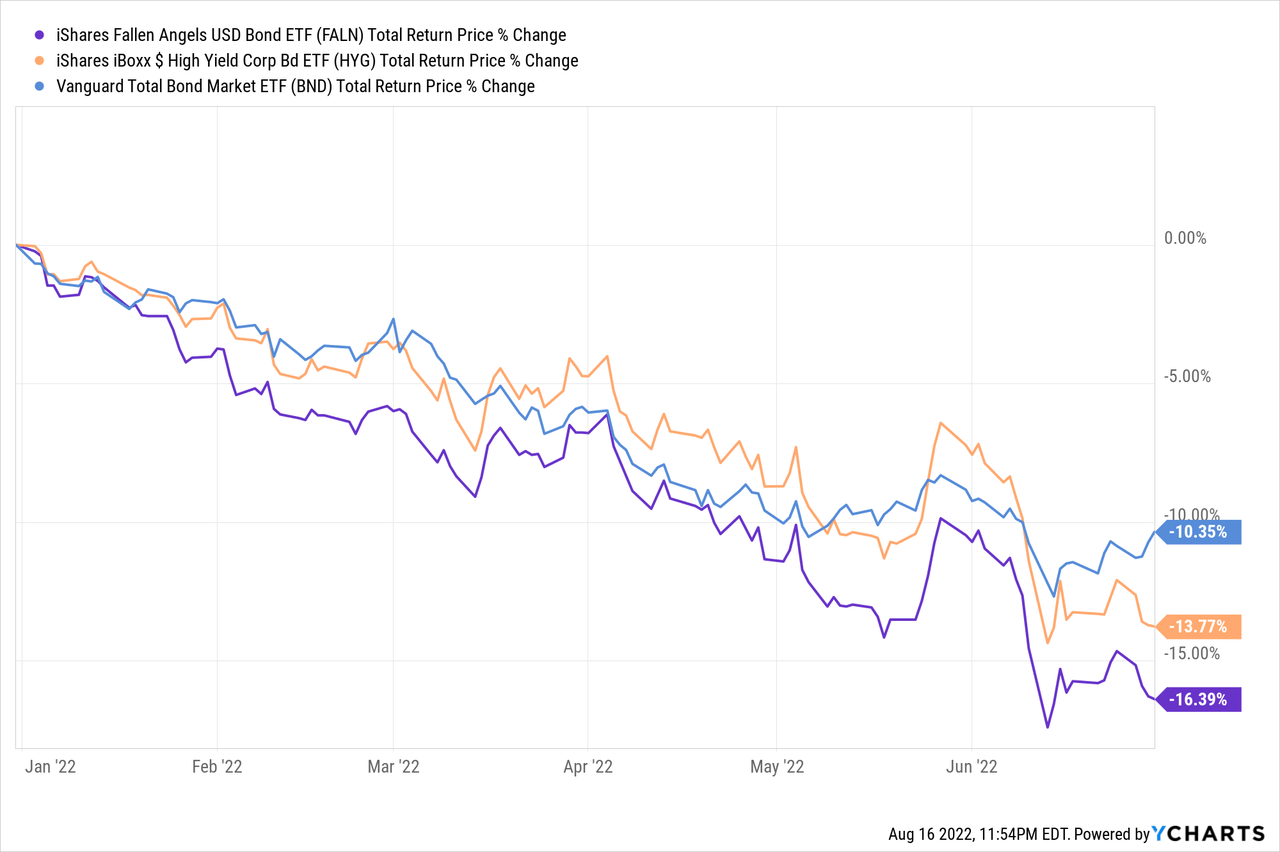
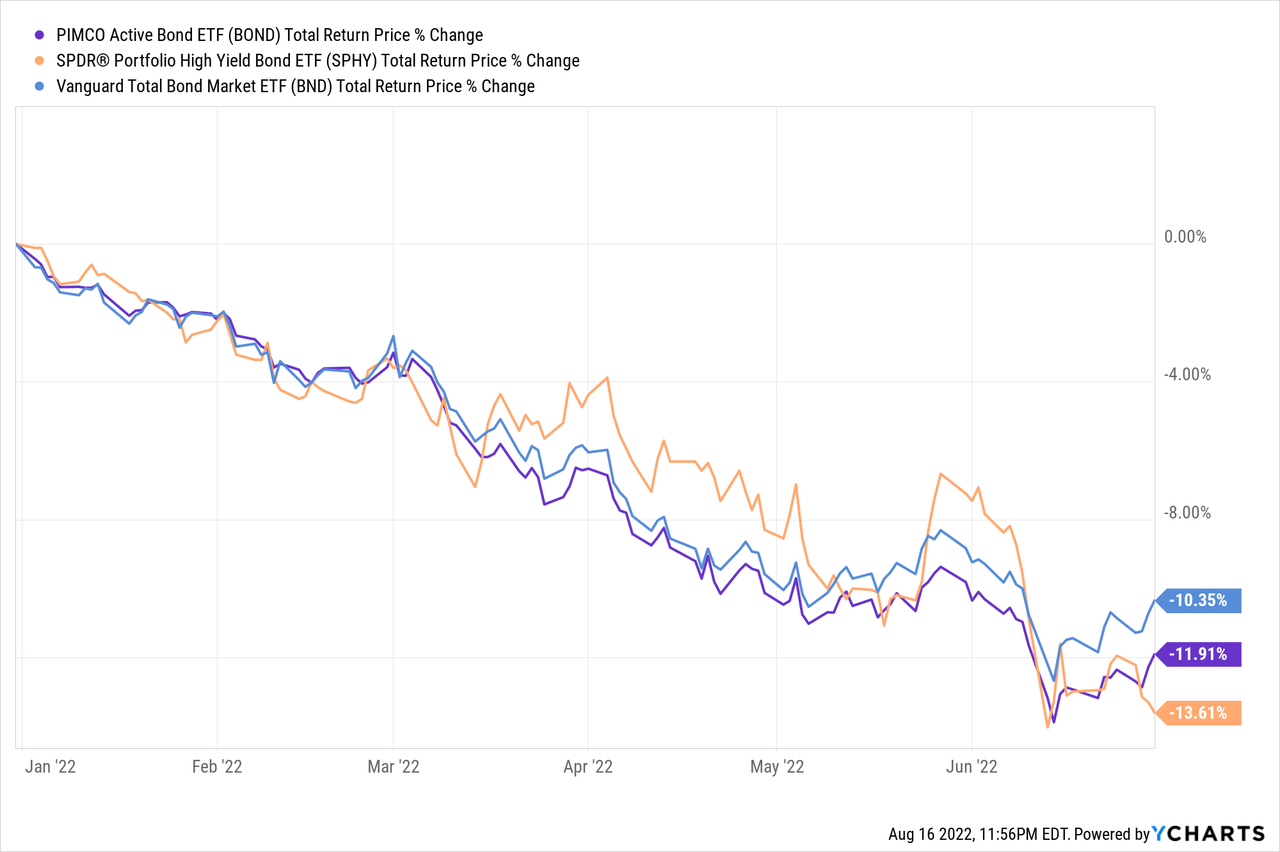
The SPDR Portfolio High Yield Bond ETF (SPHY) and the PIMCO Active Bond Exchange-Traded Fund (BOND) slightly underperformed relative to broader bond indexes too, but the difference was quite small, part of normal market volatility, and not terribly material.
When constructing the lower risk portfolio, there were two strategies / investment decisions which I thought could plausibly reduce losses during downturns. Neither worked.
The first was a greater allocation to high-yield corporate bonds. These securities tend to have low duration, and so outperform relative to most bonds when interest rate rise. Focusing on these bonds should have led to lower losses during a period of rising interest rates, including these past few months. High-yield corporate bonds have outperformed in the recent past, as expected, but by very little, so focusing on said bonds did not materially improve portfolio performance.
The second was through the selection of strong actively-managed funds, with the potential to minimize losses through investment alpha, savvy positioning, market timing, and the like. BHK, for instance, had suffered below-average losses during previous periods of rising interest rates, as the fund tended to shift towards lower maturity securities during these. These funds have been less effective during the current downturn, and failed to minimize losses or outperform relative to the index. This was at least partly due to the fact that the current downturn has been incredibly broad, affecting most relevant asset classes. Everything is down, with very few exceptions, so most funds are down too, with very few exceptions.
In general terms, although the lower risk portfolio did not suffer excessive losses these past few months, the overall risk-return profile has been quite mediocre. Returns were slightly above the benchmark, but risks / losses were moderately higher. Returns were also significantly below the other two portfolios, while risks / losses were only slightly lower. These results are consistent with market returns, as most lower-risk assets have performed in a similar manner.
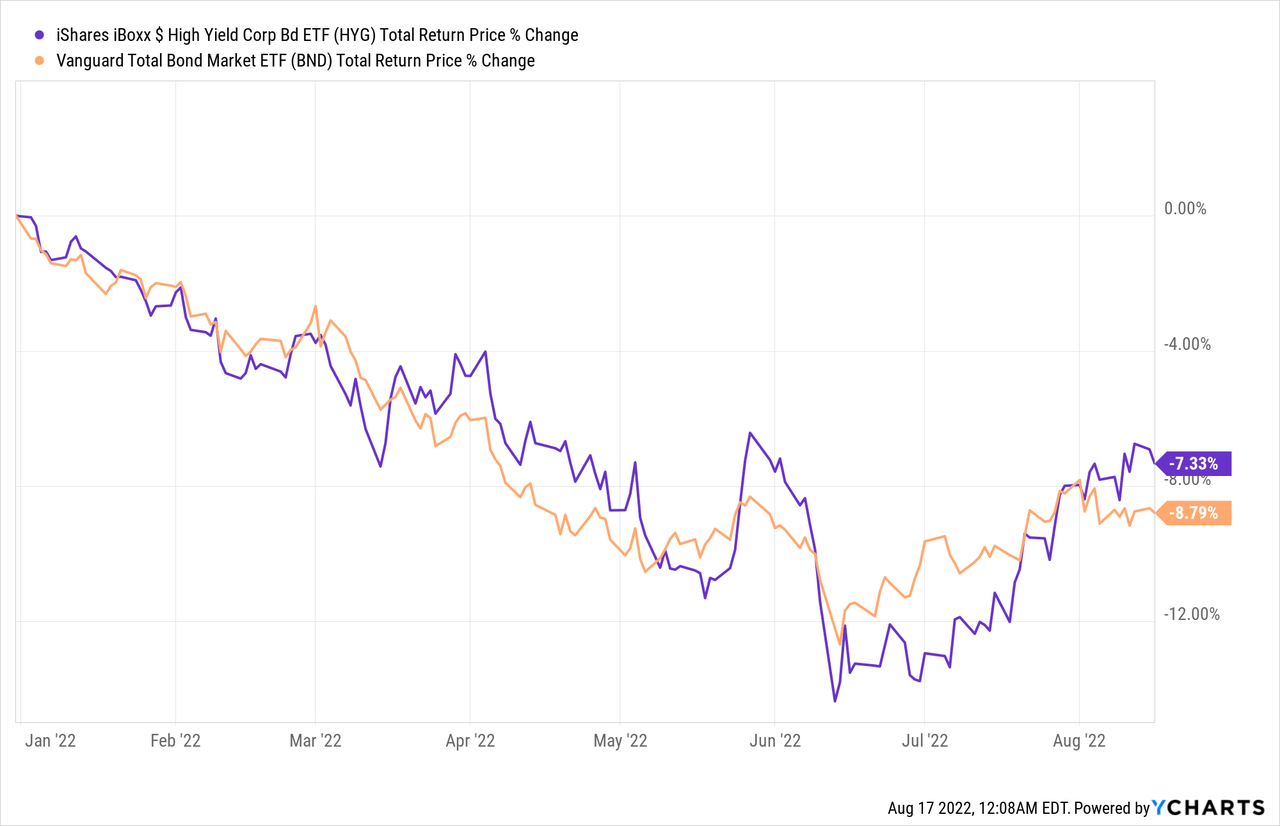
As an example, treasuries have significantly underperformed high-yield corporate bond these past few years.
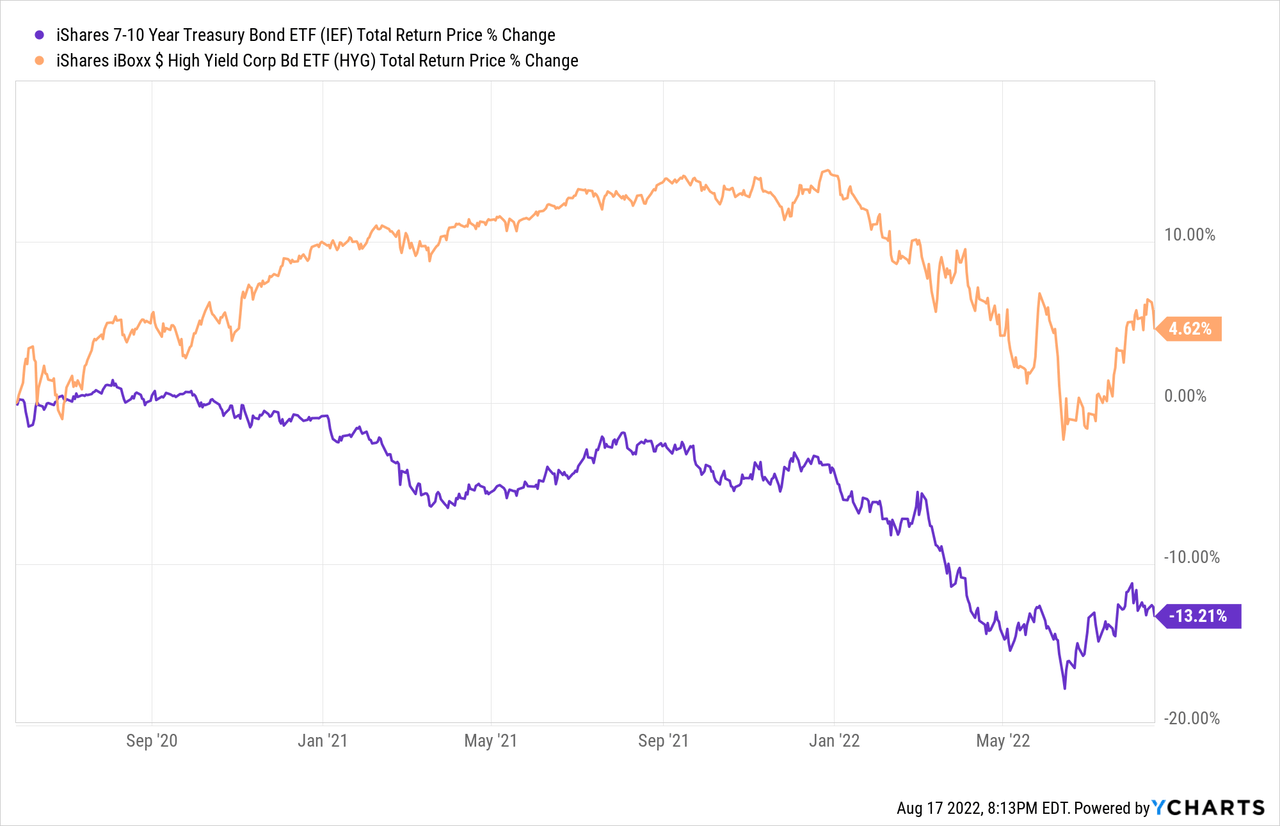
But both asset classes have suffered roughly equal losses YTD.
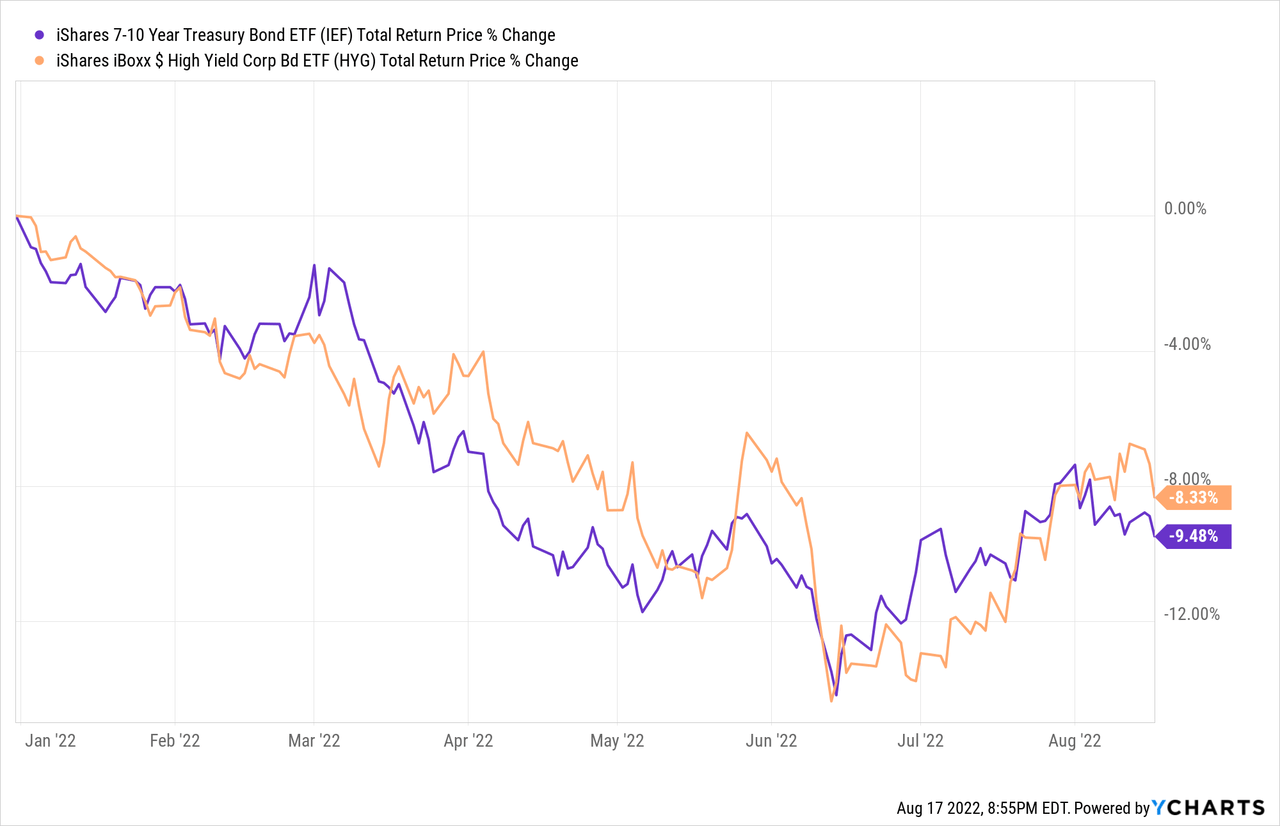
Treasuries have seen lower returns at equal risk relative to high-yield corporate bonds these past few years, a very mediocre risk-return profile. The same is true for most low-risk assets, funds, and portfolios, including my own.
Medium Risk/Yield Portfolio
The medium risk portfolio has significantly underperformed relative to its benchmark for the first half of the year, suffering losses of 24% versus 14% for VTWNX.
Biggest contributor to said losses was BHK, for the same reasons as above.
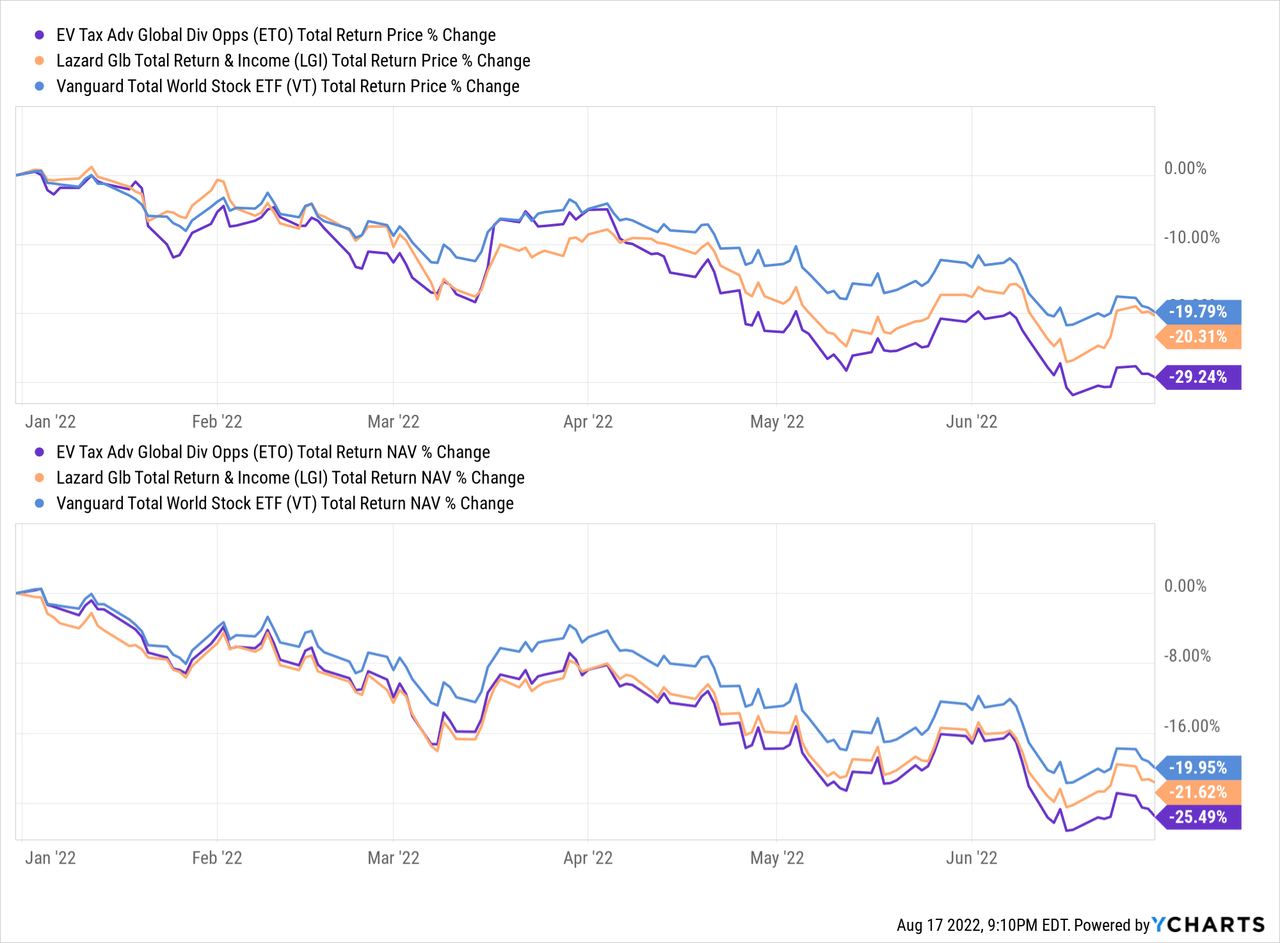
The portfolio also underperformed due to subpar performance on the part of the Eaton Vance Tax-Advantaged Global Dividend Opportunities Fund (ETO) and the Lazard Global Total Return & Income Fund (LGI), two global equity funds. These two funds underperformed due to narrowing discounts to NAV and greater exposure to underperforming European equities. LGI only slightly underperformed relative to its benchmark. ETO moderately underperformed, as the fund’s leverage boosted losses further.
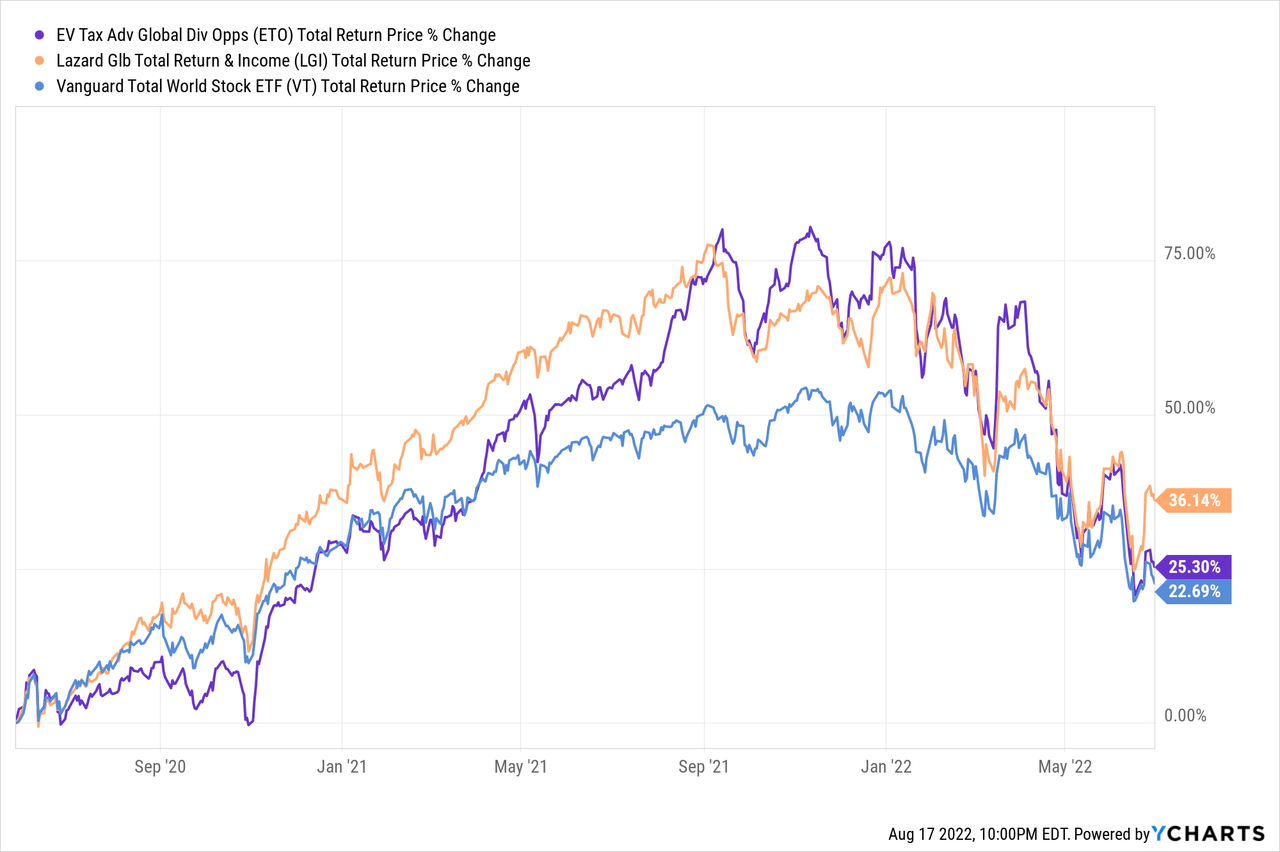
In general terms, the overall risk-return profile of the medium risk / yield portfolio is quite strong. Said portfolio has achieved annualized returns since inception more than twice that of its benchmark, 8.3% versus 3.9%. These results were partly due to underlying market conditions, as higher-risk assets have behaved in such a manner these past few years, and partly due to the strong performance of some of the selected funds. ETO and LGI, for instance, have both outperformed their benchmark since their inclusion in the portfolios.
Higher Risk/Yield Portfolio
The higher risk / yield portfolio has significantly underperformed relative to its benchmark for the first half of the year, suffering losses of 26% versus 14% for VTWNX.
Said portfolio underperformed in part due to the subpar performance of ETO and LGI, described above.
Said portfolio also underperformed due to the subpar performance of the PIMCO Dynamic Income Opportunities Fund (PDO). Underperformance was almost entirely due to widening discounts to NAV, although leverage almost certainly played a small role. The PIMCO Dynamic Income Fund (PDI) also underperformed, but much less.
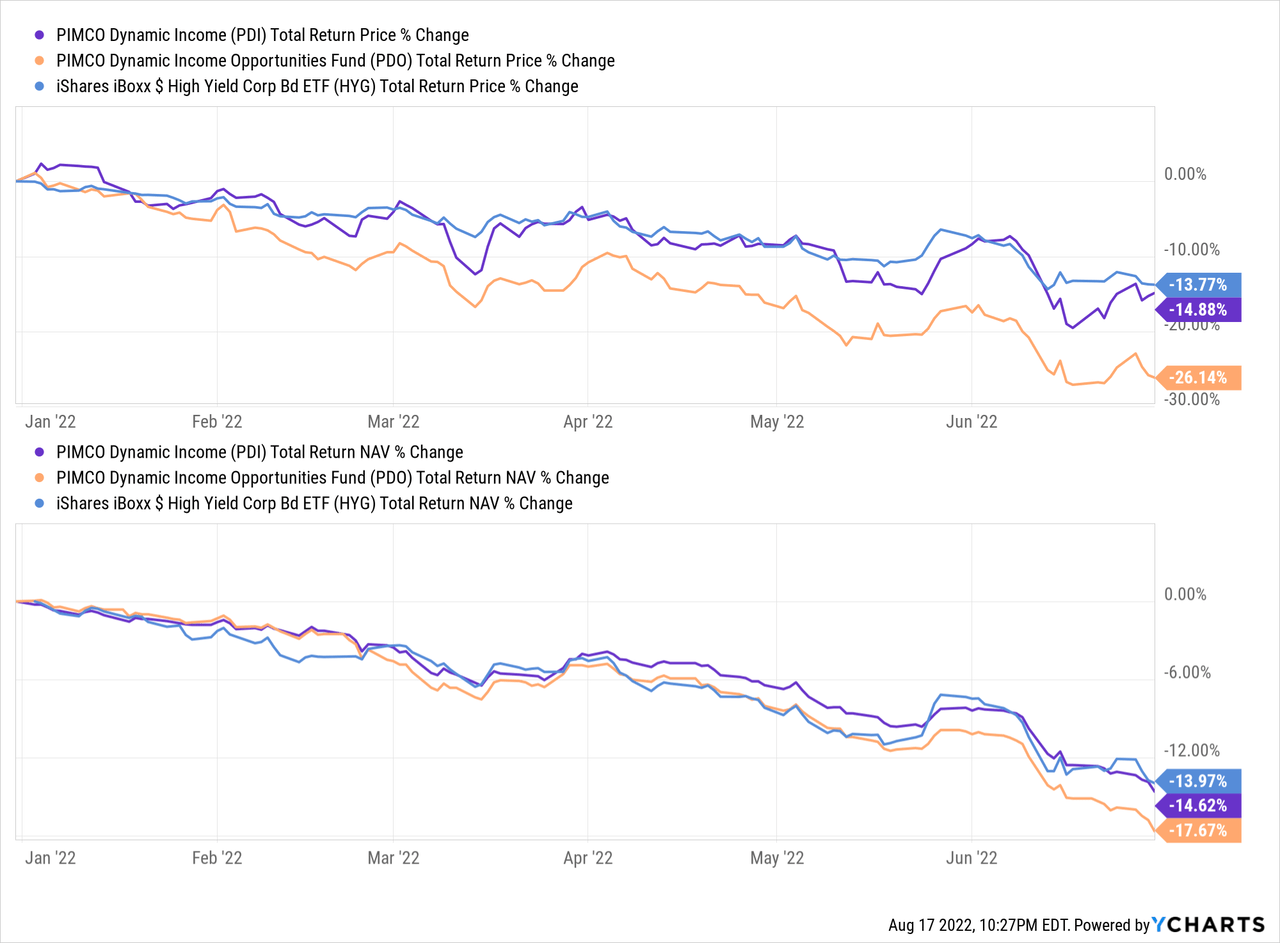
Notwithstanding the above, these PIMCO bond CEFs have mostly performed quite well. Their longer-term performance has been much stronger, recent weakness notwithstanding, and the merger last year provided an opportunity for profitable swaps.
As with the medium risk / yield portfolio, the overall risk-return profile of the higher risk / yield portfolio is quite strong. Said portfolio has achieved annualized returns since inception more than twice that of its benchmark, 9.9% versus 3.9%. Risks were materially higher as well, but losses were not disastrous, and were mostly the result of widening discounts to NAV. Income investors would mostly ignore these, which brings me to my next point.
Simple Retirement Portfolios – Quick Distribution Analysis
The Simple Retirement Portfolios are meant for retirees, and so focus on funds with strong yields. Portfolio yields are quite high, reaching 10.5%.
Seeking Alpha – Chart by author
The distribution sustainability / growth track-record of these portfolios and their underlying funds has been quite strong too. Distributions are the same or higher for all funds: there have been no dividend cuts. Some of the ETFs have seen dividend fluctuations, but dividends are mostly growing.
Although these portfolios have strong distribution yields and distribution track-records, track-records are simply too short for a meaningful analysis, especially considering recent market weakness. Distributions are sometimes cut in the months following downturns, due to declining asset values and lack of capital gains / capital losses. I see no reason to believe that this will be the case for any of these funds, but I might be proven wrong in the future.
As mentioned previously, I write regular updates on these portfolios. I’m planning one focusing on distribution yields and distribution growth once market conditions settle. Seeing how fund and portfolio distributions fare after recent market losses is key, but conditions remain far too fluid for that. Still, the situation is broadly positive, so far at least.
Conclusion
The Simple Retirement Portfolios provide retirees with a simple way to invest and save during their retirement and have all outperformed their benchmarks since inception. I believe that the funds selected and portfolios created will continue to outperform in the coming years. Hopefully, the information here was of use and interest to readers and investors.
Be the first to comment