

Torsten Asmus
Introduction
A year ago, we authored a research paper which estimated total tech exposure in the S&P 500 on September 30, 2021, to be 42% vs. the 27.6% Information Technology sector weight in the S&P 500.1 Fast forward one year and the S&P 500 is down -15.5% for the one-year period ended September 30, 2022. The decline has been led by the Information Technology sector, down 25.7%. While GICS, as reported by the S&P 500, estimates the IT sector to be 26.4% of the Index, Syntax’s more precise classification data estimates that the S&P 500 is substantially more exposed to tech with a weight of 37.5% as of the end of Q3 2022.
In this paper, we analyze which subsectors and business lines drove the decrease within our Technology Lens over the past year. We also investigate how the exposure to technology has evolved from the 1990s to today. To start, we provide a brief overview of our approach and tools we use to develop our Technology Lens.
Calculating Exposure to Technology
Most industry classification systems, such as GICS, use a single hierarchy approach to estimate sector exposures, which creates challenges including:
- Companies are assigned to a sector based on their primary line of business. Once this primary business is identified, it is treated as the only business a company is in.
- Sector and industry definitions are a one-size-fits-all solution that may not capture the nuances needed to answer specific questions about a company. For instance, there are technology companies in most sectors not only those classified under the Information Technology sector, but GICS does not provide an easy way to identify them.
- Sector and industry definitions can shift over time, and classification systems like GICS can be slow to update their breakdowns.
At Syntax, we calculate business risk and sector exposure using our Affinity Platform, which is multidimensional and addresses the issues above by:
- Capturing company data at the granular, product-line level to provide a higher level of precision than bucketing all of a company’s exposure into one primary sector.
- Accurately tagging the activities of companies and creating taxonomies or lenses to aggregate exposures of relevant groups across sectors.
- Keeping pace with industry and business line changes by using an alphanumeric tagging system that eliminates the need for broad reclassification of companies.
Technology Stocks’ Difficult Year
Total Tech exposure in the S&P 500 fell from an all-time high of 42% last year to 37.5% at the end of Q3 2022 as calculated using our Technology Lens and shown in Exhibit 1 below. The table highlights the portfolio weights and change in weights by subsectors (e.g., Software, Hardware) and industry group (e.g., Enterprise and Application Software). The two largest subsectors, Software and Hardware, fell 3.9 and 0.2 percentage points, respectively. In total, Software fell from 19.8% to 15.9% (a 19.7% decrease). Gaming, Social & Search Networks fell from 5.8% to 4.2% (a 27.6% decline), driven by the performance of Meta Platforms (META), which was down -60.0% over the year. Hardware’s weight in the S&P 500 was relatively unchanged during the year, posting a modest decline to 13.8% from 14.0%. This was driven by the performance of Apple (AAPL), which was down only 2.3% (outperforming the broad index by 13.2 percentage points) for the year. Apple represents roughly 75% of the Index’s exposure to the Computers, Phones and Consumer Electronics segment.
Exhibit 1: S&P 500 Technology Exposure Breakdown
|
Performance |
Index Weight |
Weighting |
||
|
Sep 21 – Sep 22 |
9.30.21 |
9.30.22 |
Differential |
|
|
Technology |
-25.7% |
42.2% |
37.5% |
-4.8% |
|
Software |
-31.5% |
19.8% |
15.9% |
-3.9% |
|
Enterprise and Application Software |
-23.7% |
6.5% |
5.6% |
-0.9% |
|
Web-Based Retailing and Distribution Platforms |
-36.3% |
7.7% |
6.2% |
-1.4% |
|
Gaming, Social & Search Networks |
-38.1% |
5.8% |
4.2% |
-1.6% |
|
Hardware |
-16.4% |
14.0% |
13.8% |
-0.2% |
|
Computers, Phones, and Consumer Electronics |
-2.8% |
6.1% |
6.9% |
0.8% |
|
Electronic Components |
-29.1% |
5.8% |
4.9% |
-0.8% |
|
Network Equipment and Servers |
-25.4% |
0.7% |
0.7% |
0.0% |
|
Automation, Robotics, and Industrial Hardware |
-23.2% |
1.1% |
1.0% |
-0.1% |
|
Electronic Systems for Transportation |
-33.4% |
0.5% |
0.5% |
-0.1% |
|
Defense and Surveillance Tech |
-5.2% |
0.3% |
0.4% |
0.1% |
|
Commercial and Office Hardware |
-23.3% |
0.2% |
0.1% |
-0.1% |
|
Financial Technology and Payments |
-27.0% |
4.1% |
3.6% |
-0.6% |
|
Internet Infrastructure |
-18.0% |
3.6% |
3.7% |
0.1% |
|
IT Services |
-17.9% |
1.1% |
0.9% |
-0.2% |
|
S&P 500 |
-15.5% |
|||
Source: S&P Dow Jones Indices, Syntax Affinity. Affinity group weight totals may differ from the sum of lower-level groups due to elimination of double-counting product lines that provide exposure to more than one lower-level group.
Evolution of Technology over Time
To analyze how the S&P 500’s exposure to Technology has evolved over time, we have broken the past 30 years into three data segments:
- 1992 through year-end 1999 covers the since inception date of our data through the end of the decade, which closely corresponds to the peak of the Tech Bubble.
- 2000 through year-end 2009 covers the first decade of this century and includes the impact of both the Tech Bubble collapse and the Global Financial Crisis bear markets.
- 2010 through September 2022 covers approximately the past thirteen years, which has been a bull market for tech stocks up until the last year.
Our framework is to analyze the S&P 500’s overall exposure to technology from a broad perspective while also drilling down into the underlying business groups found in Hardware and Software, the two largest segments of the Tech sector.
1992 to 1999: Height of the Tech Bubble
It is hard to believe, but at the start of 1992, technology exposure in the S&P 500 was just 9%. From this humble beginning, it grew to 30% by the end of the decade, as shown in Exhibit 2.
Exhibit 2: S&P 500 Technology Exposure from 1992 through 1999
|
Weight as a % of S&P 500 |
Weight as a % of Technology |
|||||||
|
Subsector |
Start |
End |
Min |
Max |
Start |
End |
Min |
Max |
|
Software |
1.3% |
7.3% |
1.1% |
7.3% |
15.2% |
24.2% |
12.4% |
24.2% |
|
IT Services |
1.6% |
3.4% |
1.1% |
3.4% |
18.0% |
11.1% |
11.1% |
20.1% |
|
Fintech & Payments |
0.5% |
0.9% |
0.4% |
0.9% |
5.3% |
2.9% |
2.9% |
6.5% |
|
Internet Infrastructure |
0.0% |
0.0% |
0.0% |
0.1% |
0.5% |
0.0% |
0.0% |
0.6% |
|
Hardware |
5.4% |
18.7% |
5.0% |
18.7% |
60.9% |
61.8% |
58.8% |
68.4% |
|
Totals |
8.8% |
30.3% |
8.3% |
30.3% |
||||
Source: Syntax Affinity
The dominant sub-sector within Technology was Hardware at approximately 60% at the start and end of this period. Software started at 15% of the tech exposure and rose to 24% at the end of the decade. Exhibit 3 shows how the tech exposure in the S&P 500 doubled from about 15% at year-end 1997 to 30% at year-end 1999. The five largest tech stocks at the end of the decade were Microsoft (MSFT) (4.9%), Cisco Systems (CSCO) (2.9%), Intel (INTC) (2.4%), Lucent Technologies (1.9%) and IBM (1.6%). They totaled 13.7% of the S&P 500.
Exhibit 3: Technology Exposure as a % of the S&P 500 (1992 through 1999)
Syntax Affinity
Exhibit 4 highlights within Hardware at the end of 1999, Network Equipment & Servers was the dominant segment making up 8.5% of the Index weight or 45% of the total Hardware subsector, followed by Computers, Phones & Consumer Electronics at 3.7% and 20%, respectively.
Exhibit 4: Hardware Exposure as a % of the S&P 500 (1992 through 1999)
Syntax Affinity
Within Software, this space consists almost entirely of Enterprise and Application Software, as shown in Exhibit 5. Gaming, Social and Search Networks at the end of the decade was just 1% of the S&P 500.
Exhibit 5: Software Exposure as a % of the S&P 500 (1992 through 1999)
Syntax Affinity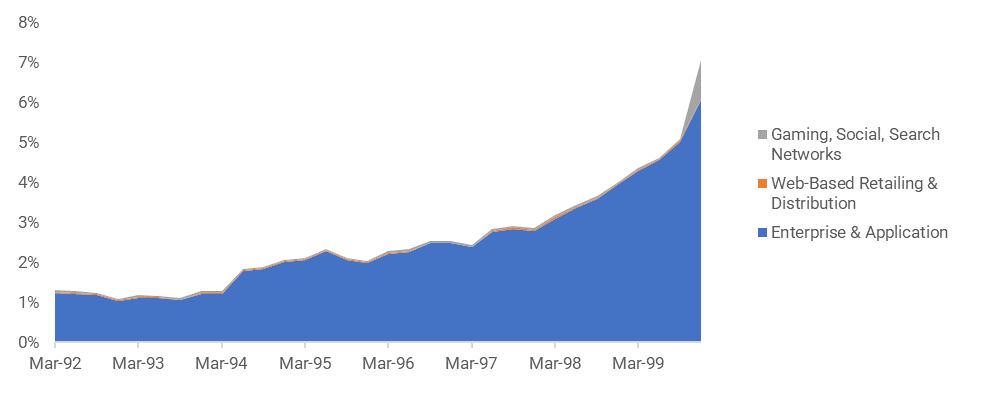
2000 to 2009: Collapse of Tech to Through Financial Crisis
The Tech Bubble collapse started in March of 2000 and led to tech exposure in the S&P 500 falling from 30% at the start of 2000 to 16% in September of 2002, before rising to 23% at the end of the decade. Over this period, Software declined from 7.3% to 6.6%, while Hardware decreased meaningfully from 18.7% to 11.3%.
Exhibit 6: S&P 500 Technology Exposure Table (2000 through 2009)
|
As a % of S&P 500 |
As a % of Technology |
|||||||
|
Subsector |
Start |
End |
Min |
Max |
Start |
End |
Min |
Max |
|
Software |
7.3% |
6.6% |
4.0% |
6.6% |
21.2% |
28.8% |
22.0% |
28.8% |
|
IT Services |
3.4% |
2.8% |
1.9% |
2.8% |
11.4% |
12.2% |
10.9% |
14.3% |
|
Fintech & Payments |
0.9% |
2.1% |
0.8% |
2.1% |
2.4% |
9.1% |
5.0% |
9.1% |
|
Internet Infrastructure |
0.0% |
0.1% |
0.0% |
0.1% |
0.0% |
0.6% |
0.1% |
0.8% |
|
Hardware |
18.7% |
11.3% |
8.5% |
11.9% |
65.0% |
49.3% |
49.3% |
60.7% |
|
Totals |
30.3% |
23.0% |
16.0% |
33.9% |
||||
Source: Syntax Affinity
Hardware’s dominance began to fade in this decade, with a particularly dramatic decline between 2000 and 2002, as shown in Exhibit 7.
Exhibit 7: Technology Exposure as a % of the S&P 500 (2000 through 2009)
Syntax Affinity
Exhibit 8 shows the decline in Hardware, driven by the fall of the Network Equipment & Servers segment. By the end of the decade, it is surpassed by both Electronic Components and Computers, Phones & Consumer Electronics, which ended the decade at 3.9% and 3.2% of the S&P 500, and 34% and 27% of the Hardware subsector, respectively. At the end of 2009, the five largest tech stocks were Microsoft (2.4%), Apple (1.9%), IBM (1.7%), Alphabet (GOOG, GOOGL) (1.5%) and Cisco Systems (1.4), totaling 8.9% of the S&P 500.
Exhibit 8: Hardware Exposure as a % of the S&P 500 (2000 through 2009)
Syntax Affinity
Within Software, Enterprise and Application Software started the decade at 6.1% of the S&P 500 and ended the decade at 3.7%; its percentage of software exposure decreased from 86% to 60% (Exhibit 9). Web-Based Retail and Distribution software increased over the decade from less than 0.1% to 0.5% and took off in the next decade. Gaming, Social and Search Networks grew from 1.2% of the Index to 1.6%, increasing its percentage of software exposure from 13% to 28%.
Exhibit 9: Software Weight as a % of the S&P 500 (2000 through 2009)
Syntax Affinity
2010 to September 2022: Post Financial Crisis – Present
At the beginning of 2010, S&P 500’s total tech exposure was 23% and had risen to 37.5% as of September 30, 2022. Total exposure peaked at 42% in 2021.
The largest contributor to this growth was Software, which rose from 6.6% to 15.9% of the Index to become 43% of the total tech exposure. Internet Infrastructure, which includes cloud computing and datacenters, rose from 0.1% to 3.7%. Hardware also increased from 11.3% to 13.8%, but its percentage within Technology declined from 50% to 37%. Fintech & Payments also increase from 2.1% to 3.6%, with its proportion of the tech exposure increasing slightly from 9% to 10%. Details are illustrated in Exhibit 10.
Exhibit 10: S&P 500 Technology Exposure (2010 through September 2022)
|
Weight as a % of S&P 500 |
Weight as a % of Technology |
|||||||
|
Subsector |
Start |
End |
Min |
Max |
Start |
End |
Min |
Max |
|
Software |
6.6% |
15.9% |
5.8% |
19.7% |
15.8% |
42.6% |
26.7% |
47.0% |
|
IT Services |
2.8% |
0.9% |
0.9% |
2.7% |
11.9% |
2.4% |
2.4% |
12.1% |
|
Fintech & Payments |
2.1% |
3.6% |
1.8% |
4.8% |
9.0% |
9.5% |
8.1% |
13.7% |
|
Internet Infrastructure |
0.1% |
3.7% |
0.1% |
3.6% |
0.6% |
8.3% |
0.5% |
8.4% |
|
Hardware |
11.3% |
13.8% |
9.7% |
16.6% |
50.3% |
37.2% |
33.5% |
51.8% |
|
Total |
23.0% |
37.5% |
21.0% |
42.3% |
||||
Source: Syntax Affinity
Exhibit 11 shows the steady growth of Software over this time, with some tailing off over the past year. Fintech & Payments had a notable increase, from 2.1% to 3.6% of the Index, while IT Services fell to less than 1% of the Index and 2% of the total tech exposure.
Exhibit 11: Technology Exposure as a % of the S&P 500 (2010 through September 2022)
Syntax Affinity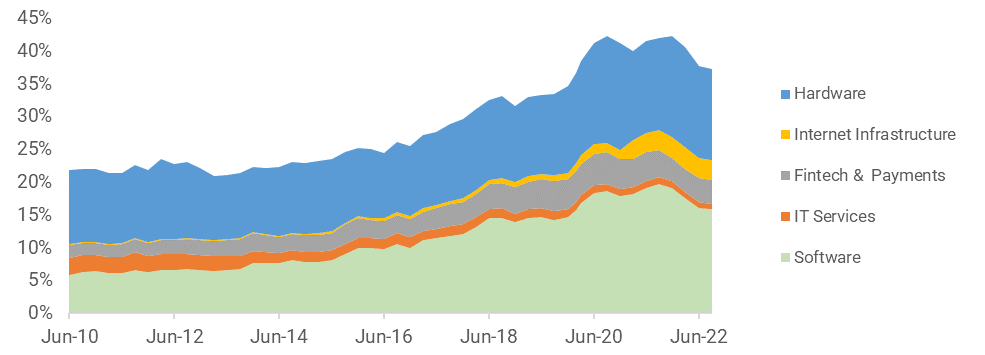
Exhibit 12 shows within Hardware, the Network Equipment & Servers segment has continued its decline, while Computers, Phones & Consumer Electronics and Electric Components (primarily computer chip manufacturers and makers of semiconductor equipment) increased to 6.9% and 4.9% respectively as of September 30, 2022. Together, they make up approximately 80% of the Hardware segment.
Exhibit 12: Hardware Exposure as a % of the S&P 500 (2010 through 2022)
Syntax Affinity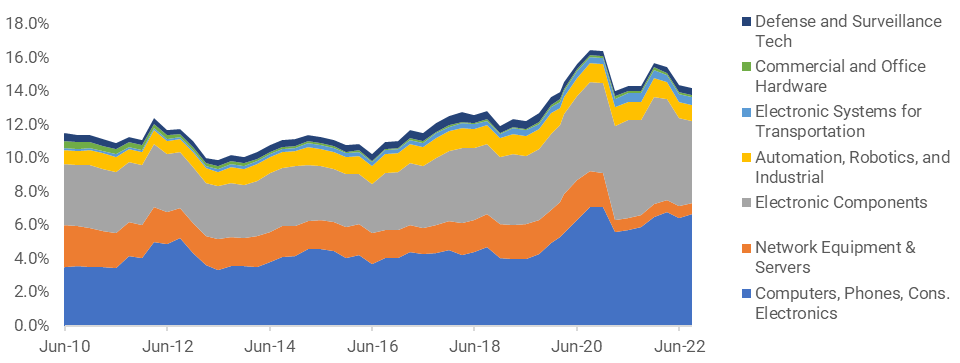
The Software space saw the most dramatic change. Web-Based Retailing & Distribution started the period at 0.7% of the S&P 500 and ended the period at 6.2%, higher than the 5.6% weight of the once-dominant Enterprise and Application Software category. Gaming, Social & Search ended the period at 4.2% of the S&P 500, down from a peak of 6.0% in 2018.
Exhibit 13: Software Exposure as a % of the S&P 500 (2010 through Sept. 2022)
Syntax Affinity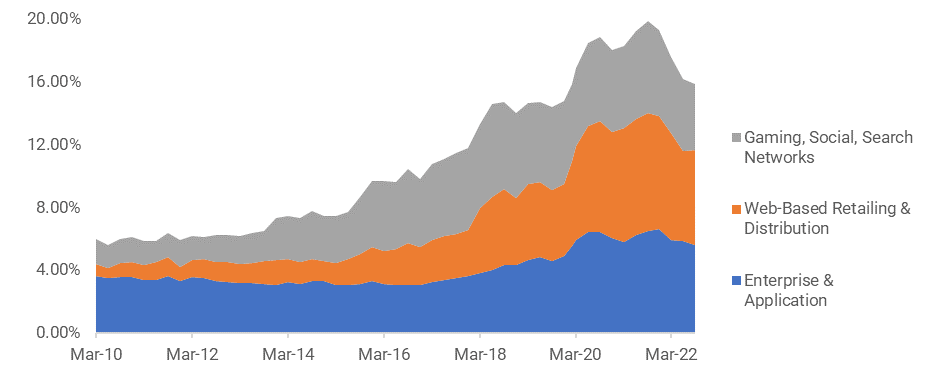
Summary
Our Technology Lens for the S&P 500 has 21 distinct business lines which we have ranked in descending order based on their portfolio weight in Exhibit 14. To provide a sense of how technology has evolved, we have also provided each business line’s weight as of December 31, 1999, which was a few months prior to the peak of the Tech Bubble.
Exhibit 14: S&P 500 Tech Exposure by Business Line (as of 30 September 2022)
|
Sub-Sector |
Business Lines |
9.30.2022 Weight |
Cum. Contr. To Tech Exposure |
12.31.99 Weight |
|
Hardware |
Computers and Consumer Electronics |
6.6% |
17.6% |
3.7% |
|
Software |
Web-Based Retail and Distribution Platforms |
6.1% |
33.8% |
0.0% |
|
Software |
Enterprise and Application Software |
5.6% |
48.8% |
6.1% |
|
Hardware |
Integrated Circuits |
3.7% |
58.5% |
4.7% |
|
Fintech & Payments |
Payments |
3.1% |
66.8% |
0.9% |
|
Software |
Search Networks |
2.7% |
74.0% |
1.0% |
|
Internet Infrastructure |
Cloud Services |
2.5% |
80.6% |
0.0% |
|
Software |
Social Networks |
1.4% |
84.4% |
0.0% |
|
Hardware |
Automation, Robotics, and Industrial Hardware |
1.0% |
87.0% |
0.5% |
|
Hardware |
Semiconductor Manufacturing |
0.9% |
89.4% |
0.5% |
|
IT Services |
IT Services |
0.9% |
91.7% |
3.4% |
|
Hardware |
Network Equipment & Servers |
0.7% |
93.5% |
8.5% |
|
Hardware |
Electronic Systems for Transportation |
0.5% |
94.8% |
0.1% |
|
Internet Infrastructure |
Datacenter, Network, and Colocation Services |
0.5% |
96.2% |
0.0% |
|
Fintech & Payments |
Investment |
0.4% |
97.3% |
0.0% |
|
Hardware |
Defense and Surveillance Tech |
0.4% |
98.3% |
0.1% |
|
Software |
Gaming |
0.3% |
99.1% |
0.0% |
|
Hardware |
Memory Devices |
0.2% |
99.8% |
0.3% |
|
Hardware |
Commercial and Office Hardware |
0.1% |
100.0% |
0.4% |
|
Fintech & Payments |
Blockchain and Cryptocurrency |
0.0% |
100.0% |
0.0% |
|
Hardware |
Electronic Displays |
0.0% |
100.0% |
0.4% |
|
Total |
37.5% |
30.3% |
Source: Syntax Affinity. Cumulative contribution to Technology exposure shows the cumulative contribution of each group to the overall Technology exposure of the portfolio as a percent of total Technology exposure.
Some interesting observations and takeaways include:
- The largest business line as of December 31, 1999 was Network Equipment and Servers at 8.5%. Today, its weight is merely 0.6% of the S&P 500.
- Categories representing 11% of the S&P 500 today, which includes Web-Based Retailing and Distribution, Cloud Services, Datacenters, Gaming, Blockchain and Cryptocurrency, all represented 0% of the S&P 500 as December 31, 1999.
- At the start of 2000, Hardware categories represented 65% of the S&P 500’s tech exposure relative to 37% today.
- Software totals 43% of the S&P 500’s total tech exposure today, with the second- and third-largest tech business lines being Web-based Retailing and Distribution Platforms at 6.1% and Enterprise and Application Software at 5.6%.
- The top five business lines represent over 70% of the tech exposure in the S&P 500 today.
Technology stocks soared in the 1990s, before declining over the next decade in the aftermath of the Tech Bubble collapse and reigniting in 2015 through 2021. Over the past year, however, technology stocks have led the market’s downward trajectory. This paper has highlighted that tech exposure has become increasingly concentrated in the top four stocks (Apple, Microsoft, Alphabet and Amazon (AMZN)) and in the top five business lines (Computers and Consumer Electronics, Web-Based Retail and Distribution Platforms, Enterprise and Application Software, Integrated Circuits, Payments). Passive investors in the S&P 500 have benefitted from this trend, but as history has shown, concentration risks can cut both ways and present levels of tech exposure that are still greater than those during the peak of the Tech Bubble.
How much exposure should you have to tech in your portfolio? That is a question individual investors need to decide for themselves. Our goal, through our Affinity Platform, is to enable investors to assess the business risks more precisely in their portfolios to answer these types of questions. We believe having a more complete understanding of what you own leads to better decision-making and more diversified portfolios.
_____________
Original Source: Author
Be the first to comment