


eyenigelen/E+ via Getty Images
Investment Summary
Since our previous assessment of Avanos Medical, Inc. (NYSE:AVNS), where we compared the company’s acquisition of the TriVisc portfolio to the offering of Bioventus, Inc (BVS), we’ve noticed several factors that have drifted to the upside. Most notably, the stock has rallied alongside broad equity markets since October, whilst equity beta has reverted to previous levels.
Following its latest set of numbers, we’re back here today to revise our position on AVNS from a hold to a buy, noting the divisional strengths across AVNS’ product portfolio, valuations and also improving market data. We also revise our price objective to $44.90, otherwise 29.2x forward P/E. With the S&P 500 forward P/E estimate at ~17.5x, we therefore expect AVNS to outperform the benchmark in the coming 3-6 months. Rate buy, price objective $44.90.
AVNS 2022 price evolution with corresponding equity beta to S&P 500
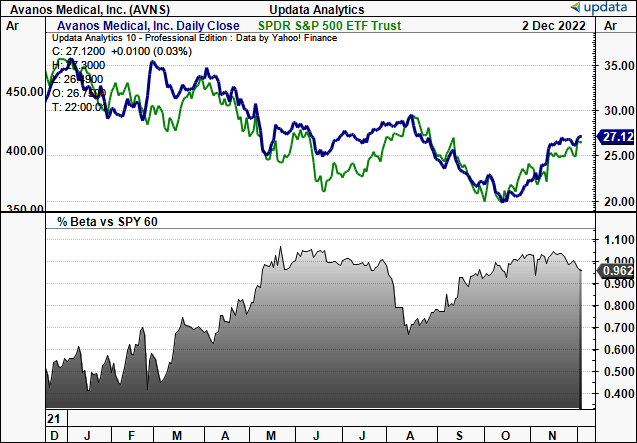
Data: Updata
Q3 financial results analysis
Turning to the third quarter, it was a period of growth for AVNS vertically down the P&L. Management said that OrthogenRx posted another strong quarter and is exceeding expectations. This is underpinned by adoption of the 3-injection hyaluronic acid regime, TriVisc. We talked about this at length in our previous analysis.
As a reminder, TriVisc is a brand name for a type of hyaluronic acid (“HA”) injection used to treat pain and inflammation associated with osteoarthritis (“OA”). The 3–injection protocol, also known as a “multi–injection series“, involves three injections of HA, spaced out over a series of weeks. For those unfamiliar, HA coats the articular cartilage within our joints, acting as a lubricant. In OA, its production is limited. Hence, the multi-injection series protocol is used to increase the effectiveness of the treatment and helps to improve the symptom relief in the majority of patients who receive it.
Switching to the numbers, we saw that revenue for the quarter was $202mm, up 9.8% compared to last year. Upsides were seen across the product portfolio, with 11% YoY growth in the digestive health business, and NeoMed up ~39%. However, the respiratory segment declined by ~24% YoY as Covid-related sales diminished from the same time last year.
It’s also worth noting the substantial uplift in AVNS’ operating income, fetching $27mm for Q3 compared to $17mm in the prior year. This represents YoY growth of ~58.8%, helped by greater revenue and gross margin. It pulled this down to adjusted net income of $18mm, or adjusted diluted EPS of $0.38, compared to $12mm a year ago.
Noteworthy, it also realized a $23mm quarterly free cash inflow last period. Free cash inflows are now a cumulative $80mm for the YTD. You can see a detailed look at AVNS’ quarterly operating walk-through from FY16–date in Exhibit 1. Meanwhile, a look at the company’s free cash flows and corresponding return on capital is seen in Exhibit 2. Note the directional relationship between the pair – to us, this signals that FCF is being invested wisely and generating ~2.5% trailing return on capital.
Exhibit 1. AVNS quarterly operating walk-through: Revenue, core EBITDA and FCF yield.
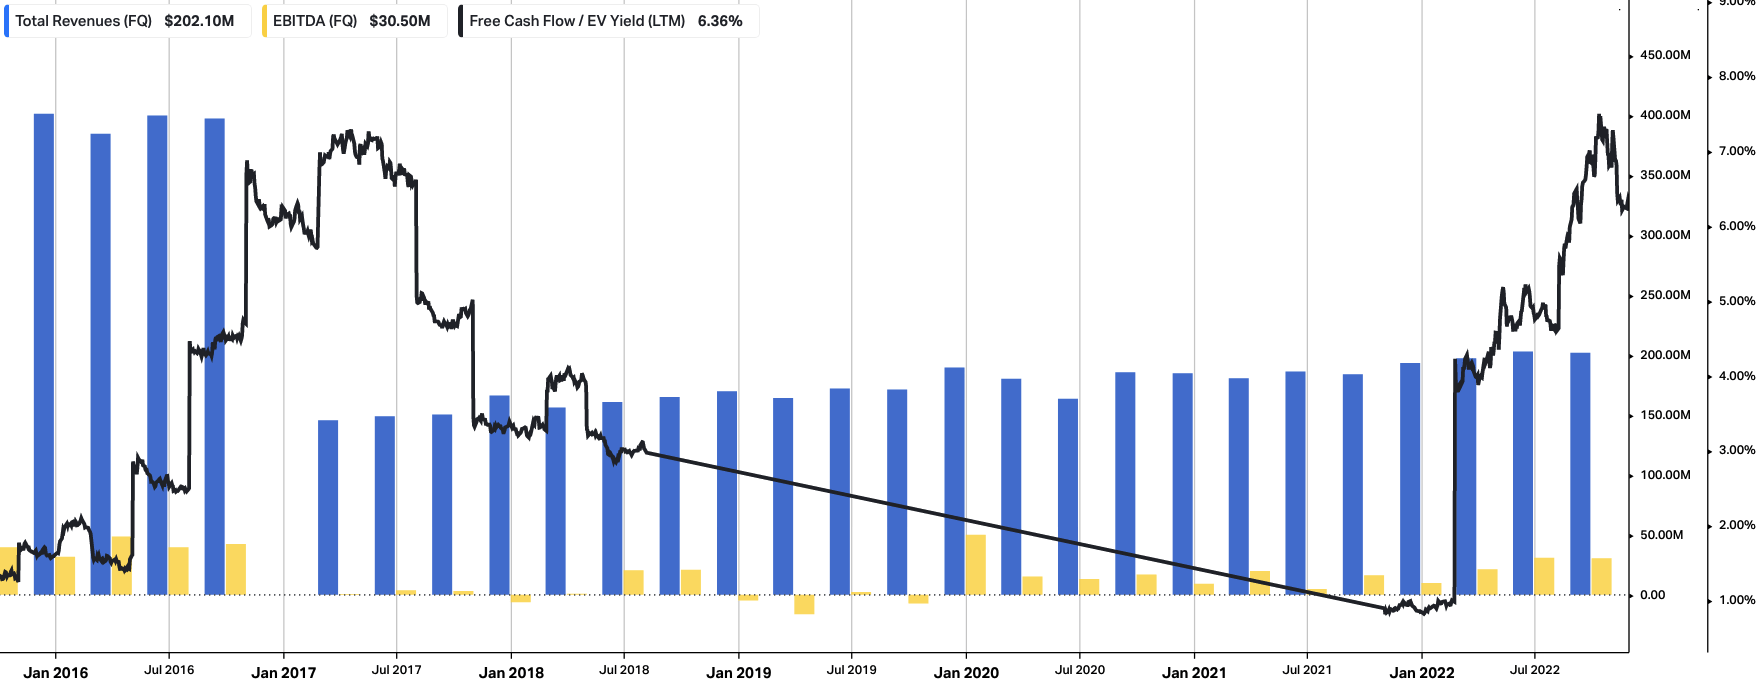
Data: HBI, Refinitiv Eikon, Koyfin
Exhibit 2. FCF and Return on capital showing directional relationship to the upside. As one lifts up, the other ratchets higher alongside it.
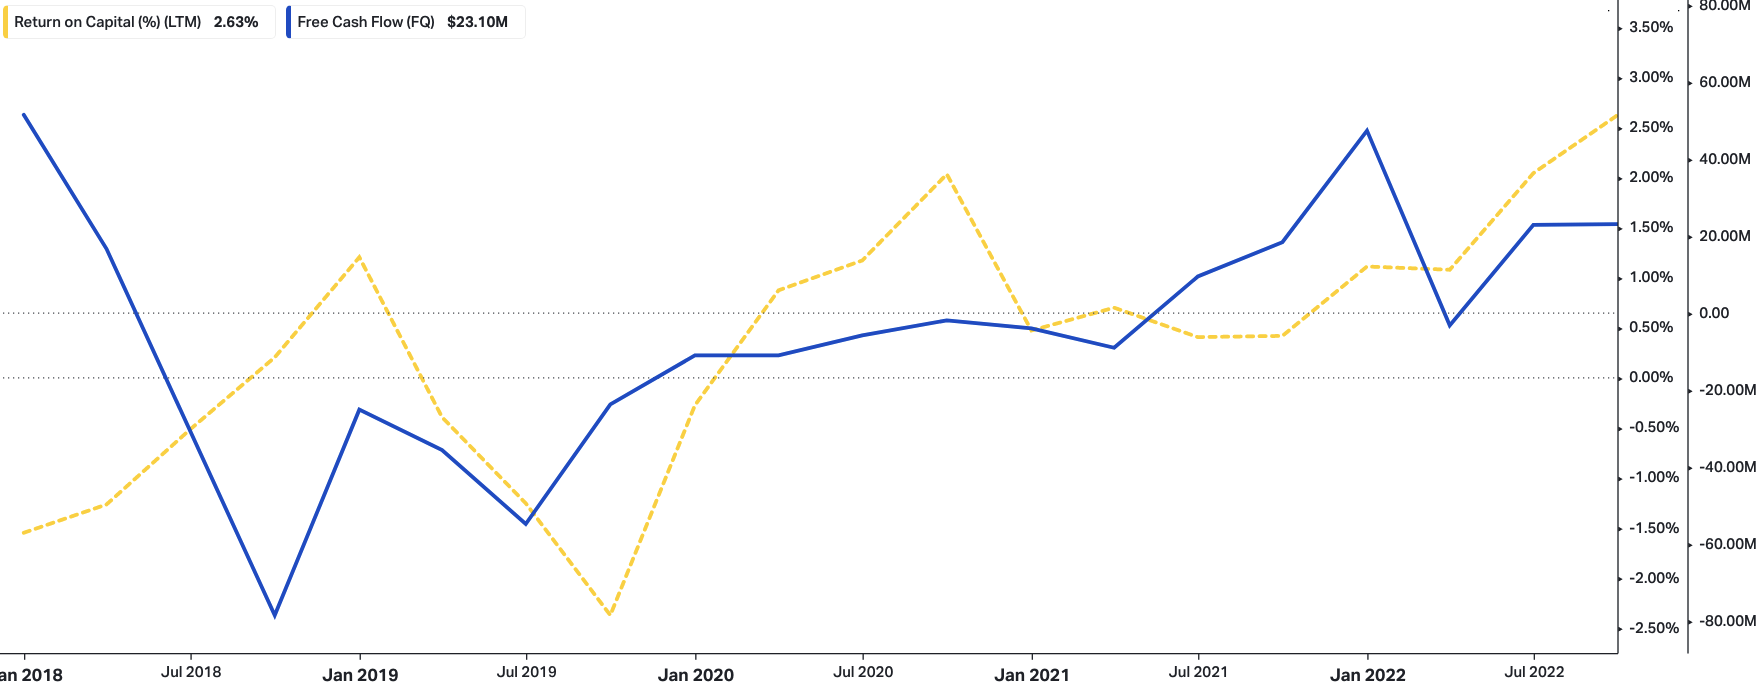
Data: HBI, Refinitiv Eikon, Koyfin
Turning to the divisional highlights, there were many across the product portfolio. Our takeaways are as follows:
- Turnover in the chronic care segment narrowed by ~$1mm YoY to $116mm. This excludes the prior year impact of sales coming from the exited Maxter facility.
- It’s also worth pointing out that the digestive Health business had third quarter growth of 11% [14% in constant currency terms]. Growth was underpinned by upsides in NeoMed sales, that grew over 39% YoY globally. As a reminder, NeoMed is AVN’s neonatal intensive care unit (“NICU”) portfolio. Management reported particularly strong uptake of the ENFit technology.
- Meanwhile, we saw the respiratory health business experienced a 24% contraction in the third quarter. Although, as previously mentioned, this was expected with the wind-down in worldwide Covid-19 cases.
- We’d also mention that the pain management sales were ~$1mm down at $66 million of actual sales. This excludes any contribution from OrthogenRx. The decrease was primarily driven by supply chain difficulties related to raw material shortages. Specifically, the interventional pain side of the business saw 300bps reported growth in the quarter, whereas acute pain declined by over 4%.
- Looking down the P&L, we’d note gross margin improved more than 420bps YoY to 56.3% on adjusted EBITDA of $33 million, up from $22 million last year. Operating margin was 13% for the quarter, well up from the 1.85% last year.
Reaffirmed guidance adds to buy thesis
Management also reinstated its previous FY22 guidance, which adds to our thesis. It now expects total net sales between $815–$835mm. Gross margins are expected to be between 55%–57%, and it aims for OpEx to remain below 40% as a percentage of revenue. Meanwhile, we note it forecasts adjusted diluted earnings per share of $1.45–$1.65.
Management also indicated that there are industry–wide post–COVID headwinds, supply chain disruptions, and raw material shortages that could adversely impact the company‘s ability to meet its revenue, gross margin and earnings per share objectives.
We are within management’s scope of earnings forecasts, as you can see below [Exhibit 3]. Our growth assumptions call for $1.54 in EPS for FY22, otherwise a 34% YoY growth, stretching up to $1.70 the year after. We also see a sustained period of sequential EPS growth over the coming 4 quarters.
Exhibit 3. FY22–FY24′ EPS growth assumptions for AVNS
These are internal estimates, showing quarterly and annual forecasts.
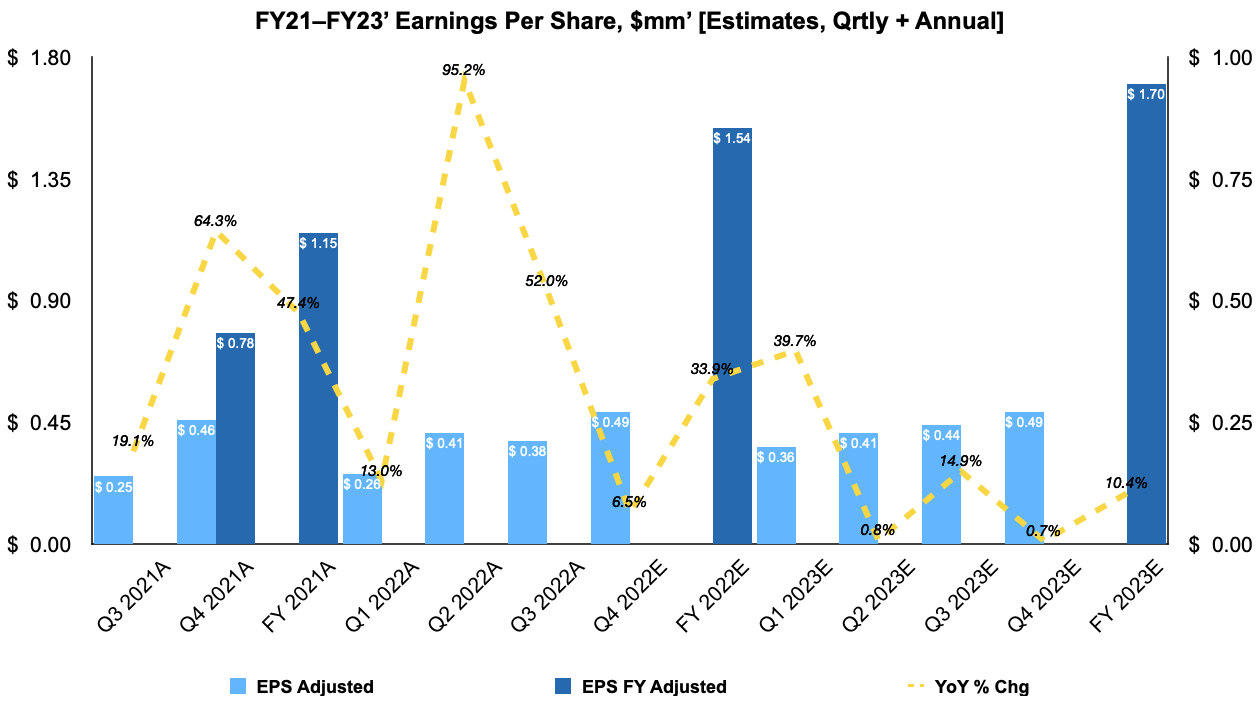
Data: HBI Estimates
AVNS technicals also a bullish factor
In our estimation technical studies on AVNS’ price action also adds a bullish weight to the risk/reward symmetry. You can see the stock has caught a strong bid after bouncing hard off lows in October.
As the same time, it’s now crossed back above the 50DMA and 250DMA. It’s now back testing its longer resistance level.
Despite the latest uptick, there doesn’t appear to be the supportive volume to suggest the accumulation from large or institutional investment accounts.
Zooming out from the October 2022 rally, we see the stock hit a triple top from late 2021 to early 2022. We’d estimate this to be a key zone of resistance for AVNS, should it rally back to these levels anytime soon.
Exhibit 4. AVNS 18-month weekly price action with volume [weekly bars, log scale]
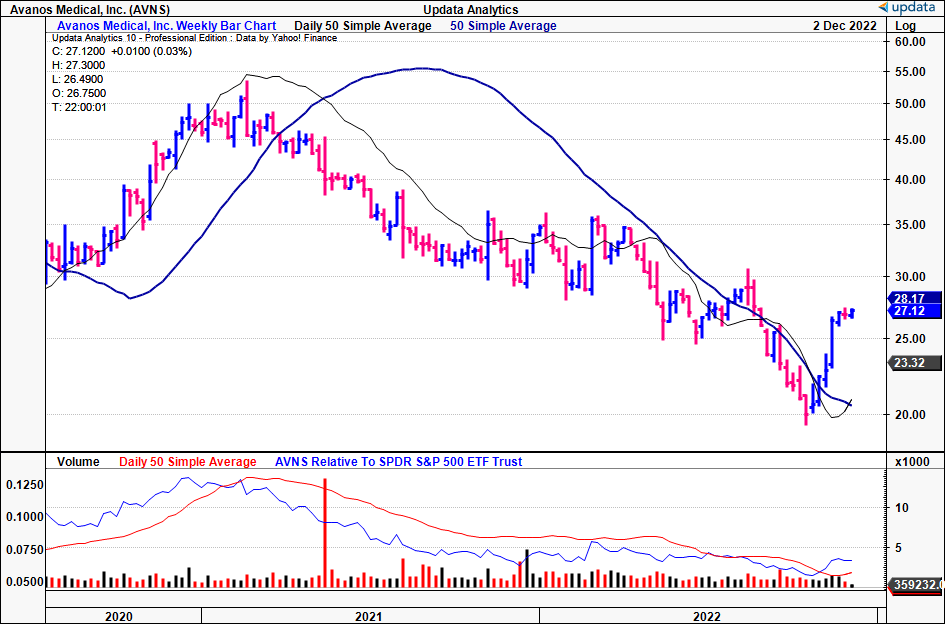
Data: Updata
In saying that, shares have punched above the cloud, with the lag line poking its head above the neckline of the cloud as well. At the same time, on balance volume (“OBV”) has reversed off its lows with momentum studies, helping to confirm the validity and direction of the rally from October.
The cloud itself is blue and widening, suggesting there could be more upside to come in the short to medium term.
Exhibit 5. Trading above cloud support
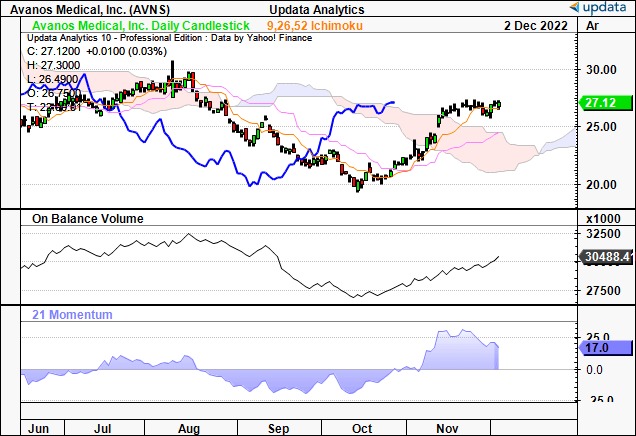
Data”: Updata
Valuation and conclusion
Last time, we had set a valuation of $32 for AVNS, based on a 21x forward P/E multiple. It’s worth noting that consensus values the stock at 17.7–25.6x forward earnings, depending on non-GAAP–GAAP estimates respectively.
We believe this is underestimating the growth potential of the AVNS’ bottom line and also its divisional strengths.
As such, we estimate is should trade up ~29.2x forward earnings. Rolling our FY22 EPS estimates forward to this multiple derives a price target of $44.90, a revision of 40% to the upside from our previous target. This confirms our buy thesis.
Exhibit 6. Fair forward P/E of 29.2 x 1.54 = $40.90
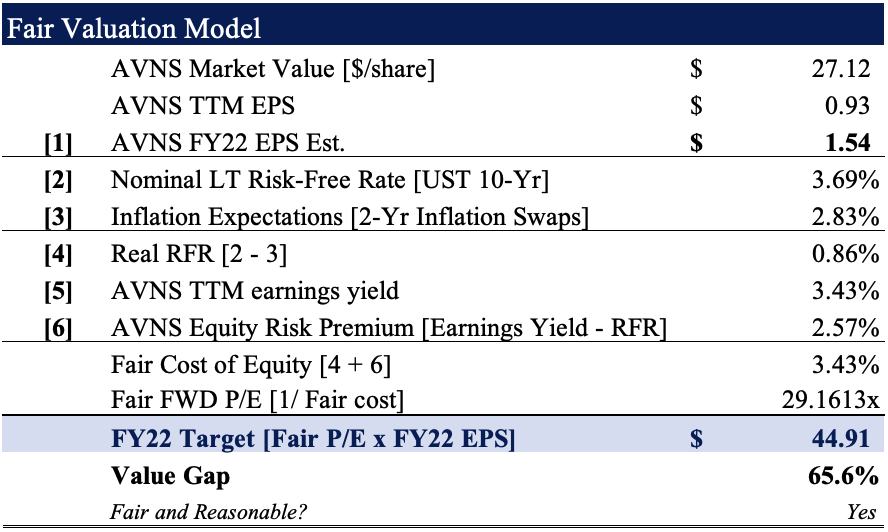
Note: Fair forward price-earnings multiple calculated as 1/fair cost of equity. This is known as the ‘steady state’ P/E. For more and literature see: [M. Mauboussin, D. Callahan, (2014): What Does a Price-Earnings Multiple Mean?; An Analytical Bridge between P/Es and Solid Economics, Credit Suisse Global Financial Strategies, January 29 2014] (Data: HBI Estimates)
Net-net, we revise our rating on AVNS to a buy, citing financial strengths and our fair value estimate of $44.90. This is a revision to the upside from previous analysis. Nevertheless, there are risks that must be considered, including the fact that AVNS might not hit its guidance ranges in FY22, and that OrthogenRx turnover may disappoint into the coming periods as well.
Be the first to comment