

Sezeryadigar/E+ via Getty Images
Background
For those who are interested in John and Jane’s full background, please click the following link here for the last time I published their full story. The details below are updated for 2022.
- This is a real portfolio with actual shares being traded.
- I am not a financial advisor and merely provide guidance based on a relationship that goes back several years.
- John retired in January 2018 and now only collects Social Security income as his regular source of income.
- Jane officially retired at the beginning of 2021, and she is collecting Social Security as her only regular source of income.
- John and Jane have decided to start taking draws from the Taxable Account and John’s Traditional IRA to the tune of $1,000/month each. These draws are currently covered in full by the dividends generated in each account.
- John and Jane have other investments outside of what I manage. These investments primarily consist of minimal risk bonds and low-yield certificates.
- John and Jane have no debt and no monthly payments other than basic recurring bills such as water, power, property taxes, etc.
The reason why I started helping John and Jane with their retirement accounts is that I was infuriated by the fees they were being charged by their previous financial advisor. I do not charge John and Jane for anything that I do, and all I have asked of them is that they allow me to write about their portfolio anonymously in order to help spread knowledge and to make me a better investor in the process.
Generating a stable and growing dividend income is the primary focus of this portfolio, and capital appreciation is the least important characteristic. My primary goal was to give John and Jane as much certainty in their retirement as I possibly can because this has been a constant point of stress over the last decade.
Dividend Decreases
No stocks in Jane’s Traditional or Roth IRA paid a decreased dividend during the month of February.
Dividend And Distribution Increases
Four companies paid increased dividends/distributions or a special dividend during the month of February in the Traditional and Roth IRAs.
AbbVie – When it comes to investing in the medical industry I normally resort to using closed-ended or diversified funds as a way to diversify risk because I have found that investing in pharmaceutical companies requires a great deal of knowledge (there are many excellent writers on Seeking Alpha that meet this threshold) but I am more than willing to accept the fact that I’m not one of them. ABBV is the one exception I am willing to make when it comes to investing in a singular pharmaceutical stock.
John and Jane’s portfolio is sitting on massive unrealized capital gains while the company maintains it shareholder-friendly stands by boosting its dividend achieving a five-year dividend growth rate of 17.7%). The future looks even more promising now that the company is less reliant on revenues generated by the drug Humira which at one point accounted for 60% of revenues. At the current share price the stock is reaching peak value and buying opportunities might be available in the near future as the company is expected to take a hit on earnings from the loss of Humira. ABBV is currently fairly valued and with a full position we won’t be adding unless a substantial pullback occurs.
AbbVie – FastGraphs (FastGraphs)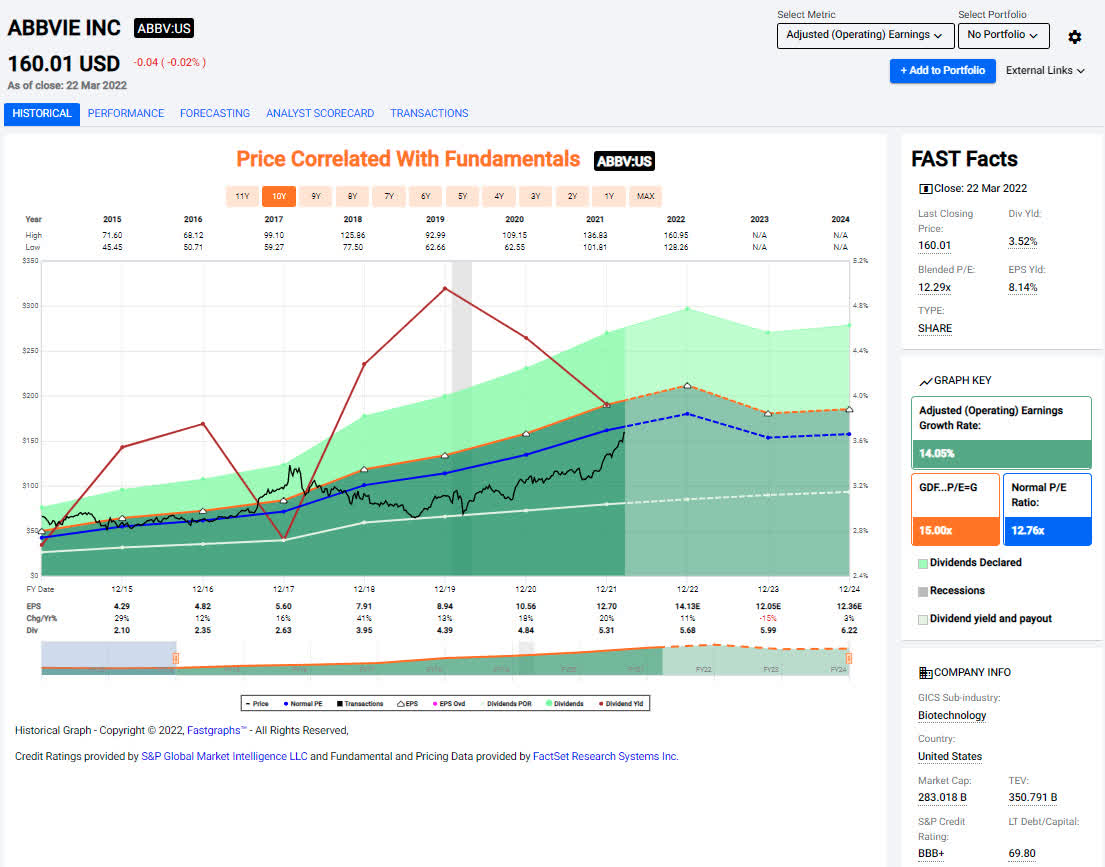
The dividend was increased from $1.30/share per quarter to $1.41/share per quarter. This represents an increase of 8.5% and a new full-year payout of $5.64/share compared with the previous $5.20/share. This results in a current yield of 3.52% based on the current share price of $158.42.
British American Tobacco – There are few things that truly surprise me anymore but seeing a news update about the growth of cigarette sales caused me to monitor the word “really?”. A news update titled Cigarette sales grew in 2020 for the first time in 20 years was pretty incredible simply because the tobacco industry has seen the total number of cigarettes sold continue to drop since the volume of units hit its peak in 1981 at 636.5 billion units. As restrictions loosen, I think it’s possible that we will see the volume begin to decrease again although I do have a favorable outlook with smokeless products replacing traditional cigarettes. We would look to expand the existing position in BTI when shares drop below $40 which would result in a yield of 7.35% (with BTI we target a dividend yield over 7%).
BTI – Dividend Yield (Seeking Alpha)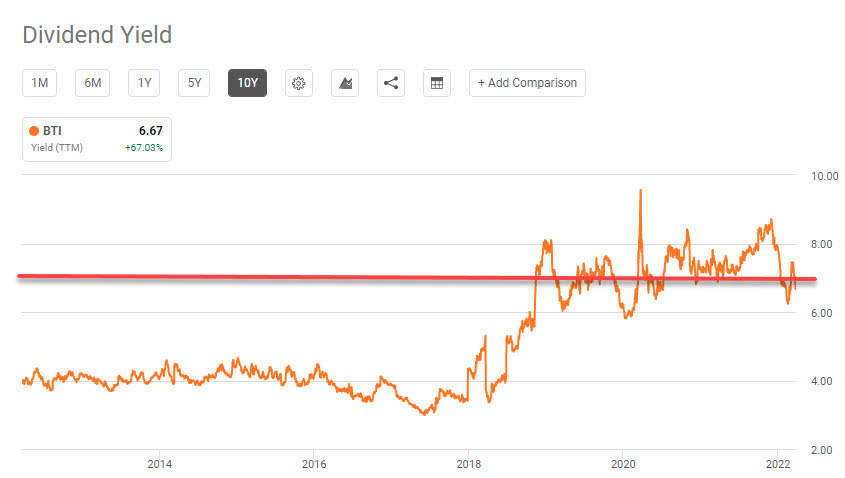
The dividend was increased from $.725/share per quarter to $.735/share per quarter. This represents an increase of 1.4% and a new full-year payout of $2.94/share compared with the previous $2.90/share. This results in a current yield of 6.70% based on the current share price of $43.87.
East West Bancorp – EWBC has performed extremely well over the last couple of years and a lot of this success can be attributed to an emphasis on business lending and significant deposits that are non-interest bearing which keeps the cost of funds low. FY-2021 resulted in record earnings of $6.10/share and we are bullish that the company will continue to perform well because the loan portfolio is set to benefit from rising interest rates which will result in an increased spread between the cost of deposits in the yield on loans. The recent dividend increase of 21% is impressive but there is still a lot of room to grow the dividend going forward with a payout ratio coming in at about 26%.
EWBC – FastGraphs – March 2022 (FastGraphs)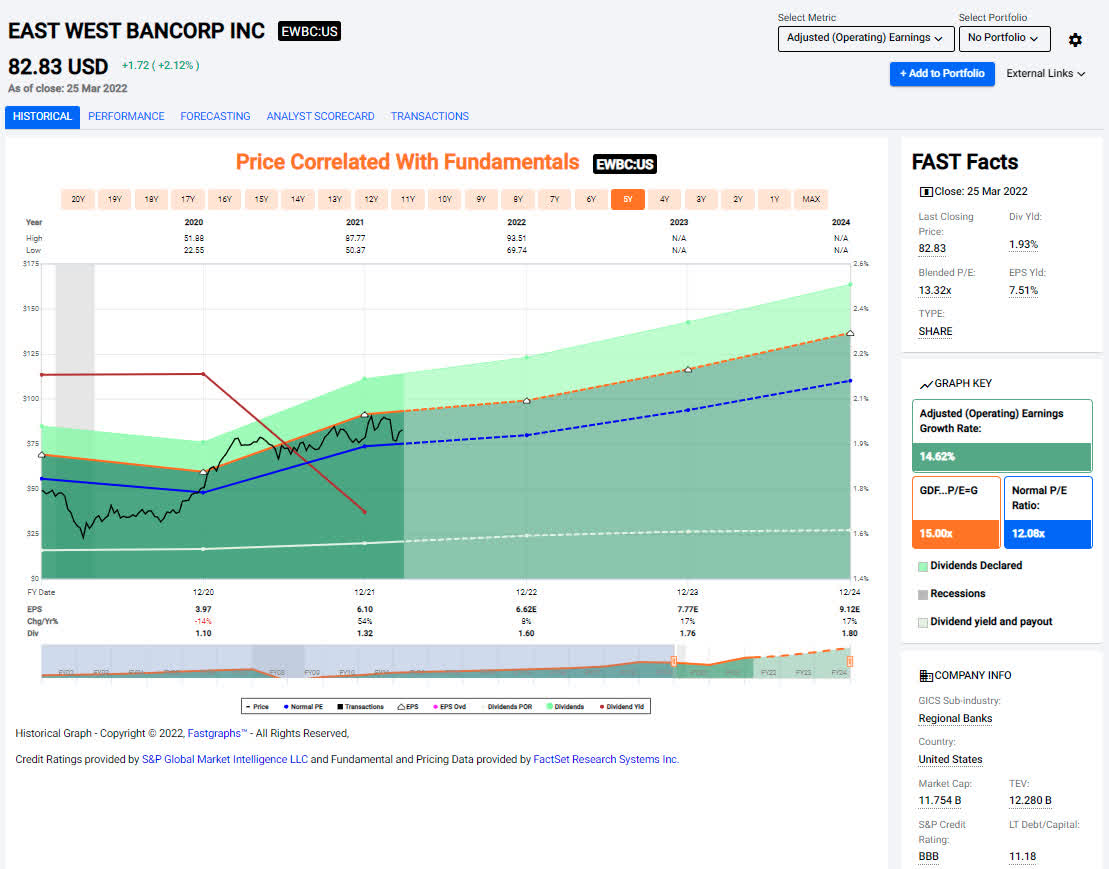
The dividend was increased from $.33/share per quarter to $.40/share per quarter. This represents an increase of 21.2% and a new full-year payout of $1.60/share compared with the previous $1.32/share. This results in a current yield of 1.93% based on the current share price of $82.40.
Royal Bank of Canada – RY, like the other large Canadian banks, has seen strong performance starting in December 2021 and has broken out of previous ranges of around $75/share last seen at the beginning of 2020 (prior to COVID). RY is very well capitalized and they have been using additional funds to repurchase shares whenever it makes sense. The most recent dividend increase also included authorization to cancel “up to 45M of its common shares, representing approximately 3.16% of the Bank’s 1,425,279,101 outstanding common shares as at November 26, 2021.” I would suggest the prospective investors wait for a pullback closer to $100/share because this served as the last downside resistance point for the latter half of 2021.
RY – FastGraphs – March 2022 (FastGraphs)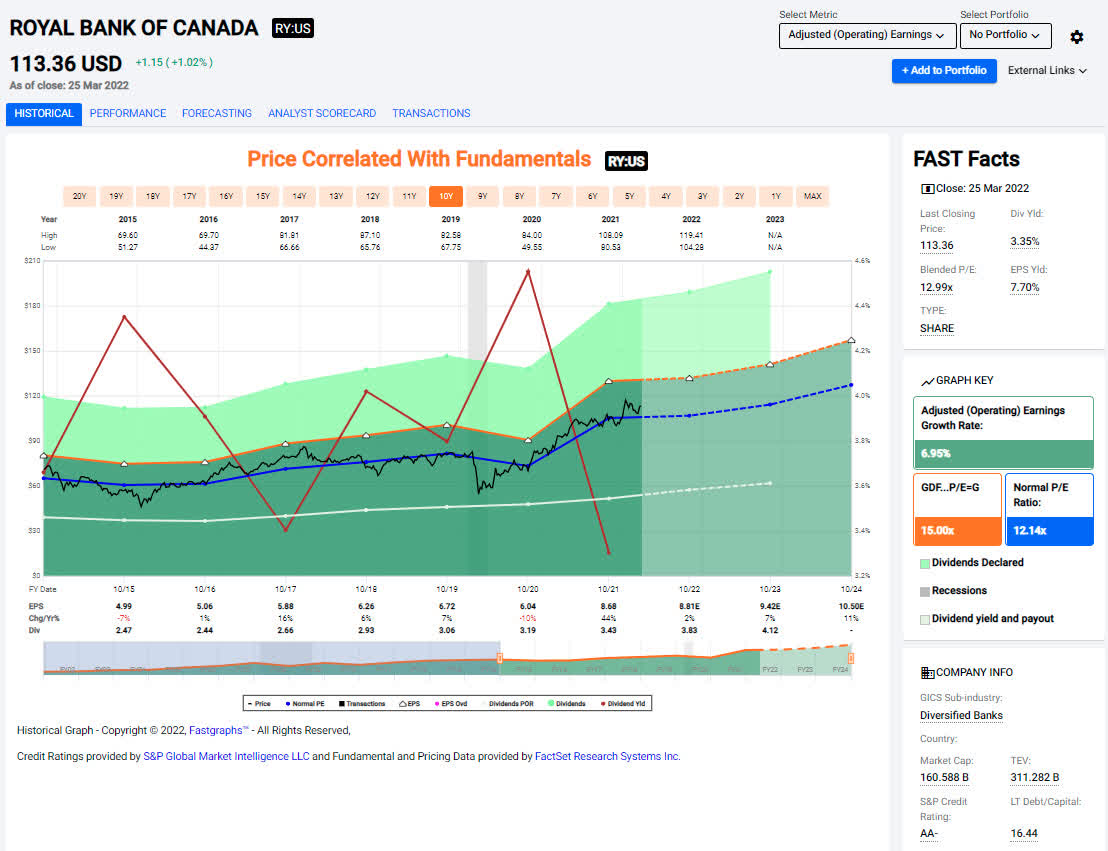
The dividend was increased from $1.08C/share per quarter to $1.20C/share per quarter. This represents an increase of 11.1% and a new full-year payout of $4.80C/share compared with the previous $4.32C/share. This results in a current yield of 3.13% based on the current share price of $112.45 USD.
Retirement Account Positions
There are currently 37 different positions in Jane’s Traditional IRA and 24 different positions in Jane’s Roth IRA. While this may seem like a lot, it is important to remember that many of these stocks cross over in both accounts and are also held in the Taxable Portfolio.
Below is a list of the trades that took place in the Traditional IRA during the month of February.
Traditional IRA – February – Trades (Charles Schwab)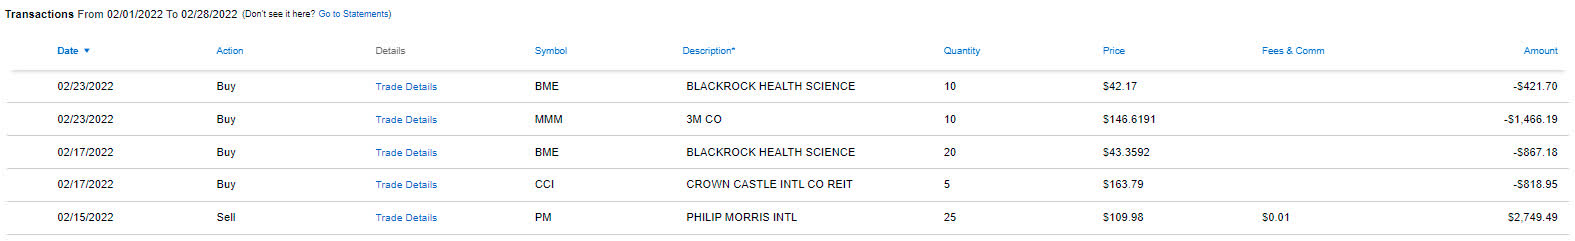
Below is a list of the trades that took place in the Roth IRA during the month of February.
Roth IRA – February – Trades (Charles Schwab)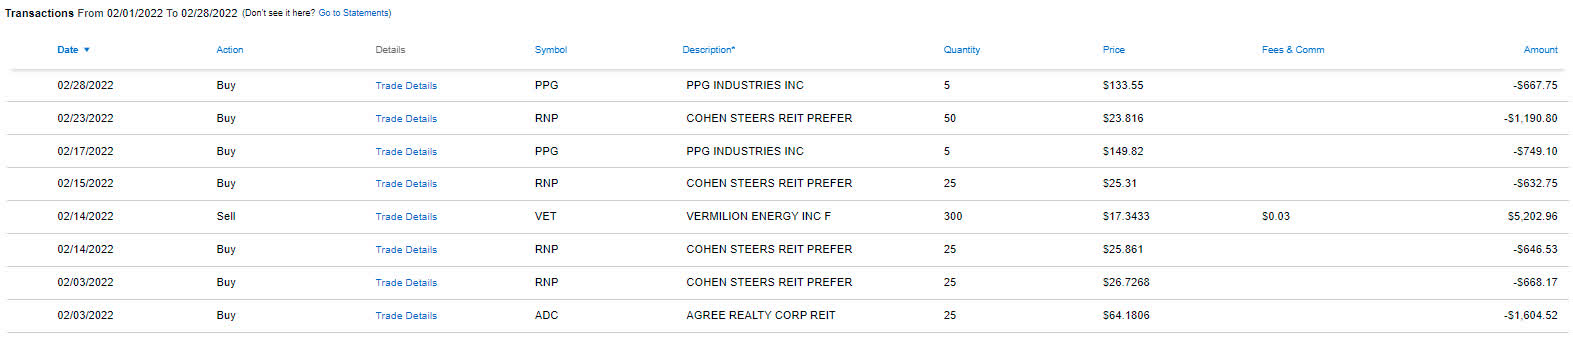
We sold our high-cost portion of Philip Morris (PM) and eliminated the entire position for Vermilion Energy (VET) after it staged a huge recovery on the back of rising energy prices. VET still does not pay a dividend and that was a big reason why we wanted it removed from Jane’s portfolio (disclosure: I am personally still long VET in my portfolio).
All remaining trades are purchases and these all came as those companies hit new 52-week-lows.
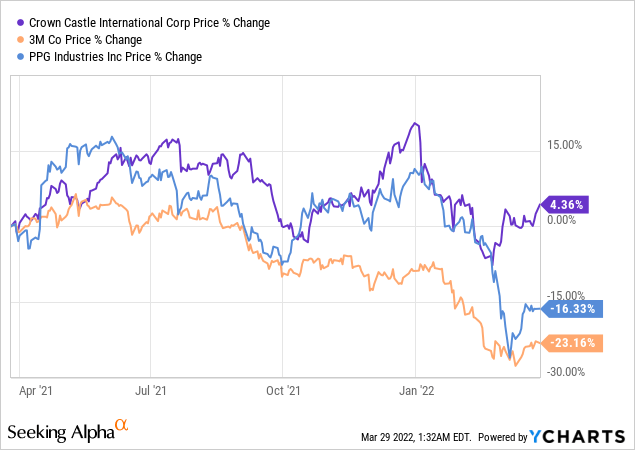
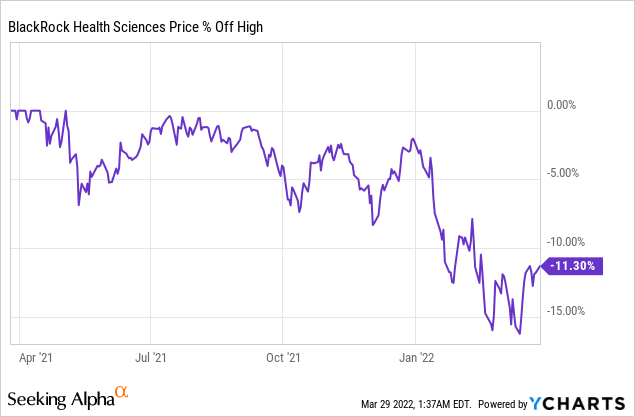
Although Crown Castle (CCI) wasn’t below its 52-week-low it was extremely close. 3M (MMM) and PPG (PPG) have both cratered (over the last six months in particular) which seemed like a good time to establish a better low-cost position. We also made several purchases of the closed-end fund BlackRock Health Sciences Trust (BME) as the share price has pulled back considerably.
February Income Tracker – 2021 Vs. 2022
Income for the month of February was up considerably year-over-year for Jane’s Traditional IRA and down just slightly in her Roth IRA. The average monthly income for the Traditional IRA is in 2022 is expected to be up about 4.2% based on current estimates and the Roth IRA is looking to grow by 2.4%. This means the Traditional IRA would generate an average monthly income of $1,443.91/month and the Roth IRA would generate an average income of $607.01/month. This compares with 2021 figures that were $1,386.13 and $592.61, respectively.
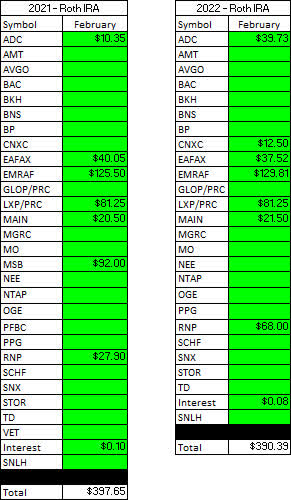
SNLH = Stocks No Longer Held – Dividends in this row represent the dividends collected on stocks that are no longer held in that portfolio. We still count the dividend income that comes from stocks no longer held in the portfolio even though it is non-recurring.
All images below come from Consistent Dividend Investor, LLC. (Abbreviated to CDI).
Traditional IRA – 2021 V 2022 – February Dividends (CDI) Roth IRA – 2021 V 2022 – February Dividends (CDI)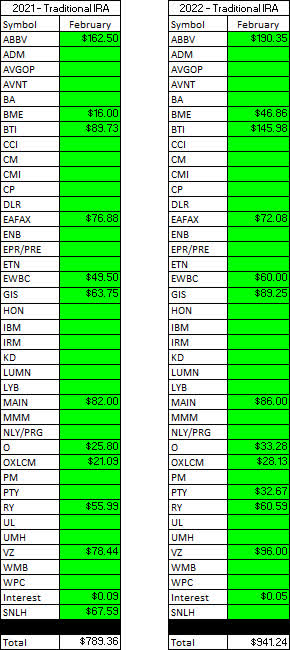
Here is a graphical illustration of the dividends received on a monthly basis for the Traditional and Roth IRAs.
Retirement Projections – 2022 – February – Monthly Dividends (Bar Graph) (CDI)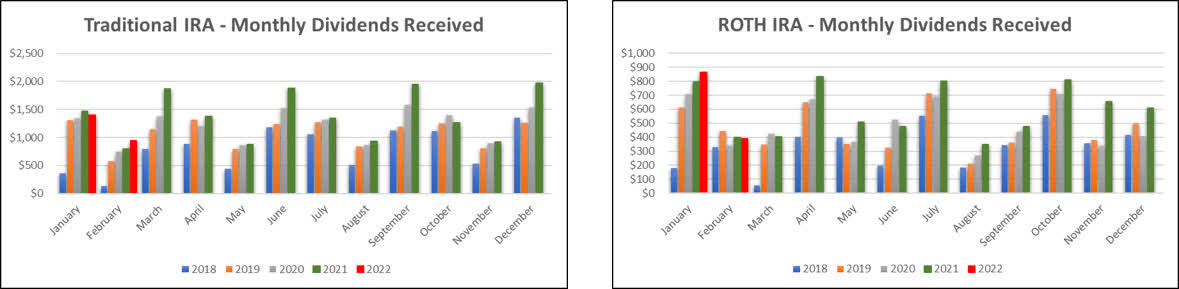
The table below represents the actual full-year results for 2022 and the prior year.
Retirement Projections – 2022 – February (CDI)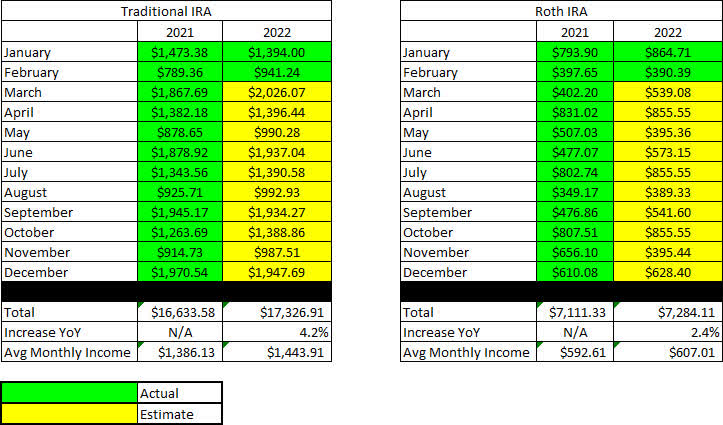
Below is an expanded table that shows the full dividend history since inception for both the Traditional IRA and Roth IRA.
Retirement Projections – 2022 – February – 5 YR History (CDI)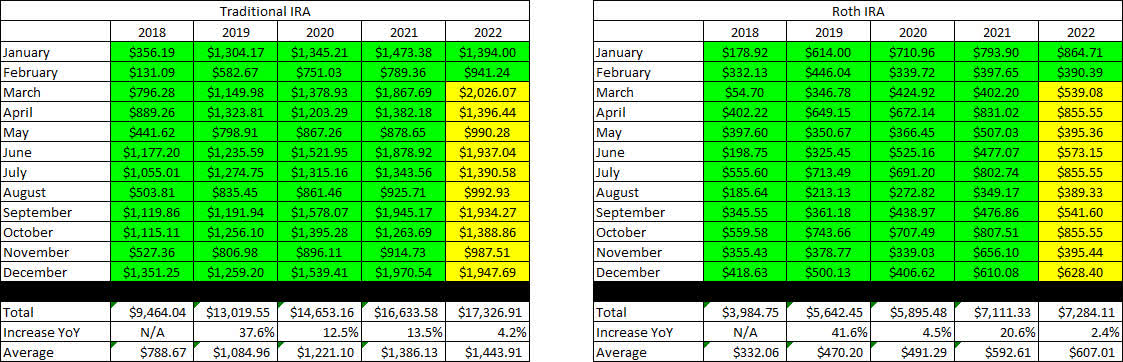
I have included line graphs that better represent the trends associated with Jane’s monthly dividend income generated by her retirement accounts. The images below represent the Traditional IRA and Roth IRA, respectively.
Retirement Projections – 2022 – February – Monthly Dividends (CDI)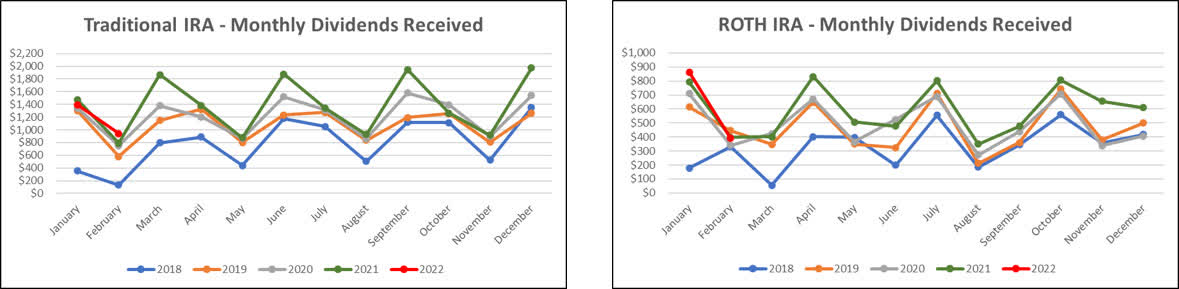
Here is a table to show how the account balances stack up year over year (I previously used a graph but believe the table is more informative).
It is worth noting that with John and Jane Retired there will be no additional contributions to these accounts. In fact, they have already begun to take regular distributions from the Taxable Account and John’s Traditional IRA.
Retirement Account Balances – 2022 – February (CDI)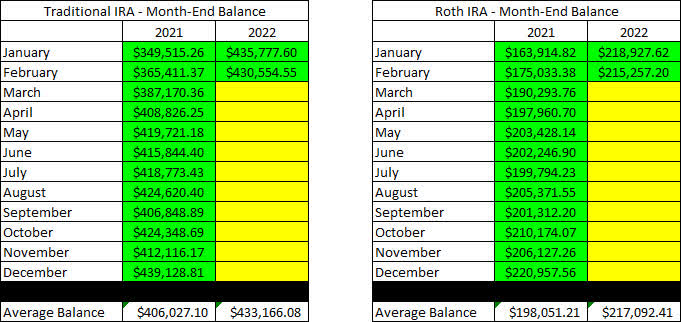
The next images are the tables that indicate how much cash Jane had in her Traditional and Roth IRA Accounts at the end of the month as indicated on their Charles Schwab statements.
Retirement Projections – 2022 – February – Cash Balances (CDI)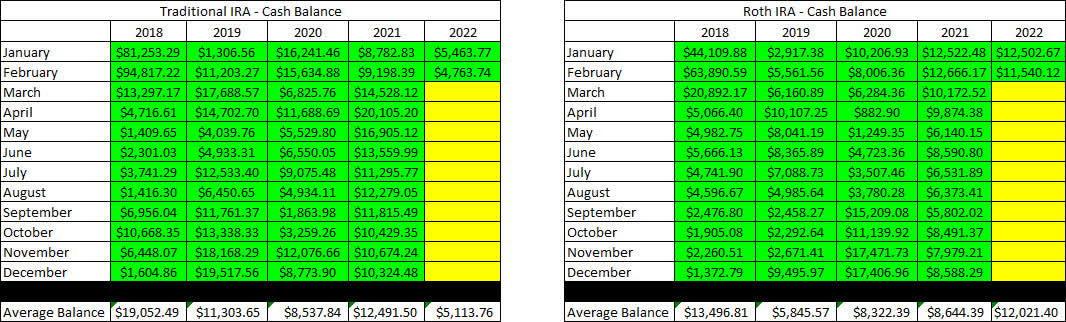
The next image provides a history of the unrealized gain/loss at the end of each month in the Traditional and Roth IRAs going back to the beginning in January of 2018.
Retirement Projections – 2022 – February – Unrealized Gain-Loss (CDI)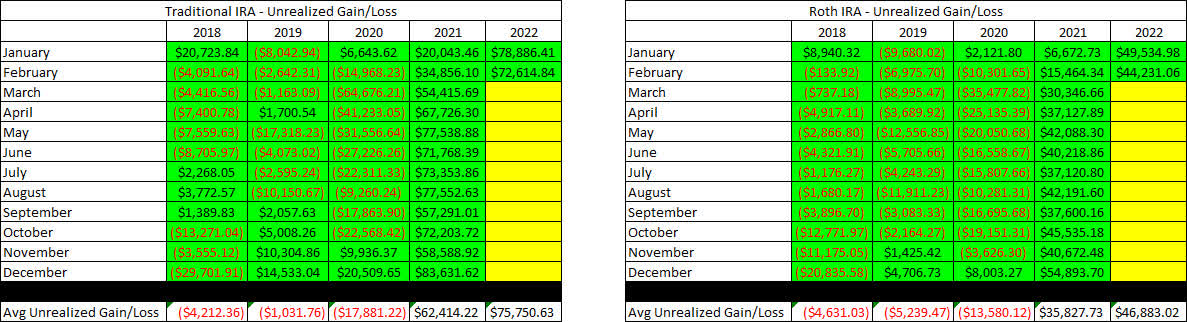
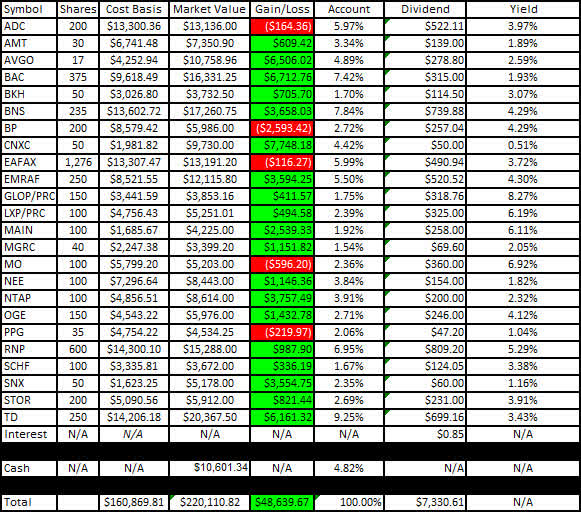
I like to show readers the actual unrealized gain/loss associated with each position in the portfolio because it is important to consider that in order to become a proper dividend investor, it is necessary to learn how to live with volatility. The market value and cost basis below are accurate as of the market close on March 28th.
Here is the unrealized gain/loss associated with Jane’s Traditional and Roth IRAs.
Traditional IRA – 2022 – February – Gain-Loss (CDI) Roth IRA – 2022 – February – Gain-Loss (CDI)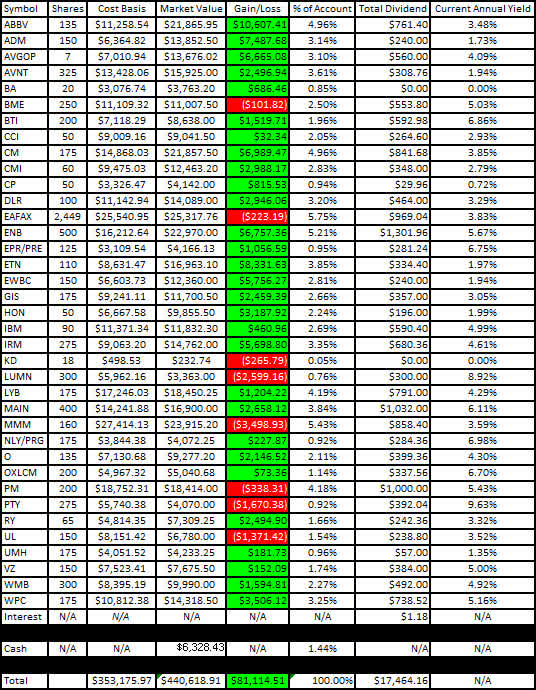
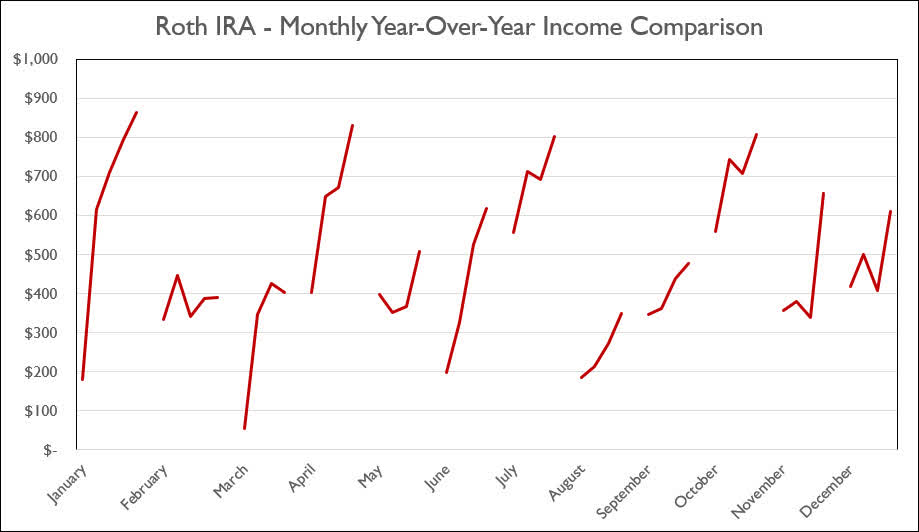
The last two graphs show how dividend income has increased, stayed the same, or decreased in each respective month on an annualized basis. I believe that the graph will continue to become more valuable as more years of data become available (with the fifth year of data being added we can really see the trajectory of the income change for each month).
Traditional IRA – 2022 – February – Monthly Year-Over-Year Comparison (CDI) Roth IRA – 2022 – February – Monthly Year-Over-Year Comparison (CDI)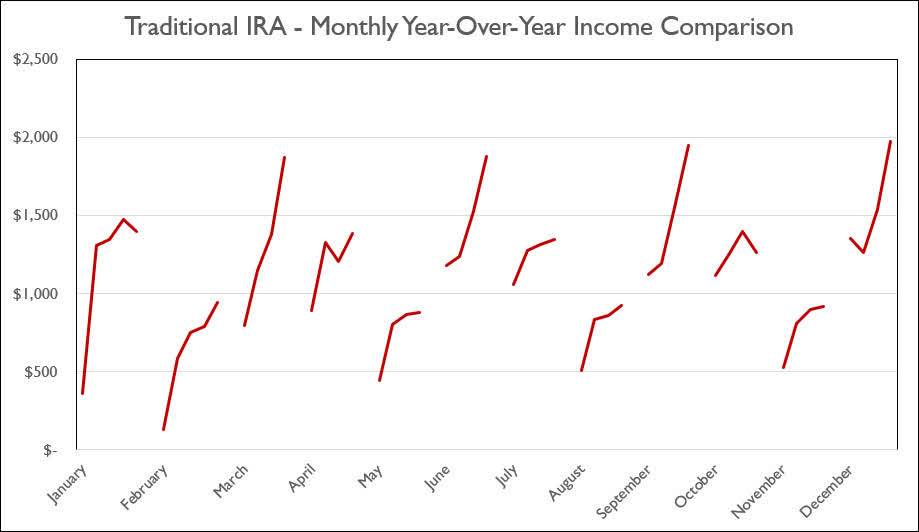
Conclusion
As we close in the end of March Jane’s portfolio has performed relatively well with balances higher at this point in the month than they were when they ended in February. We are committed to deploying cash for stocks that seem undervalued while trimming some high-cost shares in order to replenish Jane’s cash reserves.
February Articles
I have provided the link to the February 2022 Taxable Account below.
The Retirees’ Dividend Portfolio: John And Jane’s February Taxable Account Update
In Jane’s Traditional and Roth IRAs, she is currently long the following mentioned in this article: AbbVie (NYSE:ABBV), Agree Realty (NYSE:ADC), Archer-Daniels-Midland (NYSE:ADM), Broadcom (NASDAQ:AVGO), Avient (NYSE:AVNT), Broadcom Preferred Series A (NASDAQ:AVGOP), Boeing (NYSE:BA), Bank of America (NYSE:BAC), Black Hills Corp. (NYSE:BKH), BlackRock Health Sciences Trust (NYSE:BME), Bank of Montreal (NYSE:BMO), Bank of Nova Scotia (NYSE:BNS), BP (NYSE:BP), British American Tobacco (NYSE:BTI), Canadian Imperial Bank of Commerce (NYSE:CM), Cummins (NYSE:CMI), Concentrix (NASDAQ:CNXC), Digital Realty (NYSE:DLR), Eaton Vance Floating-Rate Advantage Fund A (MUTF:EAFAX), Enbridge (NYSE:ENB), EPR Properties Preferred Series E (NYSE:EPR.PE), Eaton Corporation (NYSE:ETN), Emera Inc. (OTCPK:EMRAF), East West Bancorp (NASDAQ:EWBC), General Mills (NYSE:GIS), GasLog Partners Preferred C (NYSE:GLOP.PC), Honeywell (NASDAQ:HON), International Business Machines (NYSE:IBM), Iron Mountain (NYSE:IRM), Lexington Realty Preferred Series C (NYSE:LXP.PC), Lumen Technologies (NYSE:LUMN), LyondellBasell (NYSE:LYB), Main Street Capital (NYSE:MAIN), McGrath RentCorp (NASDAQ:MGRC), 3M (NYSE:MMM), Altria (NYSE:MO), Annaly Capital Preferred Series G (NYSE:NLY.PG), NextEra Energy (NYSE:NEE), NetApp (NASDAQ:NTAP), Realty Income (NYSE:O), OGE Energy Corp. (NYSE:OGE), Oxford Lane Capital Corp. 6.75% Cum Red Pdf Shares Series 2024 (NASDAQ:OXLCM), Philip Morris (NYSE:PM), PPG Industries (NYSE:PPG), PIMCO Corporate & Income Opportunity Fund (PTY), Cohen & Steers REIT & Preferred Income Fund (NYSE:RNP), Royal Bank of Canada (NYSE:RY), Schwab International Equity ETF (NYSEARCA:SCHF), SYNNEX Corp. (NYSE:SNX), STORE Capital (NYSE:STOR), Toronto-Dominion Bank (NYSE:TD), Unilever (NYSE:UL), UMH Properties (UMH), Verizon (NYSE:VZ), Williams Companies (NYSE:WMB), W. P. Carey (NYSE:WPC).
Be the first to comment