

Alexander Sharganov/iStock via Getty Images
Baytex Energy (OTCPK:BTEGF) has been one of the better turnaround stories in the oil & gas sector over the last couple of years. It was always a high-risk, high reward type of play, but there is stability and a bright future ahead with most of the company risk eliminated. That company’s risk was mostly tied to debt and the high leverage that the company was carrying. We saw the share price drop as low as $0.20 in 2020, and here we stand today 2 years later at over $4.50. The secret to their turnaround has been free cash flow. That secret is going to lead to shareholders getting paid well over the next couple of years as the debt is essentially erased and the company looks at buybacks and reinstating a dividend we haven’t seen for years. The party is back on!
What’s Driving Baytex?
This will be shocking to no one, but it’s free cash flow. It’s funny to read the Q4 reports of all these companies like Baytex and they forecast based on $65, $75, and $85 WTI. Now that is totally fair, given that it would be crazy to think we could see $100+ oil for over a couple of weeks, but we’re going to see an average March price that comes in well over $100 in a matter of days, which is crazy. Now, these companies have to forecast based on an annual average and we are still only 1/4 of the way through the year, but I don’t see oil prices coming down much lower than $85 for most of the summer given the current supply and demand issues. I have outlined some of those here if you want to see where my head is at concerning oil supply/demand.
With respect to Baytex, they saw a record free cash flow of $421 million in 2021. Looking below, we can see just how big of a record that is. Don’t forget, this used to be a $60 stock, and cash flows were half as good as they are now. Looking to the future we can see that analysts are looking for over $600 million in the next two years as well.
TIKR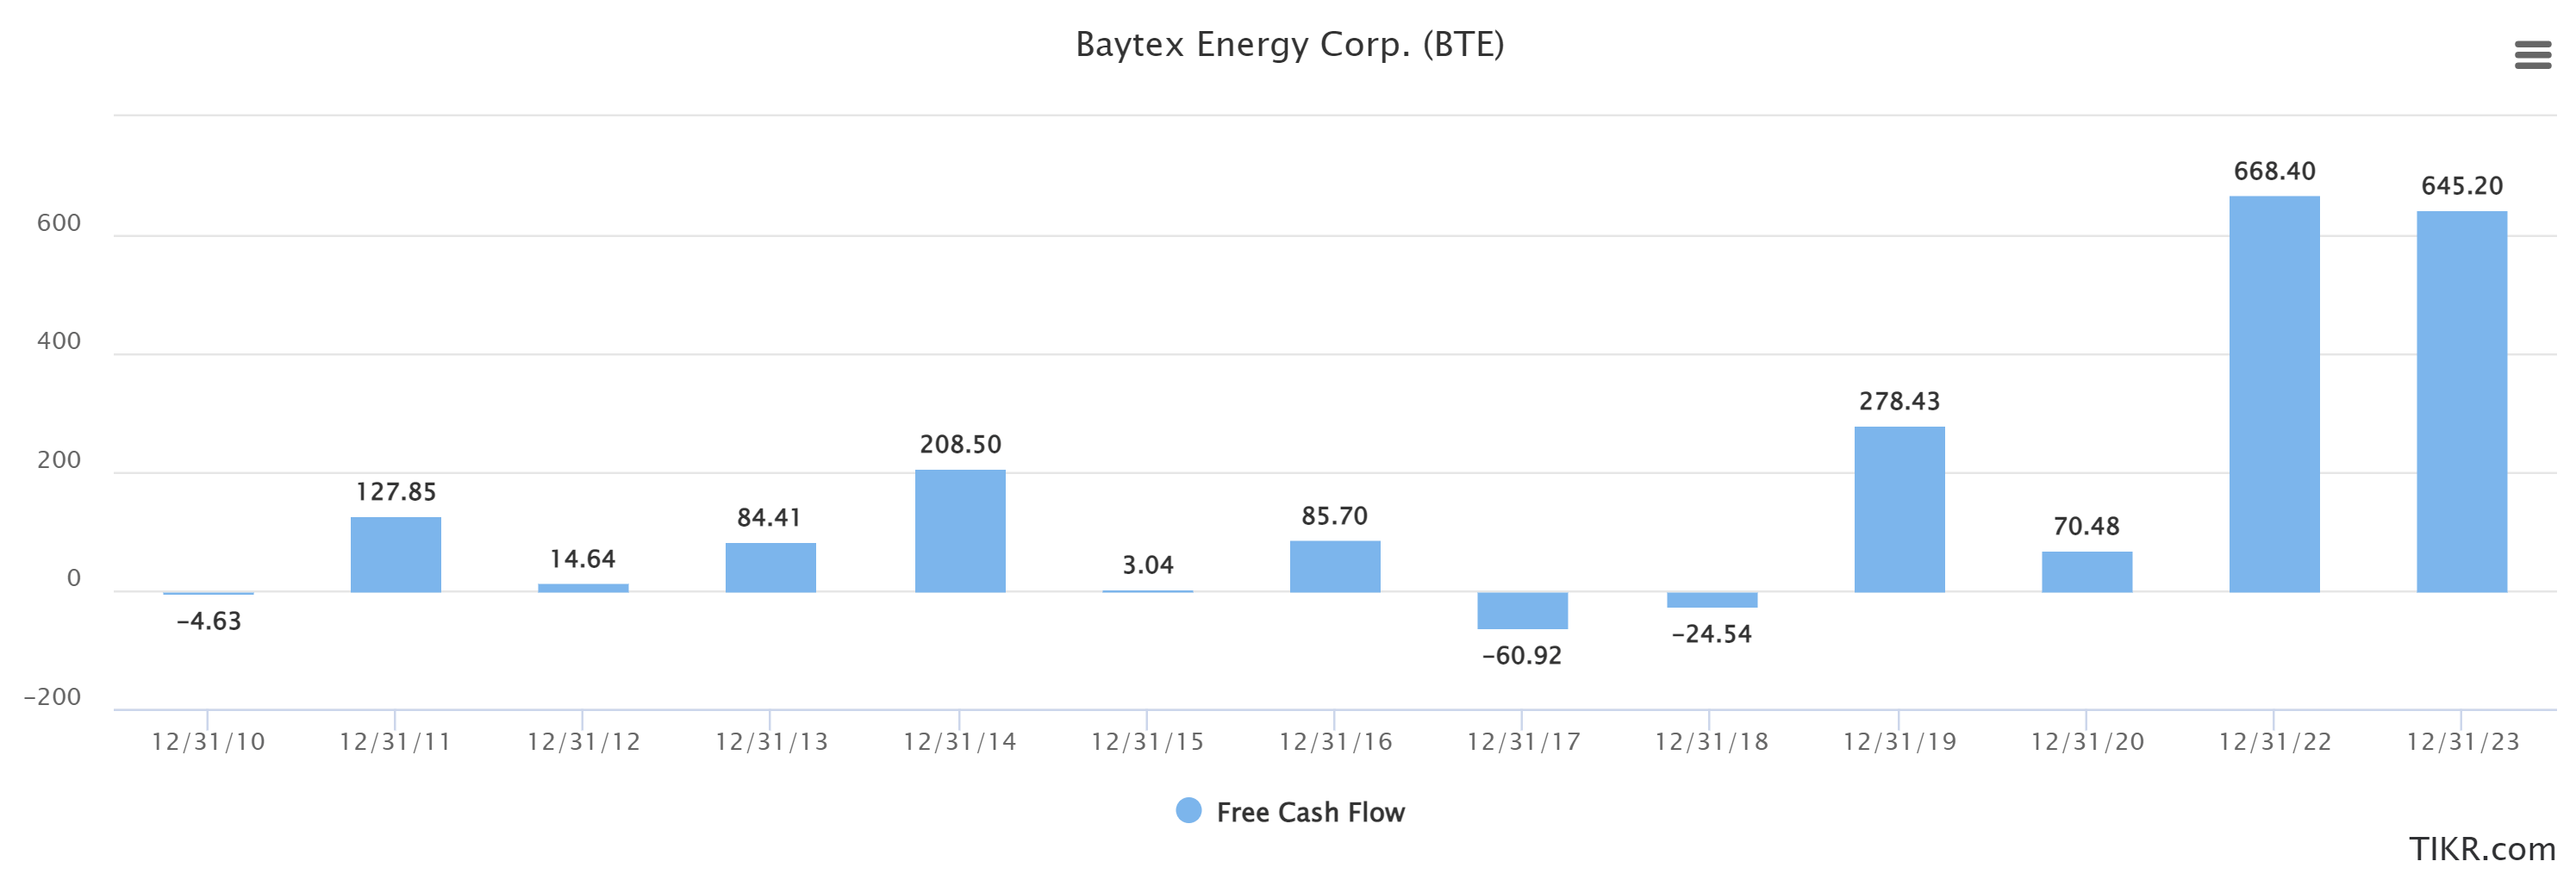
All this talk of increased production? Well, in 2021 Baytex saw 80,000 barrels per day. The forecast for 2022? 80,000 to 83,000. That’s not going to solve any of the demand problems any time soon, but free cash flow is expected to grow by almost 60%. Incredible stuff. We will likely see an increase in CapEx from $313 million up to $400-$450 million.
One of the downsides to Baytex is that they are about 41% hedged. They are utilizing a combination of swaps at $53.50 per barrel, and a 3-way option structure that provides price protection at $58 per barrel with upside participation to approximately $67.50 per barrel. While 41% doesn’t seem like much, and when you’re FCF yield has the potential to be over 20%, it is hard to get upset. But given the market we are in it hurts to see money be left on the table. The hedge does play an important safety net in making sure the capital program is taken care of and they aren’t in a position where they would have to pile on debt.
The last thing I will mention is their 5-year plan. You don’t see a lot of this, and it’s really cool to see. They are basing their plan around $65 WTI, which is a really good number. What we can see is the production continuing to slowly grind higher, while free cash flow grows even quicker. What this means is that even in a $65 WTI world, Baytex shareholders will be getting paid. Be it dividends or buybacks, the party will live on if oil can’t maintain $100 long-term.
Baytex Energy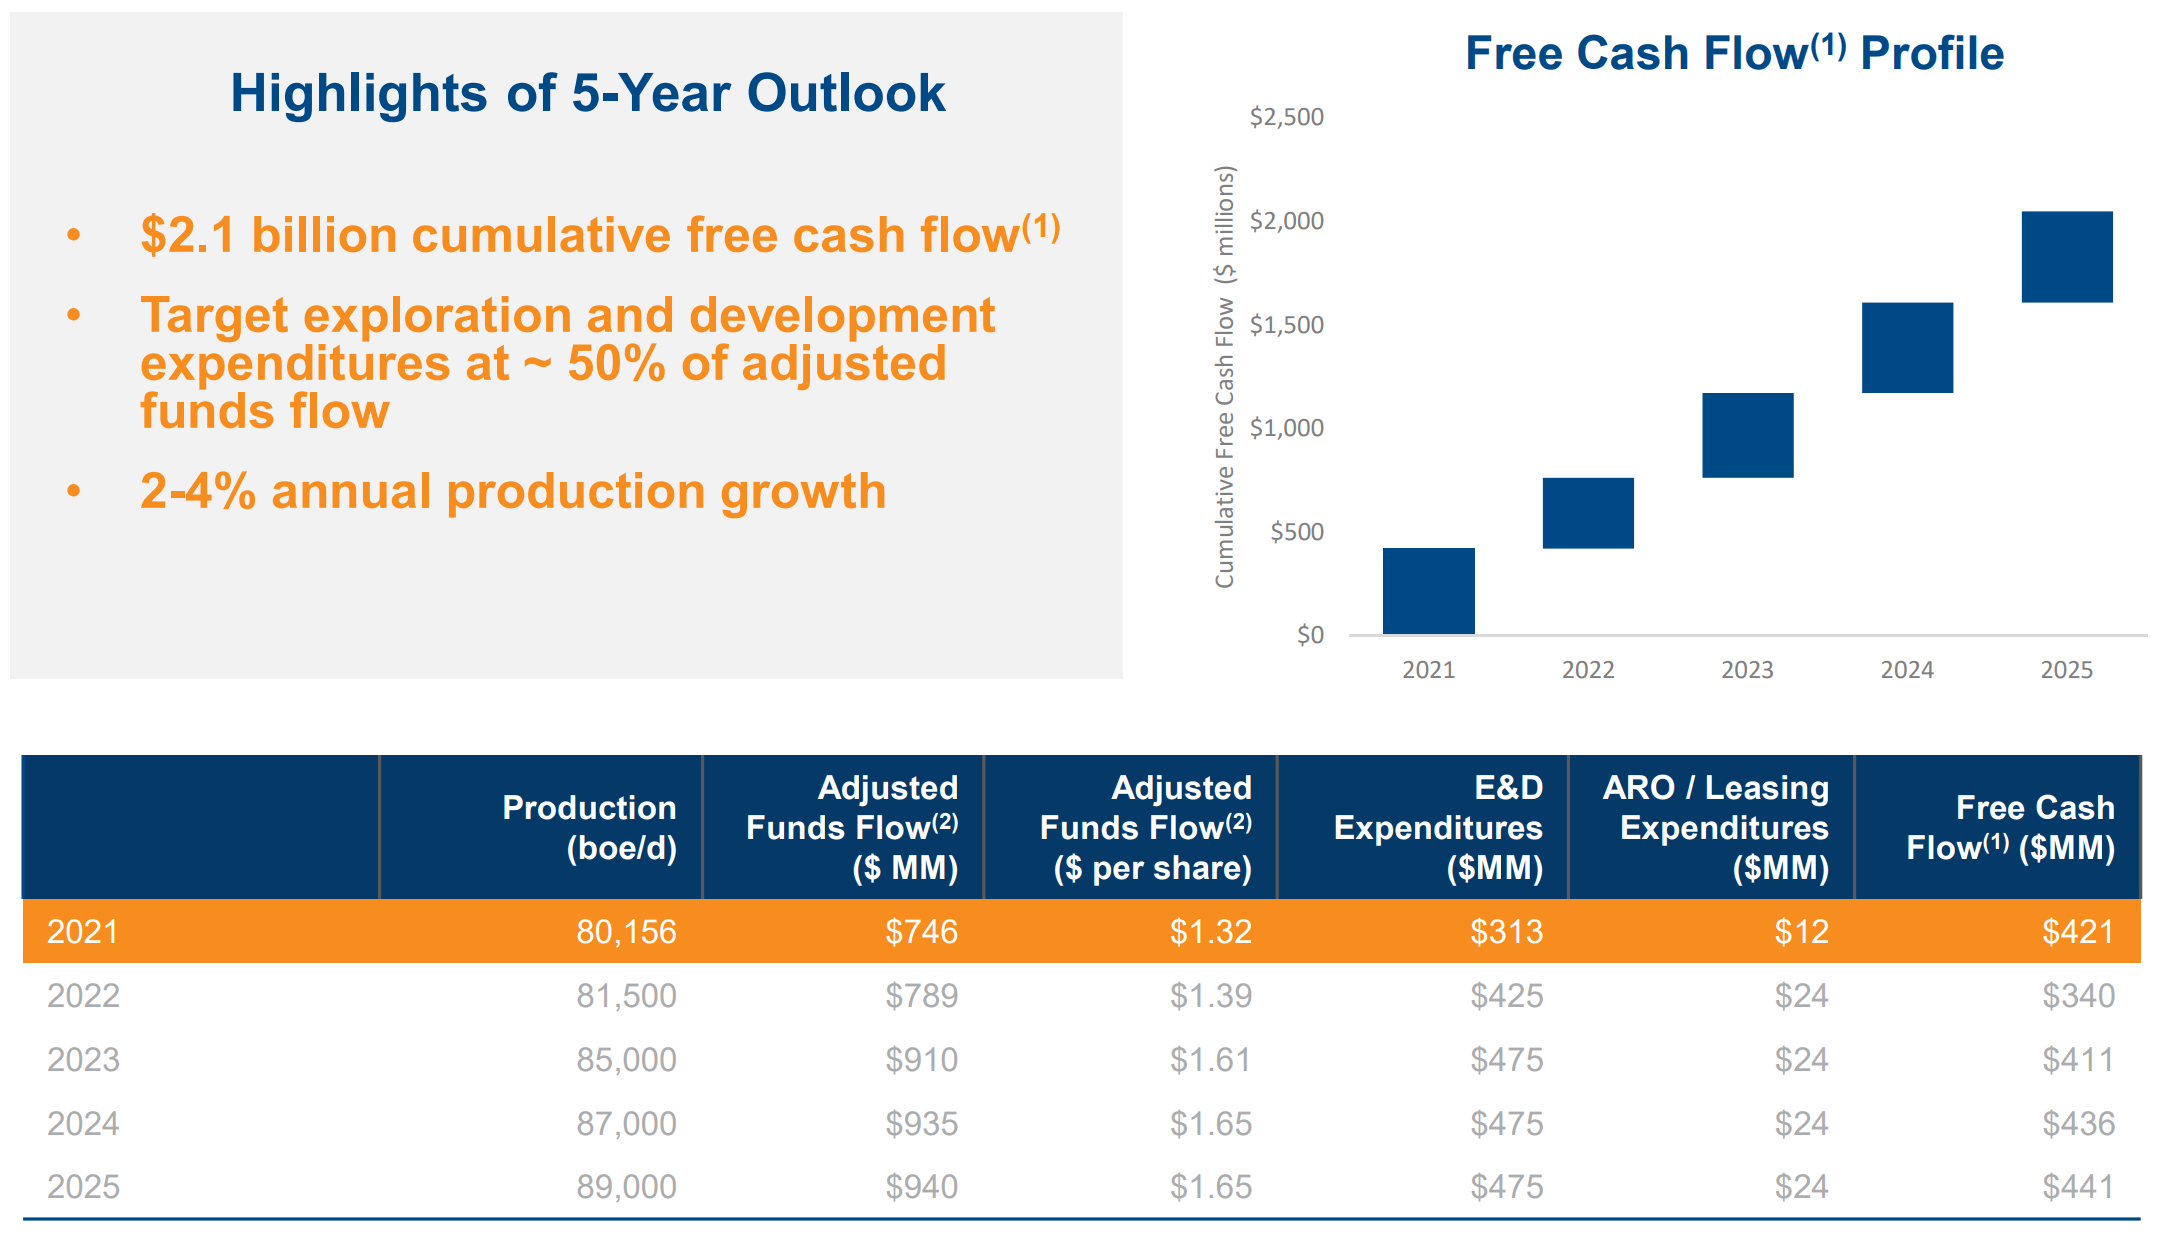
The Debt Story
Many (myself included) steered clear of Baytex back in 2020 because of the debt profile. They finished 2020 with just under $1.8 billion in net debt and posted a leverage ratio of 4.49x which isn’t good. The company had a history of high leverage ever since the price collapse in 2014/15. They topped out at 7x in 2016. The concerning piece was that debt wasn’t even growing, it was the EBITDA part of the equation that was driving the leverage ratio so high. Believe it or not, a 73% decrease over 2 years is bad for the books.
TIKR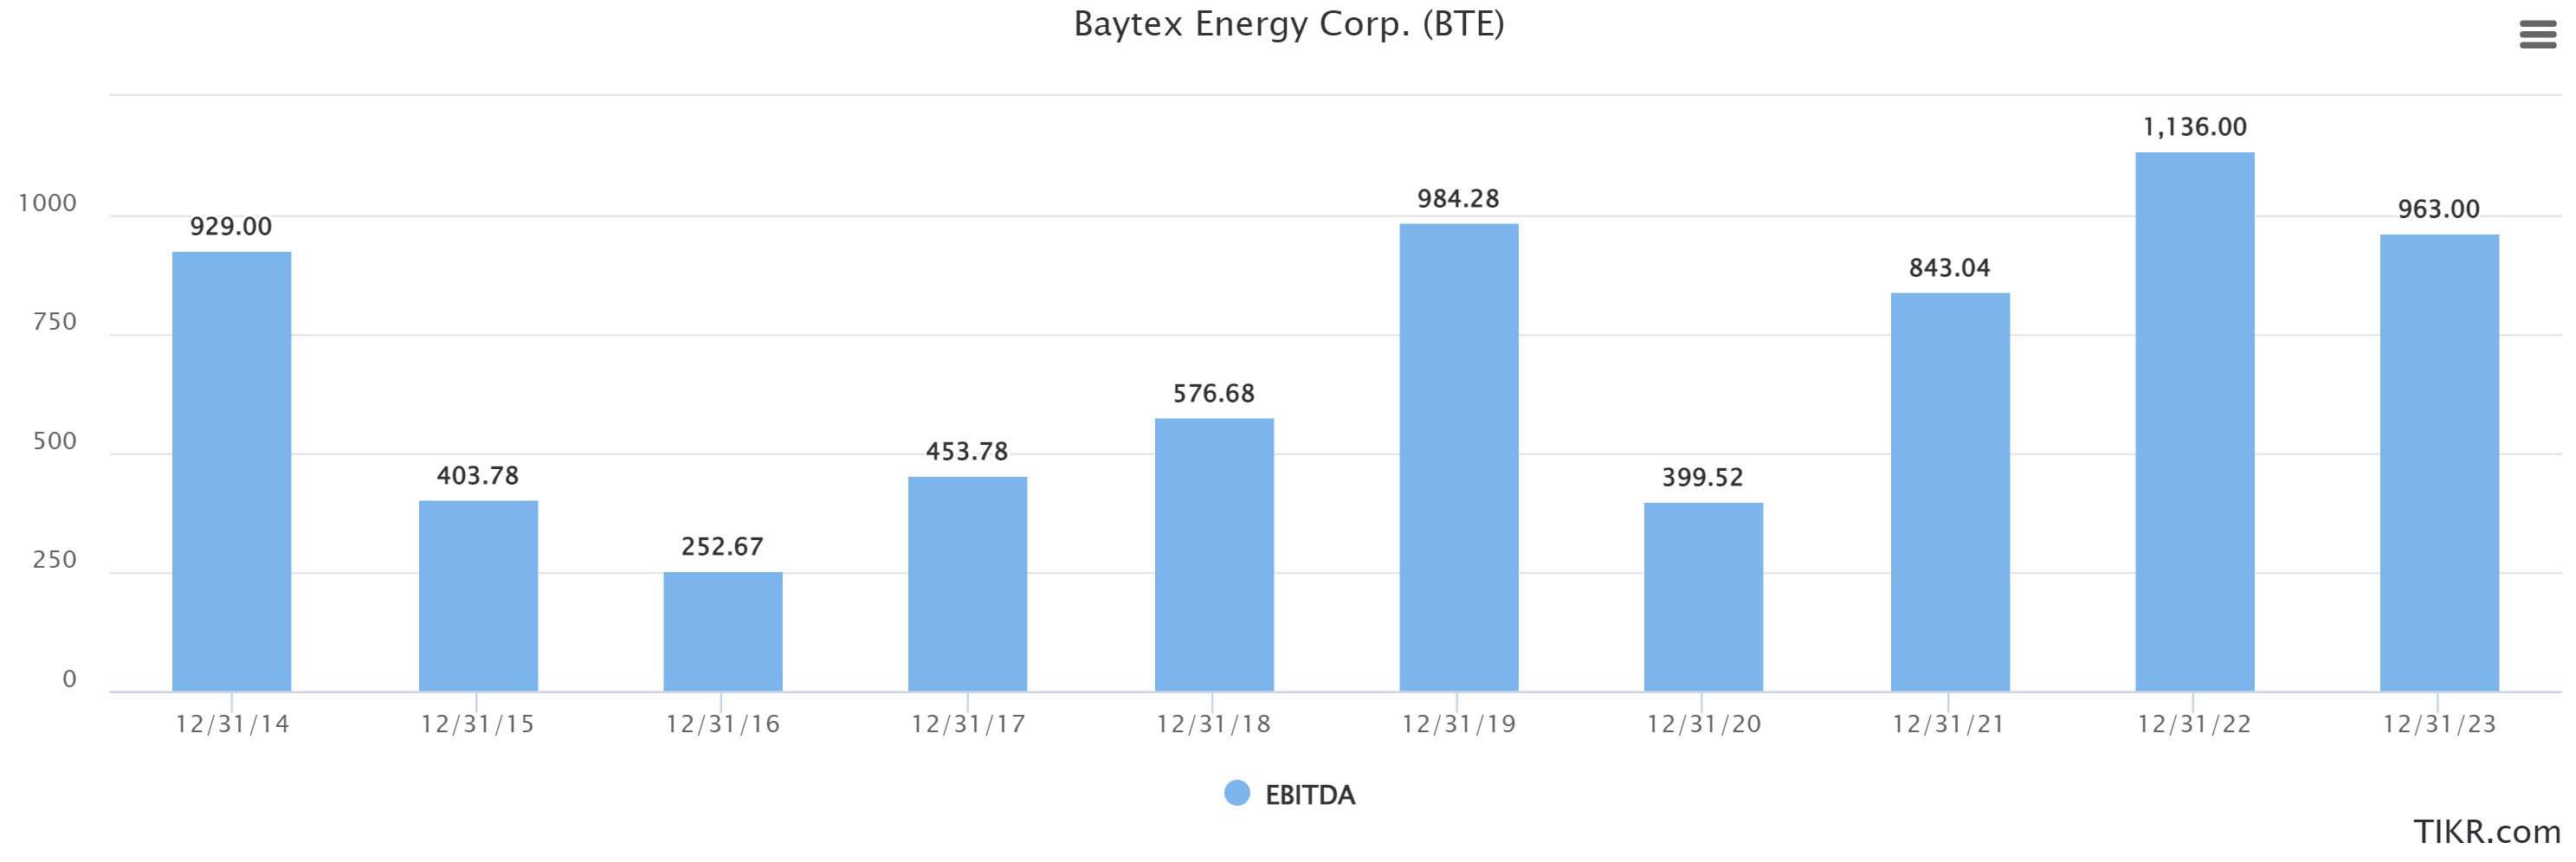
So where are we now? Well, as I mentioned the free cash flow situation has essentially erased this issue altogether. The current debt target is $1.2 billion. All of the free cash flow is going towards making that happen. It’s expected that the target gets taken out in Q2 which gets underway pretty quickly here. After that is when things get fun. By year-end, it’s expected they finish with under $800 million in net debt. That will drop their leverage ratio down to ~0.7x which is incredible. Looking below, you can see exactly what the debt profile looks like. With nothing major being due until 2027, there is a lot of potential here given the cash flows we are seeing.
Baytex Energy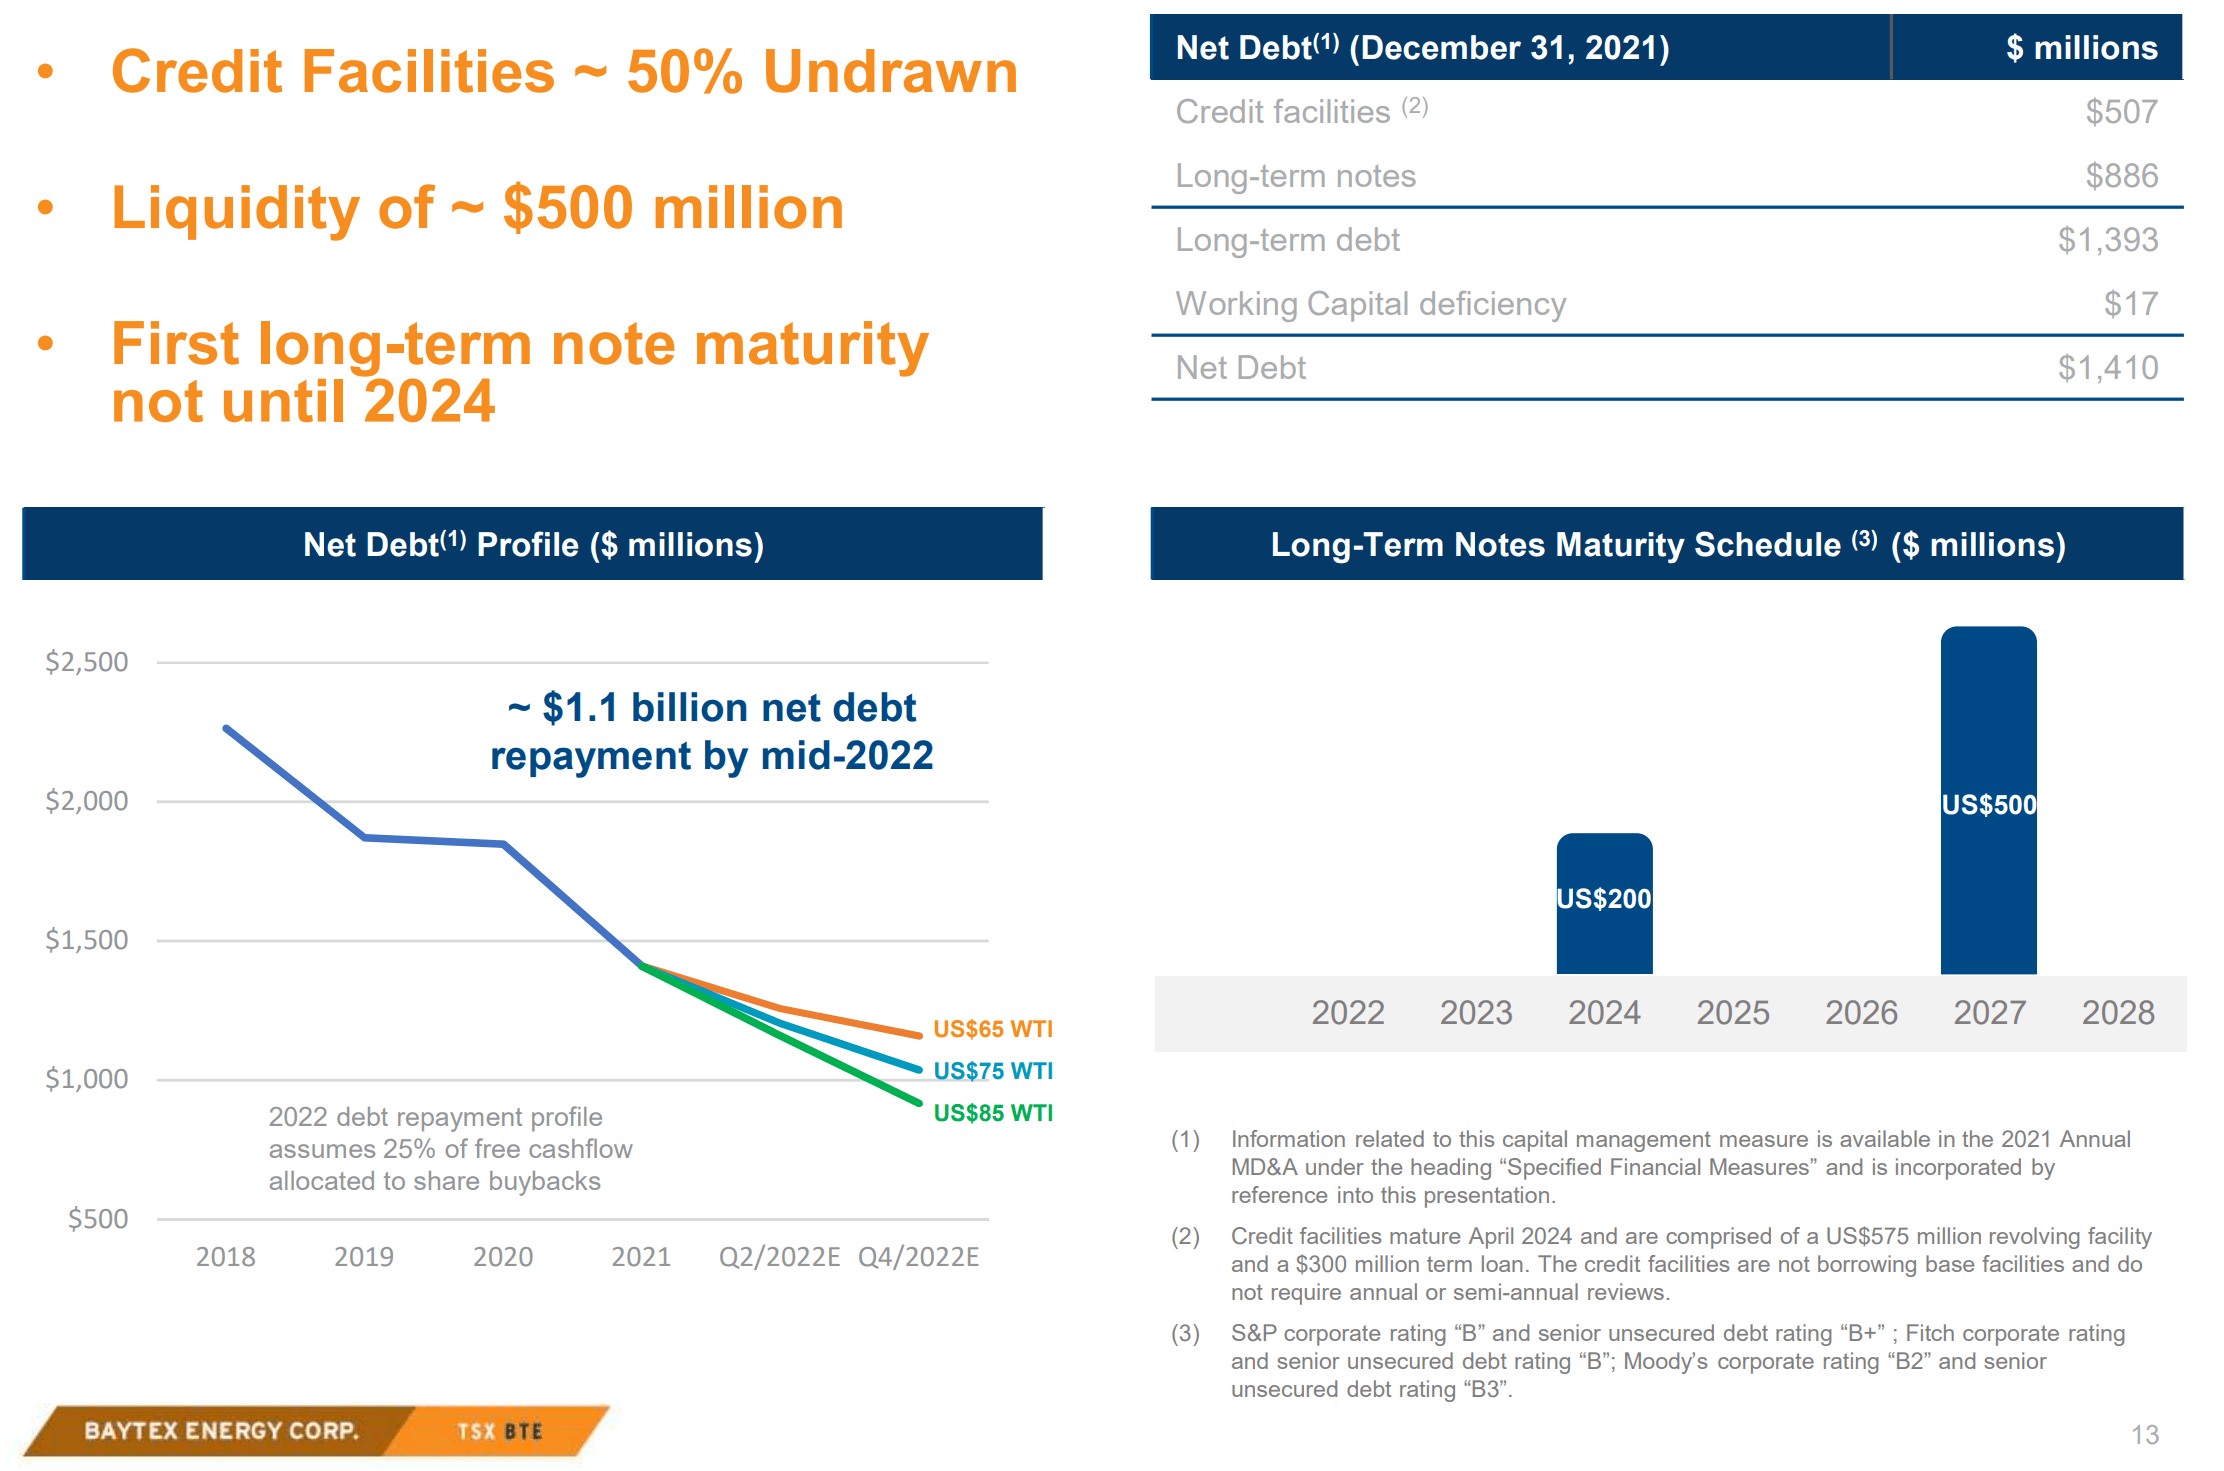
What happens once we see $1.2 billion? Well, between $1.2 billion and $800 million, 25% of the free cash flow will be used for share buybacks. While the company said they are expecting to see $550 million in free cash flow in 2022, analysts are looking for a number closer to $700 million at this point. This would work out to ~$175 million worth of buybacks which is a pretty good start. Once we see the company get sub $800 million in debt, they will look at other means of shareholder returns and further buybacks. We haven’t seen a stand-alone dividend since 2015, but when we did it was yielding between 4-6% which is pretty good. I would expect something in the 2-3% range to start in early 2023, but if we continue to see elevated commodity prices, anything is possible. 2022 and 2023 are going to be great years to be Baytex shareholders.
What Does The Price Say?
The turnaround that Baytex has made has been incredible to watch. Back when I wrote on the high-risk, high reward potential in November of 2020, the fair value was listed at $3.60, with a 90% undervalued mark. Fast forward to today, and the stock is up over 1000% and the new fair value is listed at almost $13.00. What this means is there is still plenty of price correction that needs to happen here. It’s hard to look back and remember that this was once a $60.00 stock back in 2011. The good news is that there is a lot of price history to work with. The bad news is there’s a long way to go.
TC2000.com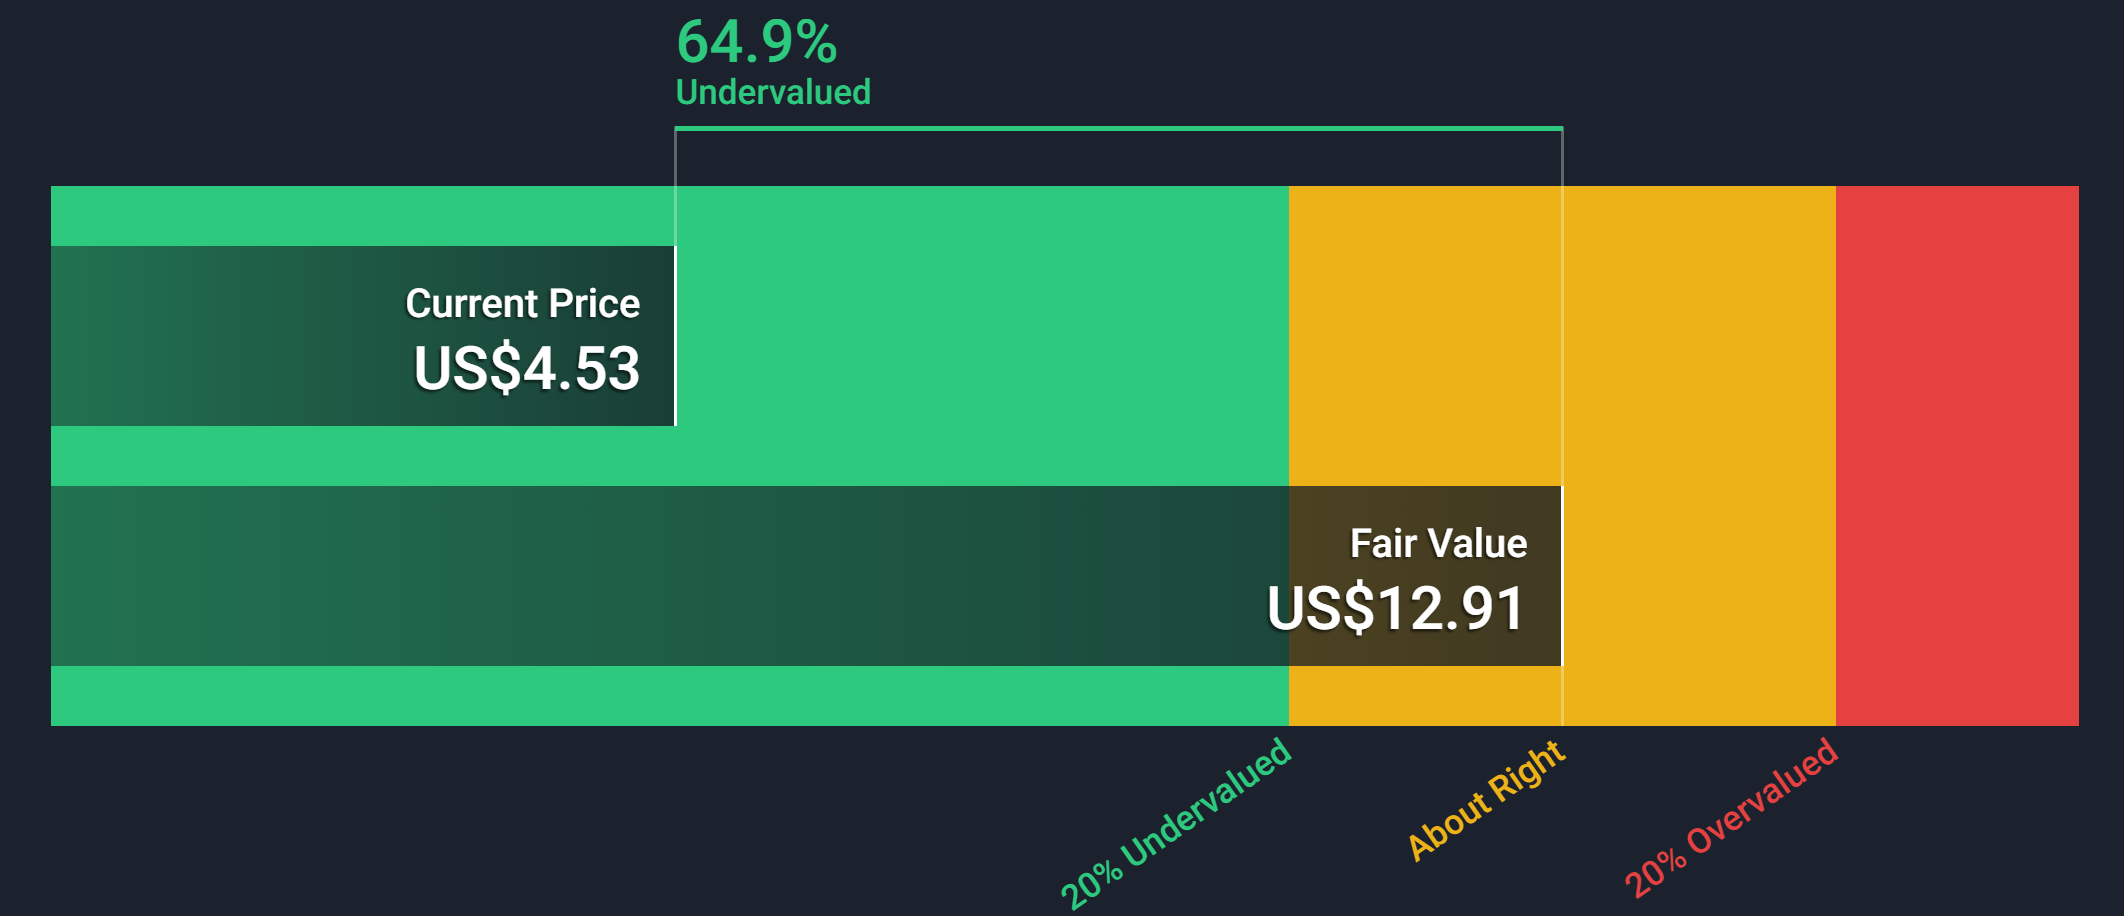
Given we have seen some extreme volatility I want to start with where my stop would be. Looking at the weekly view below, we can see that $3.66 is a pretty important level. The real shelf to watch for is more so around $3.74 in the base that formed throughout February, but the $3.66 gives you a little bit of room. This is about 19% from the current price, but I am going to assume that most of you reading this have been in for quite some time and have done fairly well. This allows for a little more risk than if you would have just entered. The price history here is very clear.
TC2000.com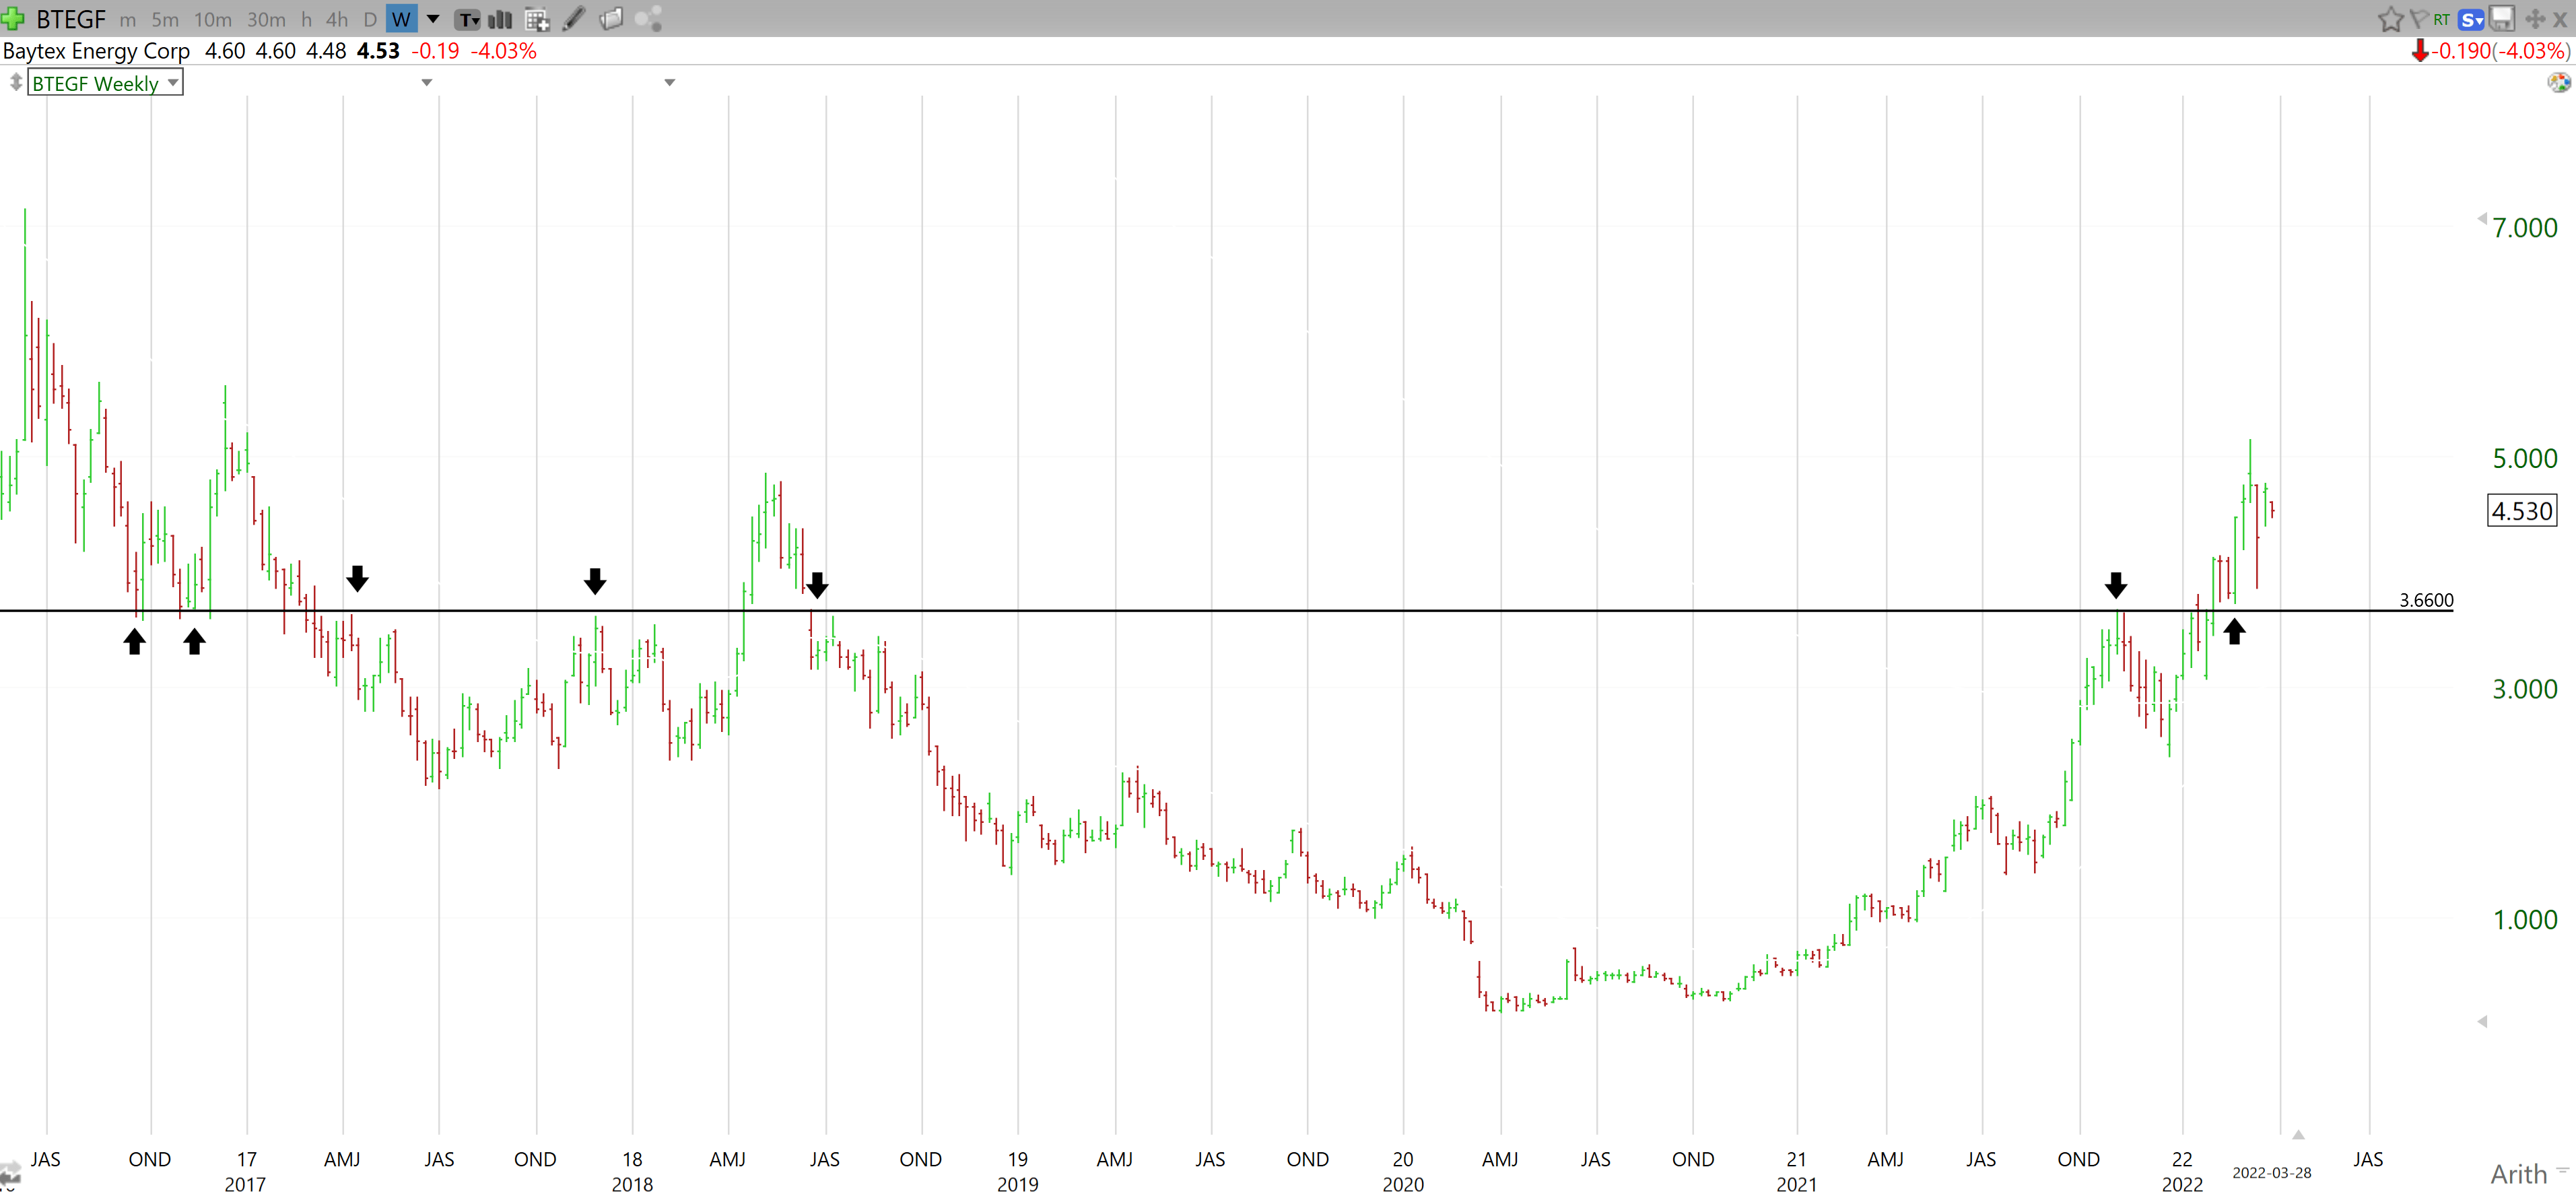
If you wanted to keep the stop a bit tighter or your position isn’t up a couple of hundred percent, I would look at using $4.13. Looking below we can see that there is clearly support here, but it’s only 8% from current levels and you could get shaken out pretty easily. Yes, you can always buy back in, but it’s easier said than done in names that have torque as Baytex does.
TC2000.com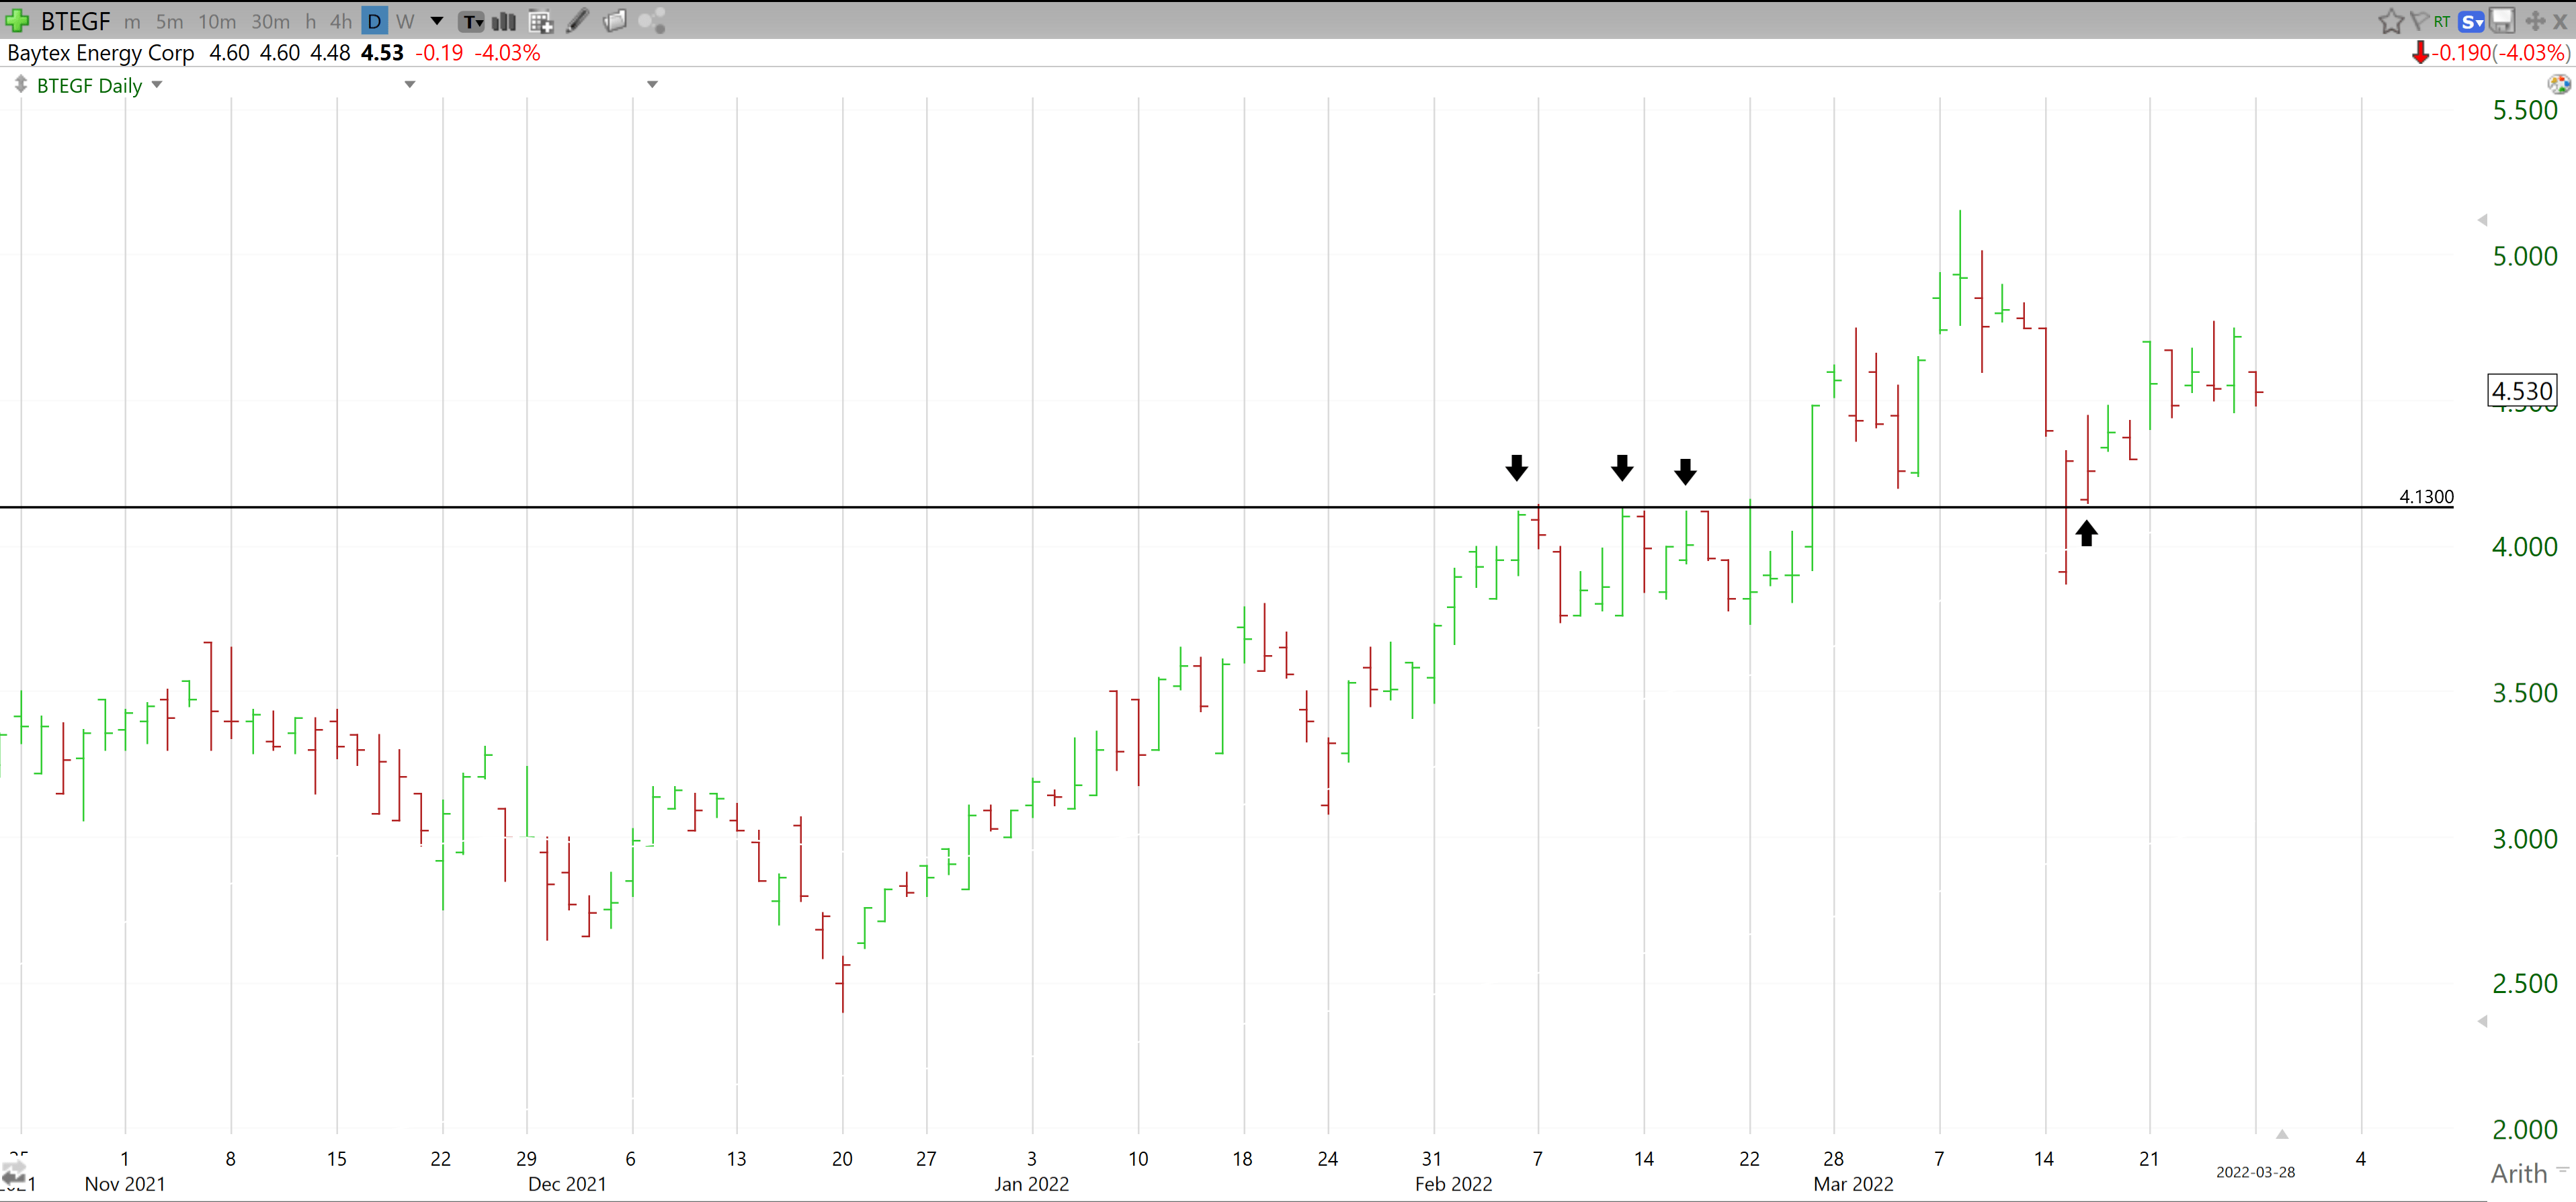
Now for the fun part, and that’s figuring out where this stock could possibly be headed. As I mentioned, most agree it’s undervalued and the finances align with that, but at the end of the day, price is what matters. Many thought this stock wouldn’t see $1.00 again, but it did. The same crowd is going to be shocked when we see $13.00 in the near future. How near? I have no idea. But based on what I wrote earlier, if things continue down this path, sooner than anyone could have thought.
Looking below we can see the first hurdle here is $4.75. We saw a fake breakout, and we need to make another run at this point to get some new momentum going. I would be a buyer on a $4.75 break. The reason being and I apologize for the hard-to-see chart, but it’s hard to see because there isn’t much resistance between there and $13.00. Maybe a little bit in the $6-7 range, and likely a dip around $8.00 as that was the 2008 low. But generally, it’s clear skies. We saw the stock fall ~75% in 2 months back in 2015. We may see the same move, which works out to ~300% back. I would imagine it will take more than 2 months, but as I said, there isn’t a lot of price history there to stop it.
TC2000.com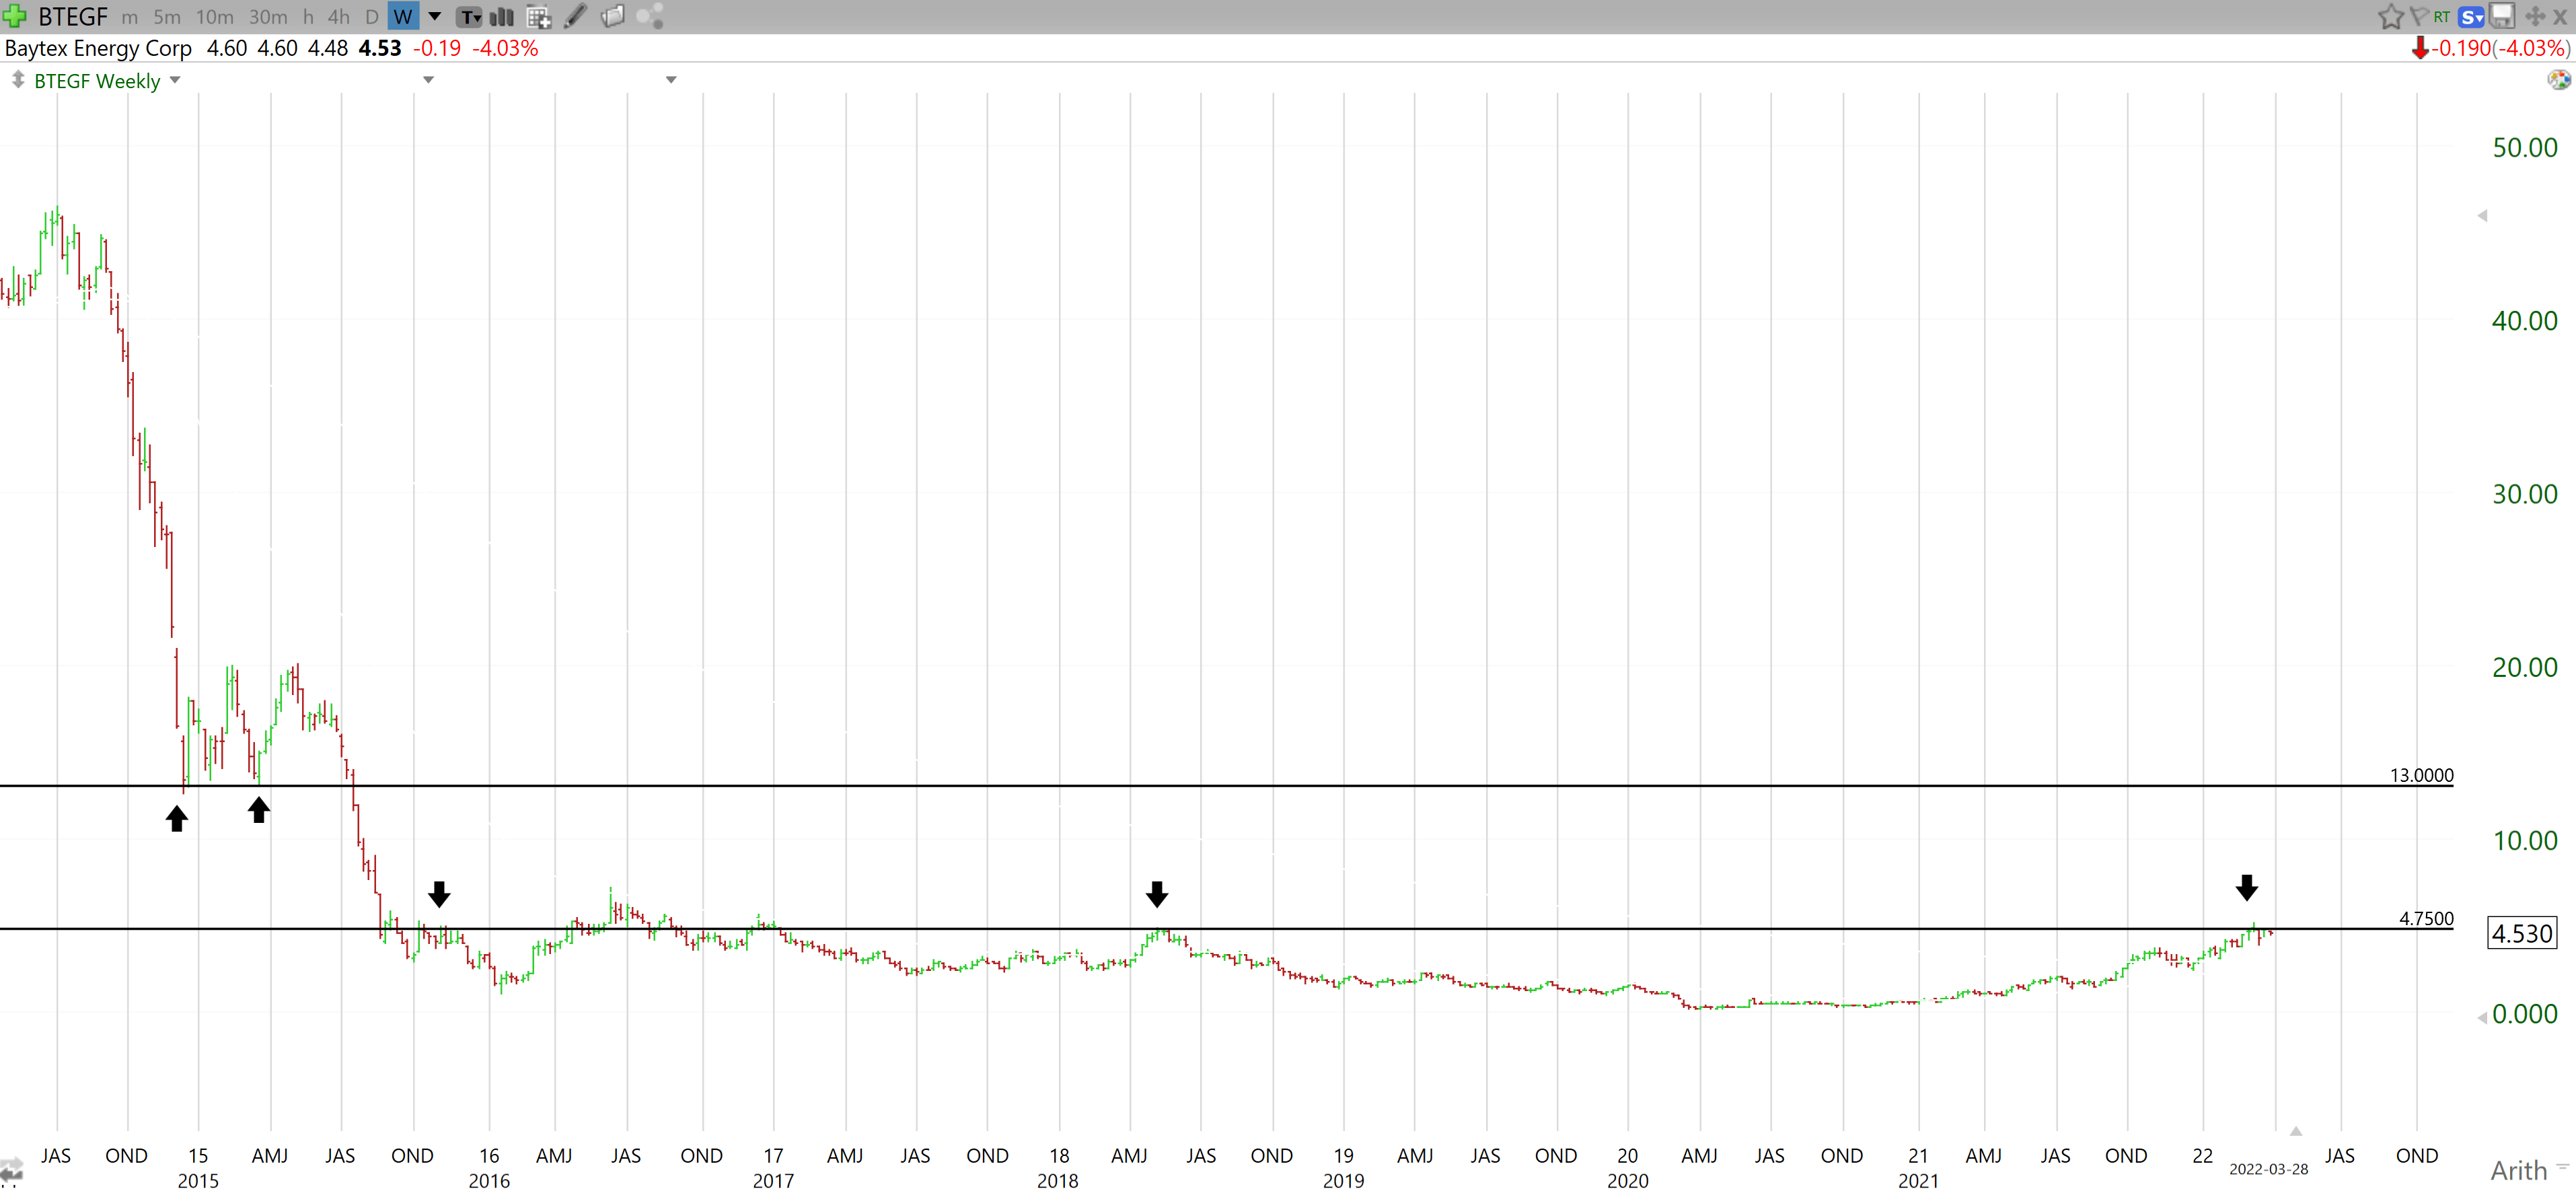
Wrap-Up
As you can see there is a lot to like about what’s going on here. With most of the previous company risk eliminated the new risk is really around the oil price and I remain bullish on that. Free cash flow will continue to pile up and the debt will shrink to a point where it’s insignificant. That will lead to increased buybacks and potentially a new dividend, which should cause the share price to continue to get re-rated. My current mid-term target is $8.00, and my long-term target is $13.00. This turnaround story isn’t over yet!
Be the first to comment