

AlbertPego
The hottest topic of 2022 that everyone can relate to or has had their own personal experience with has undoubtedly been inflation. In August 2022, inflation prices were 8.3% higher compared to a year before according to the Consumer Price Index report. While slower than the prior month when inflation climbed 8.5%, it’s still uncomfortably high for both consumers and policymakers. In an attempt to alleviate this rampant inflation, the Federal Reserve (the ‘Fed’) has raised the federal funds rate by a cumulative 300 bps (3.00%) since April 2022 through the September meeting, with expectations for the Fed to raise it another 75 bps at the upcoming November meeting. For reference, the federal funds rate is the interest rate at which banks must pay to borrow funds from their reserves kept at the Fed on an overnight basis. It is the principal tool that the Fed has to heat up or slow down the economy by attempting to cause a chain reaction where changing short term interest rates eventually flows through to long term interest rates, which then affect economic activity, asset pricing, and risk appetite. Historically, mortgage rates have followed the 10-year Treasury yield, as seen in Figure 1, meaning that the Fed does indeed have an indirect control over mortgage rates.
St. Louis Fed & The Balance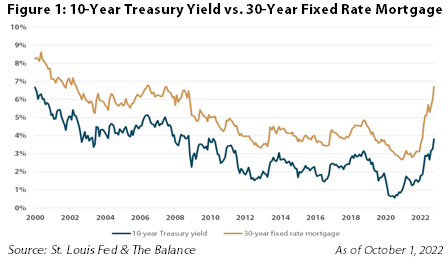
Since the pandemic began in March 2020, the 10-year Treasury yield has been bouncing all over the place, reaching an all-time low of 0.53% in July 2020 and rising to 3.96% as of September 27, 2022. While the recent rise in the 10-year Treasury yield and corresponding 30-year fixed mortgage has been swift, it is important to note that since April 1971, the 10-year Treasury yield and 30-year mortgage rate have averaged 6.03% and 7.79%, respectively, according to Freddie Mac.
With mortgage rates reaching 6.70% this past week, their highest point since the financial crisis in 2008, many would-be buyers are being forced to continue renting. Rising mortgage rates have been the largest factor hampering affordability in the housing market, right alongside the sizable increase in the median existing-home price, rising 7.8% in August 2022 from a year earlier to $389,500, according to the National Association of Realtors.
With housing affordability at its worst levels since 1989 and favorable supply / demand dynamics in place, we believe that residential REITs, both multifamily and single family rentals (‘SFRs’), will be able to: 1) maintain or improve upon already superior occupancy levels given the lack of affordability to move out and purchase a house, 2) capitalize on elevated demand through increased new lease and renewal rates, driving same-store net operating income growth, and lastly, 3) improve the reputation of landlords given the relatively inexpensive pricing versus the alternative of buying a home.
Renting vs. Owning
When an individual is making the decision between renting and buying a home, the most important factor is affordability, which is largely driven by mortgage rates. The average rate on a 30-year fixed mortgage climbed to 6.70% on September 29, 2022, up from 6.29% a week prior and 3.01% a year ago, according to a survey of lenders by mortgage giant Freddie Mac. The following example illustrates the impact of the just how unaffordable buying has gotten this year. With mortgage rates at 3.01% a year ago, if you wanted to spend $2,500/month on a home, you could buy a house that cost $758,572. Now, with mortgage rates at 6.70%, that same monthly payment would get you a house that costs $476,425, a drastic decline of over 37%.
Another proponent pushing individuals towards renting is the lack of inventory available in the housing market. For example, those that were previously considering putting their house on the market for sale have now opted out of doing so in an effort to keep their current mortgage rate locked in place. Similarly, inflation has been increasing building costs for years, hurting homebuilders and thereby lowering the supply of available houses on the market. This pushes up prices for purchase, and further tilts potential buyers toward renting. For example, Invitation Homes (INVH), a REIT focused on SFR properties, reported that it is more affordable to lease one of its homes today than it is to buy in all 16 of its markets by a weighted average savings of almost $700 per month or 24%, according to data from John Burns as of 2Q22. Despite rapid rise in rent over the past 12 months, we anticipate that rents for both multifamily and SFR properties could continue to increase.
Single Family Rentals (SFRs) Subdued Supply
Similar to most economic lectures you might’ve heard, supply and demand still resides as the dominant force in residential real estate. As seen in Figure 2, total housing permits, for both single and multifamily as a percentage of households in INVH’s markets (Western U.S., Sunbelt, and Florida) are lower than the average over the past 41 years due to rising labor and material costs, land scarcity, and regulatory hurdles that have been barriers to supply, according to John Burns Real Estate Consulting.
John Burns Real Estate Consulting & INVH Sept. ’22 Presentation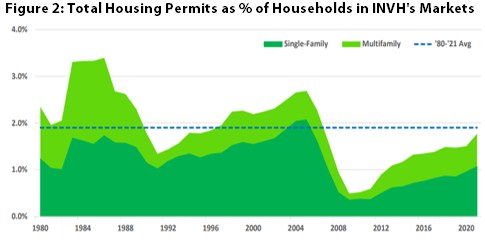
With subdued supply and expected construction likely not enough to solve the country’s housing shortage, SFR fundamentals should continue to benefit over the next few years. While the media has set out to make institutionalized SFRs be the bad guy through ‘taking houses off the market’ and increasing rent, we believe this is not actually the case as these types of SFRs make up only a small fraction of the rental market. As seen in Figure 3, the ownership for the 45 million units that are rented out (~35% of the 130 million U.S. households in total) is heavily skewed to owners of only 1 to 9 units, with those owning 1,000+ units making up only 3%, or 1.35 million units, of total SFR ownership. In addition, these institutional owners are able to provide residents a higher quality service through proactive visits by in-house techs, expertise across all of its markets, and ultimately, a more affordable price due to their scale and density.
John Burns Real Estate Consulting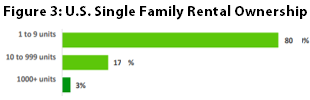
Single Family Rentals Seeing Robust Demand
On the other end of the supply / demand spectrum, the demand for SFR properties is evident and stronger than ever before with multiple sustained tailwinds leading the way. As seen in Figure 4, American Homes 4 Rent (NYSE: AMH), the second largest publicly traded SFR REIT behind INVH, has extremely strong tilt toward renting in its markets (primarily Sunbelt and the Midwest). On average, rental payments are an estimated ~20% cheaper compared to monthly home ownership across its top 20 markets.
John Burns Real Estate Consulting & AMH Sept. ’22 Presentation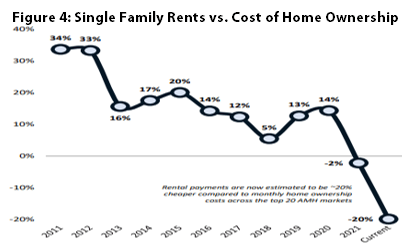
Another demand driver for SFRs is the population growth in the 35 to 49 year old age cohort – the prime age for single family homes. As seen in Figure 5, the projected population for those aged 35 to 49 years old is expected to grow at a >1.0% pace over the next seven years, significantly more than the population growth expected in the 20 to 34 year old age cohort, according to the U.S. Census.
U.S. Census & AMH Sept. ’22 Presentation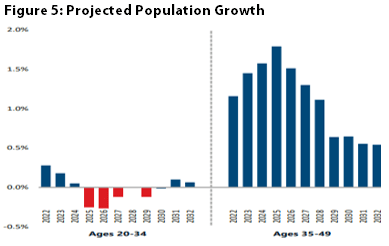
Additionally, as seen in Figure 6, the pandemic accelerated migration trends to the Sunbelt area, with notable move-outs from the Northeast and Southern California. In particular, there has been a large influx into the Texas Triangle, Phoenix, and Northern / Central Florida, where a large portion of both AMH and INVH footprint is located.
U.S. Census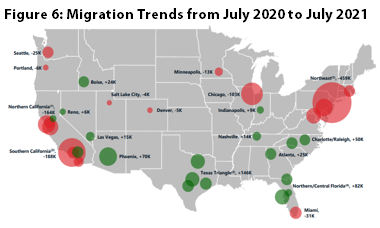
Even with these overwhelmingly positive trends paving the way for future success, SFRs have performed notably well over the past year. AMH was able to grow rent by +9.3% year-over-year (+14.2% for new leases and +7.4% for renewals) for 2Q22 while INVH has been able to grow rent even more at 11.8% year-over-year (+16.7% for new leases and +10.2% for renewals) for 2Q22. Going forward, we believe the near-term fundamentals are solid for the SFR sector with net operating income (or ‘NOI’, calculated as rental income minus operating expenses) growth well ahead of most commercial real estate sectors over the next few years. While headline and political risks could become prevalent through the upcoming mid-term elections and provide regulatory issues, SFR REITs could simultaneously prove to be the beneficiary of other regulatory / political side effects such as taxation pushing corporations and individuals into the Sunbelt where SFR REITs are predominantly located.
Multifamily Supply is High but Necessary
Similar to SFRs, multifamily is primarily driven by the unavoidable forces of supply and demand. In contrast to single family units, multifamily starts have remained well above their historical average with ~850,000 units currently under construction as seen in Figure 7. While expanding capitalization rates and more costly construction financing has pressured development economics on the margin, operating fundamentals and profit margins are still attractive enough to incentivize well capitalized builders / owners, including the majority of multifamily REITs, to put shovels in the ground.
Census Bureau & Green Street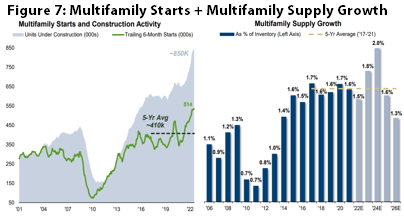
Another important trend to highlight is the regional divergences in permitting activity between the Sun-Belt and Coastal markets that has notably widened since early 2021. As seen in the graph on the left-hand side of Figure 8, the Sunbelt less Coastal market spread of permits as a percent of inventory is notably higher than the five-year average spread between the two markets (~130 bps). In contrast, coastal markets are expected to experience flat to moderating supply growth, particularly along the West Coast. Despite the highest supply growth occurring in the Sunbelt, cities such as Dallas, Phoenix, and Atlanta are expected to gain the highest number of jobs over the next three years, according to Witten Advisors.
Overall, while we acknowledge that supply has undoubtedly been elevated, we feel that this elevation is necessary to meet the ongoing and increasing demand that has blossomed with young adults (18 to 34 years of age). This cohort is choosing to delay decisions to marry, have children, and purchase homes (especially with mortgages rates at >6%), opting instead to rent for longer. As evidence of this trend, Camden Property Trust (NYSE: CPT) reported its 2Q22 move-out rate for home purchases was notably low at 15.1%, which compares to 17.7% during the same period a year prior.
Census Bureau, Oxford, & Green Street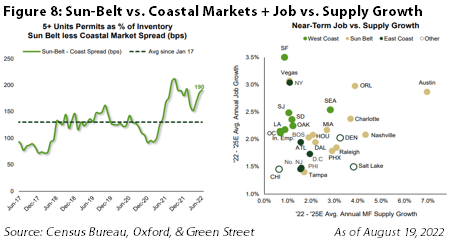
Multifamily Demand Has Been Strong
With regards to multifamily demand, think Tom Brady in the 4th quarter of Super Bowl 51 (the famous “28 to 3” game against the Atlanta Falcons in NRG stadium). Tom was down by 25 points with less than 20 minutes of gameplay to go (comparable to peak pandemic) and eventually came back to defeat the Falcons in the largest comeback in Super Bowl history (representative of 2Q22 apartment REIT earnings season, the largest “comeback quarter” in apartment REIT history). More simply put, apartment REITs generated outstanding blended rate growth (weighted average of new lease and renewal rates) in the second quarter of 2022 with same-store rent up ~15% on average and occupancy levels greater than 96% across the board. This compares to negative rent growth and lower occupancy (~95%) during the same period a year prior. Additionally, as same-store revenue well out-paced expense growth, same-store net operating income (‘SSNOI’) grew at record levels as well. Equity Residential (NYSE: EQR), a coastal-focused apartment REIT, reported SSNOI of +19.1% in 2Q22 with its peers (AVB, CPT, and ESS) closely following with SSNOI growth of >+16.0% each as well.
Looking forward, strength in the back half of 2022 continues to be broad-based between both coastal and Sun Belt REITs. However, when looking ahead to 2023, we believe coastal REITs are likely to outperform on a SSNOI and revenue growth basis as they face relatively easier comps and subdued levels of supply relative to their Sun Belt peers. Nonetheless, cumulative growth in the Sun Belt since the pandemic from job creation and migration trends should prove to more than enough to offset the sizable supply increases forthcoming over the next few years. All in all, while deceleration of rent growth is expected (and already present as seen in some operating updates for July and August 2022), we feel that rent growth will be able to remain strong over the next year given the ability / propensity to own continually declining, an uncoupling of young adults from their parents homes, and an average rent-to-income ratio of approximately ~19% to 21% across apartment REITs. Even with 0% change in market rents, most multifamily REITs will get same store revenue growth of 4-5% in 2023 merely from leasing units to current market rent. Applying an average NOI margin of ~68%, SSNOI growth could approach 8-10% in 2023, which would still be one of its best years ever.
Conclusion
With interest rates rising at the fastest pace in years, inflation running rampant for the first time in many of our lives, and economic data suggesting that we are headed towards a recession, how could we possibly be excited about public residential REITs? In short, there is no alternative. Housing affordability is at its worst level since 1989 and individuals are essentially forced to rent for longer.
From a valuation perspective, residential REITs are trading at an average ~18.2x multiple to 2022 consensus FFO as of September 22, 2022, which compares to the 12/31/2021 FFO multiple of 27.2x and the 20-year average of ~17.4x. Residential REITs are trading at a 21% discount to what their properties would sell for on the private market as of September 30, 2022. In addition, they have debt leverage of only 19.7%, a weighted average debt maturity of 7.2 years and 95.4% of their debt fixed or hedged. In conclusion, the lack of affordability, along with the flexible balance sheets, attractive valuations, and favorable supply and demand dynamics across both multifamily and SFR REITs gives us confidence that our 28.1% allocation within the residential sector of the Chilton REIT Composite (vs. the 19.9% in the MSCI U.S. REIT Index, Bloomberg RMZ) is well positioned for the uncertainty of this economic environment.
Be the first to comment