

alphaspirit/iStock via Getty Images
By Sandrine Soubeyran, Director Research & Analytics, FTSE Russell
Evidence of growing concerns over high inflation, rate hikes and central banks withdrawing their asset purchasing support programmes has been particularly visible in European bond markets.
For corporate bonds, this can be observed by looking at the spreads of European investment grade and high yield bonds versus German 7-10yr government bonds. As Chart 1 shows, after their initial spikes in March 2020 from the coronavirus shock, the spreads of European investment grade and high yield credits significantly compressed as central banks implemented broad QE programmes (including for the sub-IG high yield sector) and interest rate cuts to ease financial conditions. Despite the deteriorating economic outlook, they remained stable during much of the pandemic. However, as economic growth started to improve with the lifting of lockdowns, corporate bond markets became increasingly nervous by the prospect of the unravelling of easing policies, and supply chain disruptions and rising energy prices stoking inflation. This caused spreads to widen in the last months of 2021 and into 2022.
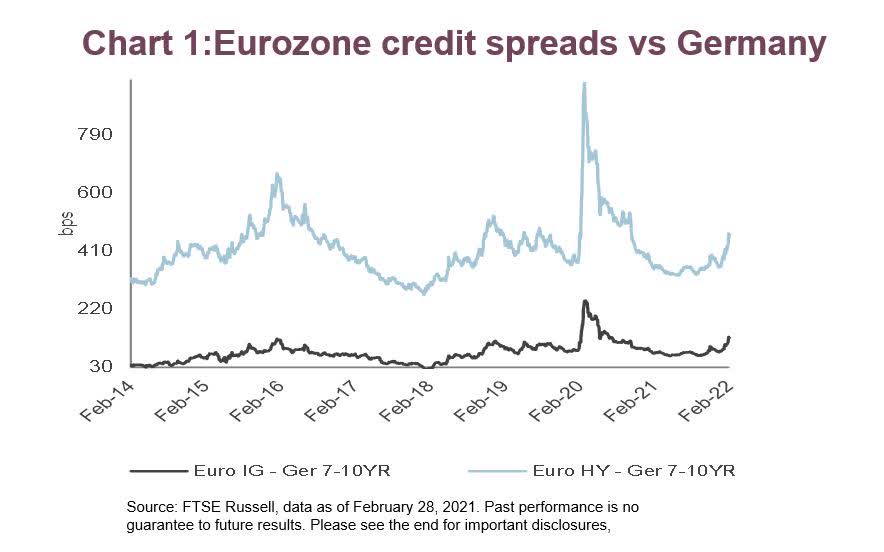
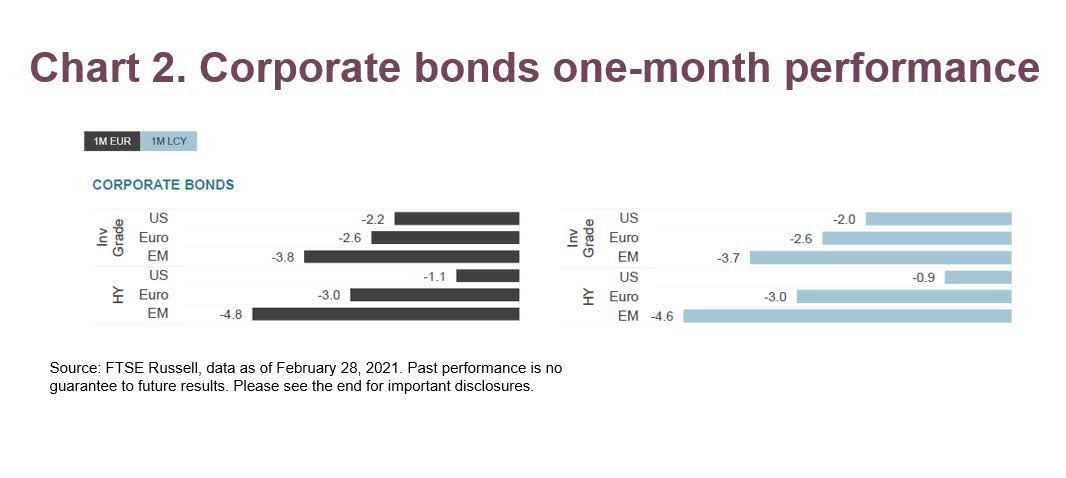
The back-up in yields was most noticeable in February 2022, when general risk-off sentiment over the tensions in Europe, which were escalating throughout February, affected risk assets, particularly in sub-IG credits, whose sell-off mostly mirrored that of European equity markets. European high yield credit posted a negative return of 3% in euro terms, compared to a loss of 1.1% for their US high yield equivalents, while the FTSE Europe ex UK declined by 5.4%.
However, the back-up in yield did not just affect corporate bonds
Similarly to their corporate bond equivalents, peripheral European government bonds have also seen their yields rise sharply. But the story here may have a further dimension. Using Italy as a case in point, the EU’s phasing out of its Pandemic Emergency Purchase Programme (PEPP) in March 2022 combined with anticipated rates hikes have also revived sovereign credit fears.
Let’s recall 2018. European markets were really spooked when the EU had placed Italy on its watch list of countries for not complying with its debt reduction programme to correct excessive public debt burdens. Italian 10-year government bond (BTPs) yields rose sharply during this period (and more so than their Spanish equivalents), with their spreads vs 7-10yr Bunds widening to near 315bps (Chart 3). The EU’s Stability and Growth Pact says that a state’s budget deficit cannot exceed 3% of GDP and its national debt cannot surpass 60% of GDP. Italy’s debt per GDP of around 135% had reached one of the highest levels within the Eurozone. At the same time, the lack of progress in forming a stable coalition government added fuel to fire. Eventually, EU support and improving economic growth calmed markets.
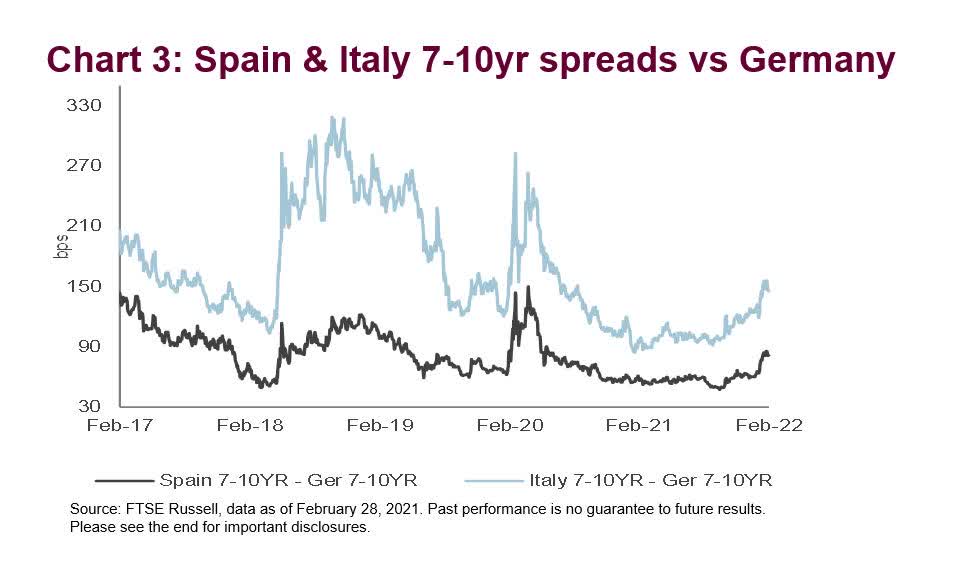
Similarly in March 2020, BTP vs Bund spreads spiked up to reach 280bp (Chart 3) during the initial Covid-19 shock. The EU responded in March 2020 with PEPP to provide liquidity and ease financial conditions, not for just Italy, but for the whole of the Eurozone. Like for European corporates, the central bank action promptly calmed markets as the 7-10y BTP and Bund spreads contracted within 100bp. However, the size of Italy’s debt per GDP grew to a much higher level of 156% and has stayed at this level since.
Where does this leave us? With the ECB in tightening mode and a historically high debt per GDP level, the question is how long before European investors really notice?
© 2022 London Stock Exchange Group plc and its applicable group undertakings (the “LSE Group”). The LSE Group includes (1) FTSE International Limited (“FTSE”), (2) Frank Russell Company (“Russell”), (3) FTSE Global Debt Capital Markets Inc. and FTSE Global Debt Capital Markets Limited (together, “FTSE Canada”), (4) FTSE Fixed Income Europe Limited (“FTSE FI Europe”), (5) FTSE Fixed Income LLC (“FTSE FI”), (6) The Yield Book Inc (“YB”) and (7) Beyond Ratings S.A.S. (“BR”). All rights reserved.
FTSE Russell® is a trading name of FTSE, Russell, FTSE Canada, FTSE FI, FTSE FI Europe, YB and BR. “FTSE®”, “Russell®”, “FTSE Russell®”, “FTSE4Good®”, “ICB®”, “The Yield Book®”, “Beyond Ratings®” and all other trademarks and service marks used herein (whether registered or unregistered) are trademarks and/or service marks owned or licensed by the applicable member of the LSE Group or their respective licensors and are owned, or used under licence, by FTSE, Russell, FTSE Canada, FTSE FI, FTSE FI Europe, YB or BR. FTSE International Limited is authorised and regulated by the Financial Conduct Authority as a benchmark administrator.
All information is provided for information purposes only. All information and data contained in this publication is obtained by the LSE Group, from sources believed by it to be accurate and reliable. Because of the possibility of human and mechanical error as well as other factors, however, such information and data is provided “as is” without warranty of any kind. No member of the LSE Group nor their respective directors, officers, employees, partners or licensors make any claim, prediction, warranty or representation whatsoever, expressly or impliedly, either as to the accuracy, timeliness, completeness, merchantability of any information or of results to be obtained from the use of FTSE Russell products, including but not limited to indexes, data and analytics, or the fitness or suitability of the FTSE Russell products for any particular purpose to which they might be put. Any representation of historical data accessible through FTSE Russell products is provided for information purposes only and is not a reliable indicator of future performance.
No responsibility or liability can be accepted by any member of the LSE Group nor their respective directors, officers, employees, partners or licensors for (A) any loss or damage in whole or in part caused by, resulting from, or relating to any error (negligent or otherwise) or other circumstance involved in procuring, collecting, compiling, interpreting, analysing, editing, transcribing, transmitting, communicating or delivering any such information or data or from use of this document or links to this document or (B) any direct, indirect, special, consequential or incidental damages whatsoever, even if any member of the LSE Group is advised in advance of the possibility of such damages, resulting from the use of, or inability to use, such information.
No member of the LSE Group nor their respective directors, officers, employees, partners or licensors provide investment advice and nothing in this document should be taken as constituting financial or investment advice. No member of the LSE Group nor their respective directors, officers, employees, partners or licensors make any representation regarding the advisability of investing in any asset or whether such investment creates any legal or compliance risks for the investor. A decision to invest in any such asset should not be made in reliance on any information herein. Indexes cannot be invested in directly. Inclusion of an asset in an index is not a recommendation to buy, sell or hold that asset nor confirmation that any particular investor may lawfully buy, sell or hold the asset or an index containing the asset. The general information contained in this publication should not be acted upon without obtaining specific legal, tax, and investment advice from a licensed professional.
Past performance is no guarantee of future results. Charts and graphs are provided for illustrative purposes only. Index returns shown may not represent the results of the actual trading of investable assets. Certain returns shown may reflect back-tested performance. All performance presented prior to the index inception date is back-tested performance. Back-tested performance is not actual performance, but is hypothetical. The back-test calculations are based on the same methodology that was in effect when the index was officially launched. However, back-tested data may reflect the application of the index methodology with the benefit of hindsight, and the historic calculations of an index may change from month to month based on revisions to the underlying economic data used in the calculation of the index.
This document may contain forward-looking assessments. These are based upon a number of assumptions concerning future conditions that ultimately may prove to be inaccurate. Such forward-looking assessments are subject to risks and uncertainties and may be affected by various factors that may cause actual results to differ materially. No member of the LSE Group nor their licensors assume any duty to and do not undertake to update forward-looking assessments.
No part of this information may be reproduced, stored in a retrieval system or transmitted in any form or by any means, electronic, mechanical, photocopying, recording or otherwise, without prior written permission of the applicable member of the LSE Group. Use and distribution of the LSE Group data requires a licence from FTSE, Russell, FTSE Canada, FTSE FI, FTSE FI Europe, YB, BR and/or their respective licensors.
Editor’s Note: The summary bullets for this article were chosen by Seeking Alpha editors.
Be the first to comment