


ismagilov/iStock via Getty Images
With the CPI at a 40-year high, inflationary hedges are in high demand. Buying commodities is a good idea. But as markets are also bracing for a recession, not all commodities perform equally well. This opens the opportunity for a very simple, but interesting pair trade: As both gold and oil equally share in price appreciation driven by inflation, oil generally depreciates in a recessionary environment, while gold doesn’t.
There is also a structural argument attached to the long gold/short oil thesis. As Bitcoin and crypto assets lose appeal as safe-haven assets, gold sees resurging investor interest. At the same time, fossil fuels see declining demand long-term, as renewable energies gain market share.
Thus, long gold and short oil could be a highly interesting pair trade opportunity that hedges investors both against a potential recession and ongoing inflation.
To express the pair trade most effectively, I think a long position in Newmont Gold (NYSE:NEM) and a short position in Exxon (NYSE:XOM) is adequate. Interestingly, in the past recessions, early 2000 crash and financial crisis, NEM outperformed XOM materially.
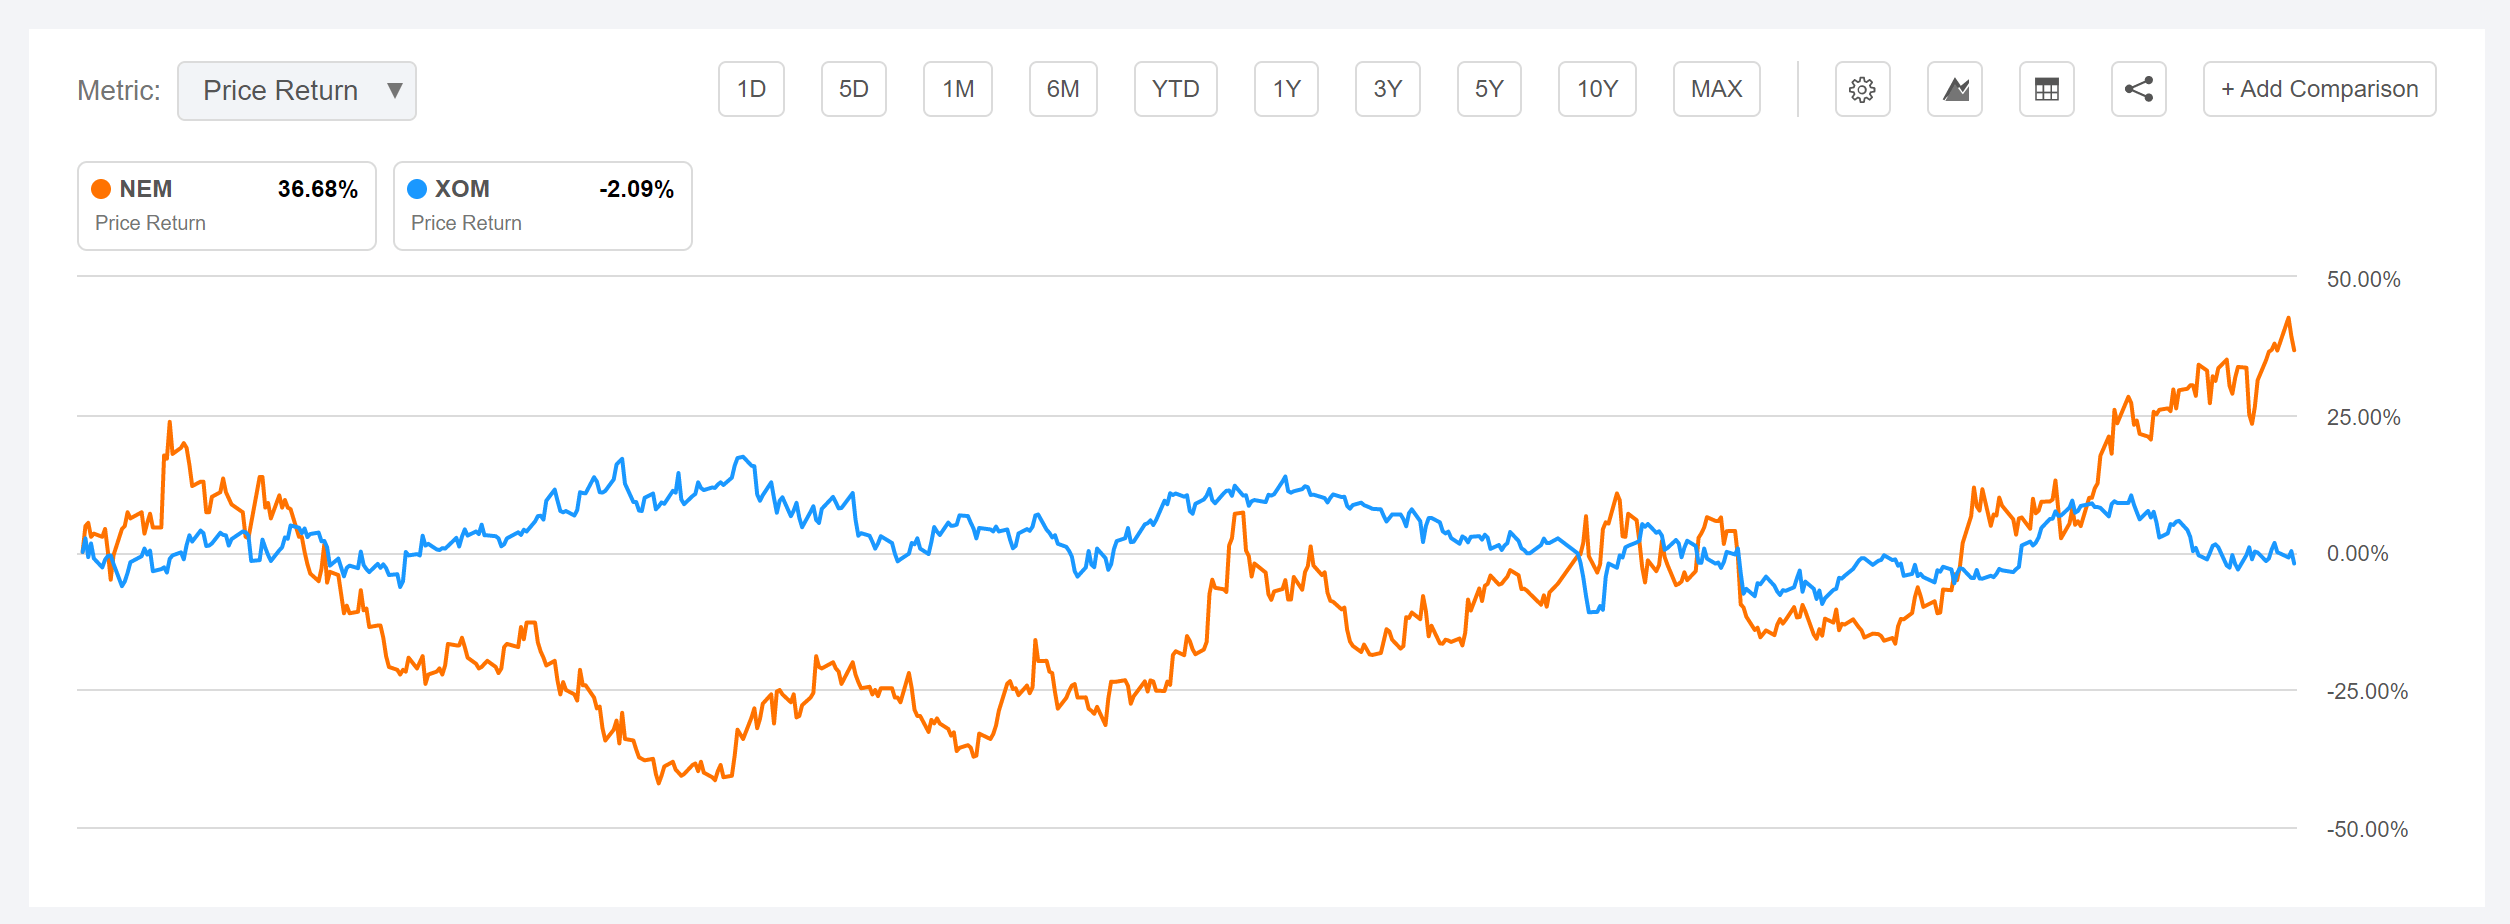
Dot-Com Crash induced recession (March 2000 – mid/late 2002)
NEM is up 36% vs – 2% for XOM.
Seeking Alpha
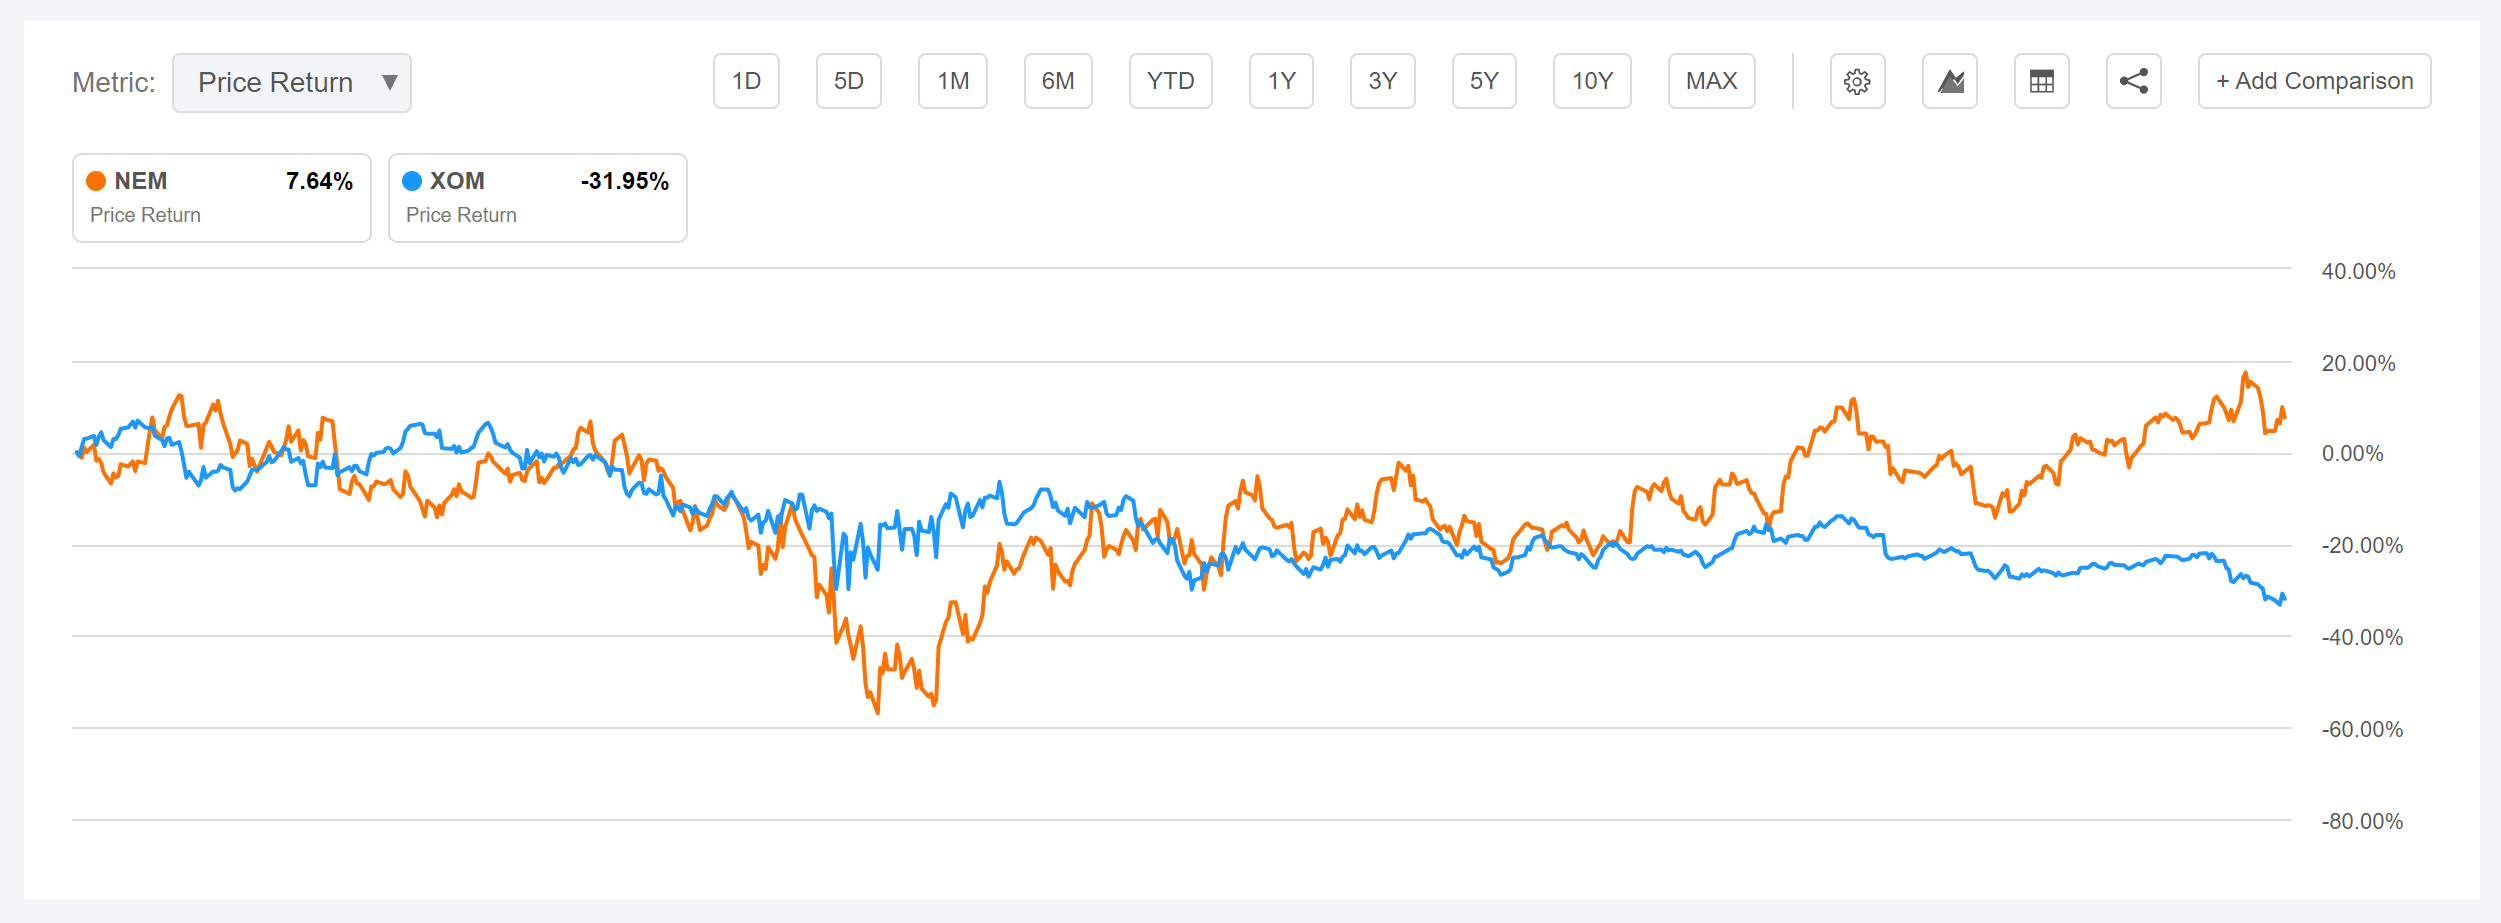
Financial Crisis (December 2007 – May 2010)
NEM is up 7% vs – 31% for XOM.
Seeking Alpha
Buy Newmont
I believe Newmont Gold is well positioned to play the long-bias on gold, as the company is the world’s leading gold miner — with additional commodity diversification in copper, silver, zinc. Moreover, Newmont owns high-quality assets with a total gold reserve of 96 MOZ in North America, South America, Australia and Africa. Based on a XAU/USD price of 1,800, this reserve would be valued at $180 billion. Notably, Newmont is the only mining company listed in the S&P 500.
Financially, Newmont is doing well–especially in a recessionary environment. In 2012 during the European Debt Crisis the company generated net-income attributable to shareholders of $1.88 billion. In 2020 during Covid, Newmont generated net-income of $2.67 billion
Notably, gold futures currently trade at $1,827/ounce. Newmont guided the midpoint for the company’s all-in sustaining cost (AISC) at $970/ounce by 2024. This implies almost a 100% spread between the company’s costs and market price. Furthermore, at approximately $1,800/ounce, Newmont’s dividend framework should return between $1.5 billion to $2 billion in payouts to investors annually.
NEM Valuation
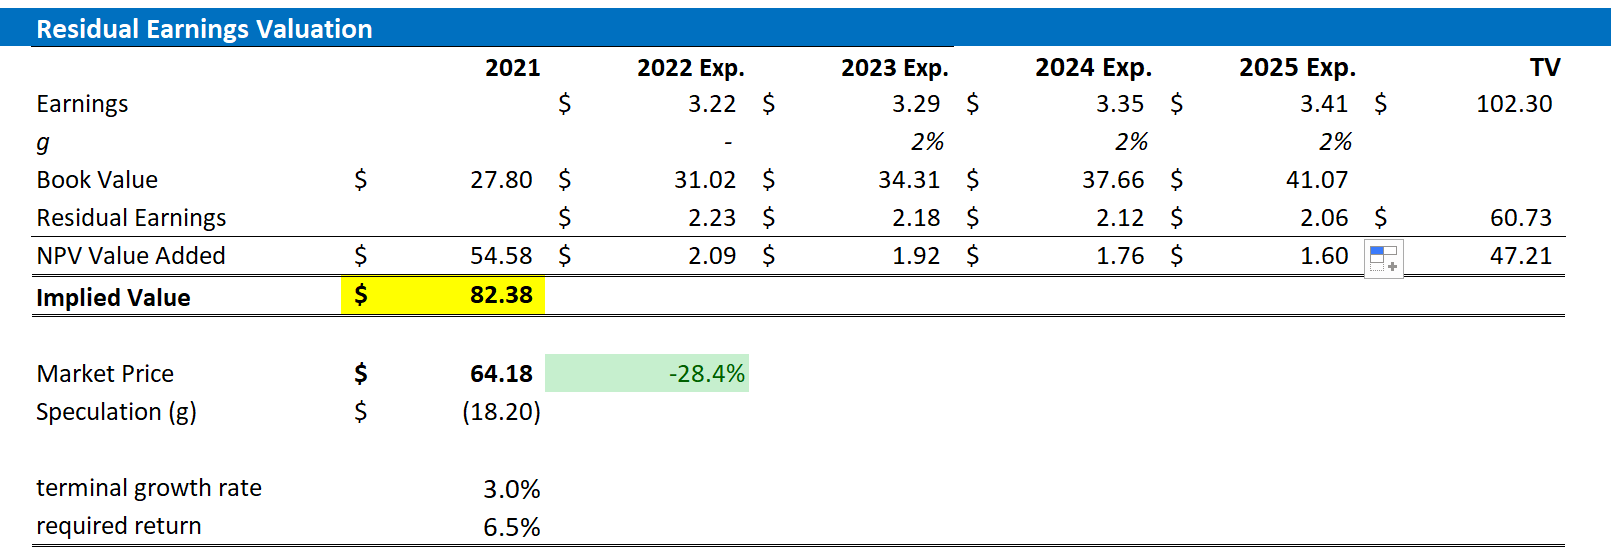
To value NEM, I propose using a residual earnings framework based on the analyst consensus EPS forecast for ’till 2025. Furthermore, I anchor on a 6.5% cost of capital and a TV growth rate equal to nominal GDP growth. For 2022, 2023 and 2024 analyst consensus indicates EPS of $3.22, $3.29 and $3.35–according to the Bloomberg Terminal as of June 2022. The cost of capital at 9% is based on a basic WACC calculation. The TV growth approximately and cautiously reflects NEM’s long-term growth expectations, in line with past performance.
Based on the above assumptions, my valuation estimates a fair share price of $82.38/share, implying approximately 30% upside for the stock.
Analyst Consensus; Author’s Calculation
Short Exxon Mobil
Exxon Mobil has significantly outperformed the S&P in 2022, being up 40% YTD vs -20% for the S&P. However, the stock now trades at very rich valuations — especially when compared to European peers such as Total Energies or Royal Dutch Shell. In my opinion, the market is pricing earnings which are not sustainable. While the current energy crisis certainly added a tailwind to the company’s fundamentals, the long-term trend in energy does not favor Exxon’s fossil fuel portfolio.
On a short term basis, I see the oil price pulling back to the $80s, given a recessionary market outlook–compressing XOM’s margins. On a long term basis, I see Exxon as a structurally shrinking business that will more or less be “forced” to lose market share to renewable energy sources, given government policies, funding constraint and societal trends.
XOM Valuation
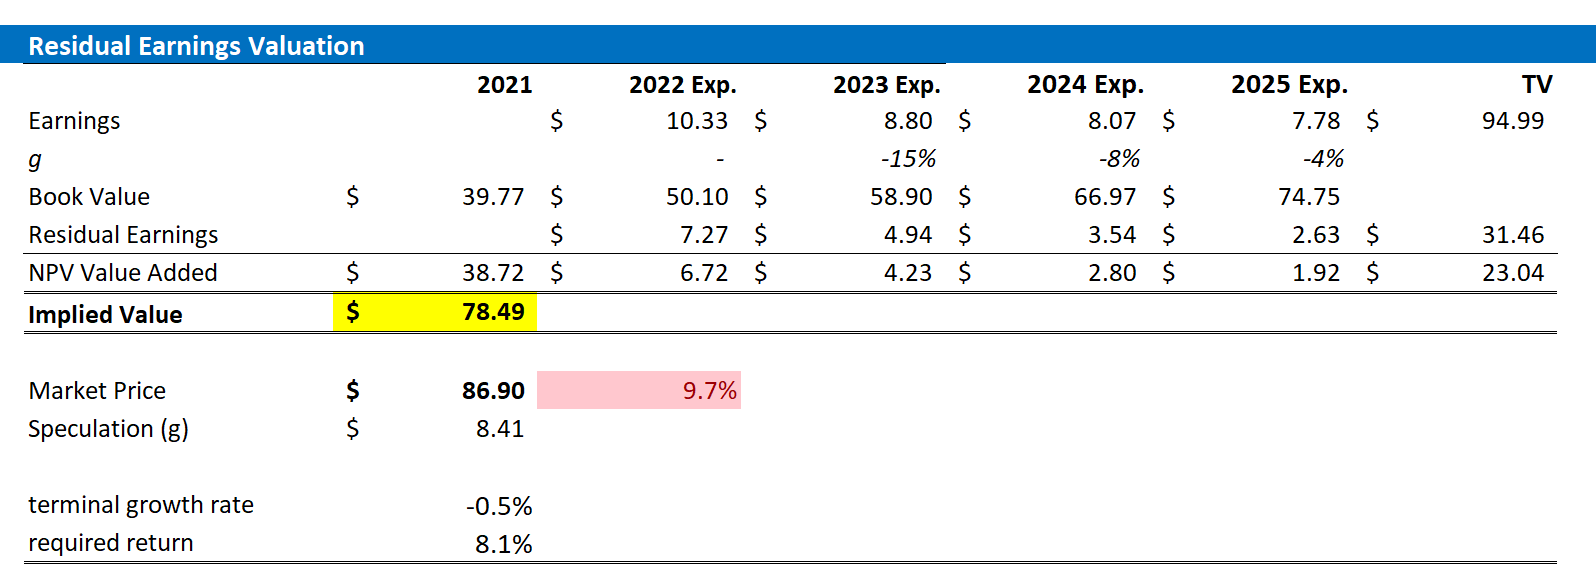
To aid comparison, I propose to use the same valuation framework for Exxon as for Newmont and anchor on the parallel assumptions. That said, I have constructed a Residual Earnings framework based on the analyst consensus forecast for EPS till 2025 (Source: Bloomberg Terminal, June 2022), cost of capital of 8.1% and a TV growth rate equal to -0.5%. For 2022, 2023 and 2024 analyst consensus indicates EPS of $10.33, $8.80 and $8.07. The cost of capital at 8.1% is in line with the WACC calculation, and the TV growth reflects a structurally shrinking market for fossil fuel energy sources, including a depreciating oil price.
Based on the above assumptions, my valuation estimates a fair share price of $78.49/share, implying that the stock currently trades at a 10% premium.
Analyst Consensus; Author’s Calculations
Risks To Watch
Both Newmont and Exxon are exposed to similar risk categories—although in varying degree and likelihood. First, as commodity explorers and producers, both companies are significantly exposed to their respective commodity movements. Personally, however, I see upside movement for NEM and downside for oil, due to the recession thesis. Also, oil is generally much more volatile than gold. Secondly, both companies are exposed to regulatory environment and ESG compliance. Again, NEM appears to be in a much better position than XOM, as global policymakers are working hard to fight fossil fuel exploration/production. Finally, both XOM and NEM are exposed to competition and operational risk. That said, if any of the above factors turns out to develop more or less favorably than expected and modelled by analysts, the shares could deviate from their respective target price.
Conclusion
I see a long position in Newmont and a short position in Exxon as a highly effective pair trade idea to both hedge against inflation and protect against a recession. History supports the attractiveness of the trade, and the numbers/valuation justify the thesis. Given a residual earnings framework, I calculate 30% upside for Newmont and 10% downside for Exxon.
Be the first to comment