

Gold, US Treasury Yields, Summary of Economic Projections, FOMC – Talking Points:
- The recovery in gold prices hangs in the balance as attention turns to the upcoming FOMC meeting.
- An upwardly revised Fed Funds dot plot could trigger extensive selling.
- However, hinting at the possibility of YCC or Operation “Twist” could underpin the anti-fiat metal.
Gold prices have crept cautiously higher since falling to 9-month lows on March 8, as the rapid sell-off in US Treasury markets subsided on the back of lacklustre February inflation data.
The core inflation rate dipped unexpectedly to 1.3% last month, while headline inflation held steady at 1.7%. This disappointing release cooled bets that the Federal Reserve will have to begin normalizing its monetary policy settings earlier-than-expected and took some steam out of the recent rally in bond yields.
However, the passing of President Joe Biden’s $1.9 trillion coronavirus-relief package, in tandem with the rapid distribution of Covid-19 vaccines, has stoked recovery optimism and may continue to underpin yields in the near term. Bullion’s peak in August of 2020 appears to have coincide with US 30-year yields bottoming out, which suggests that gold prices may remain under pressure if long-term rates extend gains.
Additionally, the Federal Reserve’s lack of concern surrounding the marked sell-off in Treasuries could spell trouble for gold bulls, with Chairman Jerome Powell failing to hint at any impending action from the central bank in his comments on March 4.
Gold Price vs US 30-Year Treasury Yields
Chart created using Tradingview
With that in mind, the upcoming Federal Open Market Committee (FOMC) meeting will likely dictate the trajectory of the anti-fiat asset over the coming weeks, with investors focusing intently on the central bank’s Summary of Economic Projections and whether or not policy makers are considering the implementation of Yield Curve Control or Operation “Twist”.
The Fed moving to cap long-term rates through YCC, or selling short-term debt and increasing purchases of longer-term maturities – in what is commonly known as Operation “Twist” – would be inherently bullish for gold prices. However, given the rhetoric from several Federal Reserve members, this seems fairly unlikely.
It also seems fairly unlikely that the Fed Funds rate dot plot will change in any meaningful way. That being said, if the median projection for 2023 were to suggest that the central bank will lift-off from the lower bound, a significant amount of downward pressure is to be expected on gold prices.
The more probable scenario is that the FOMC reiterates that it has a long way to go before achieving its mandated goals, and therefore will keep its monetary policy settings steady. This rather neutral response may open the door for gold to extend its recovery, should yields fail to break significantly higher.
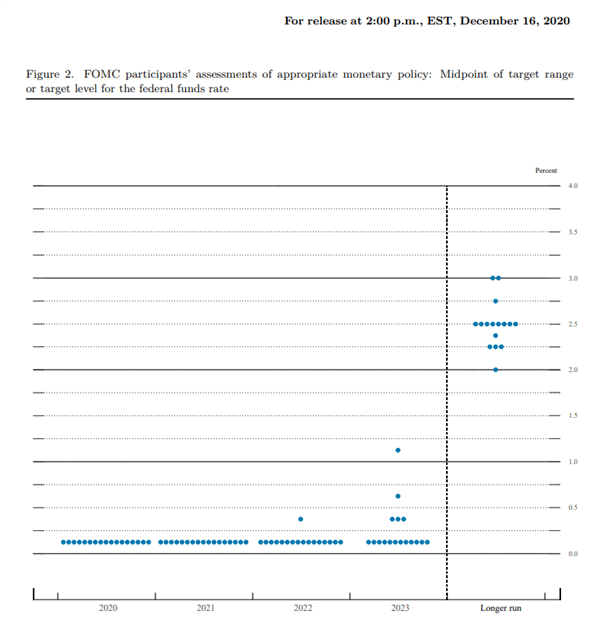
Source – Federal Reserve
Gold Price Daily Chart – 8-EMA Could Guide Price Higher
From a technical perspective, the longer-term outlook for gold remains skewed to the topside, as price continues to track within the confines of a Bull Flag formation.
Indeed, a Bullish Harami reversal pattern above key psychological support at 1680 suggests that Bullion could be poised to extend its recent climb higher.
A weekly close back above the 55-EMA (1773) is probably required to neutralize selling pressure and carve a path for price to challenge the 1800 mark. Breaching that could pave the way for the anti-fiat metal to retest the yearly high (1959).
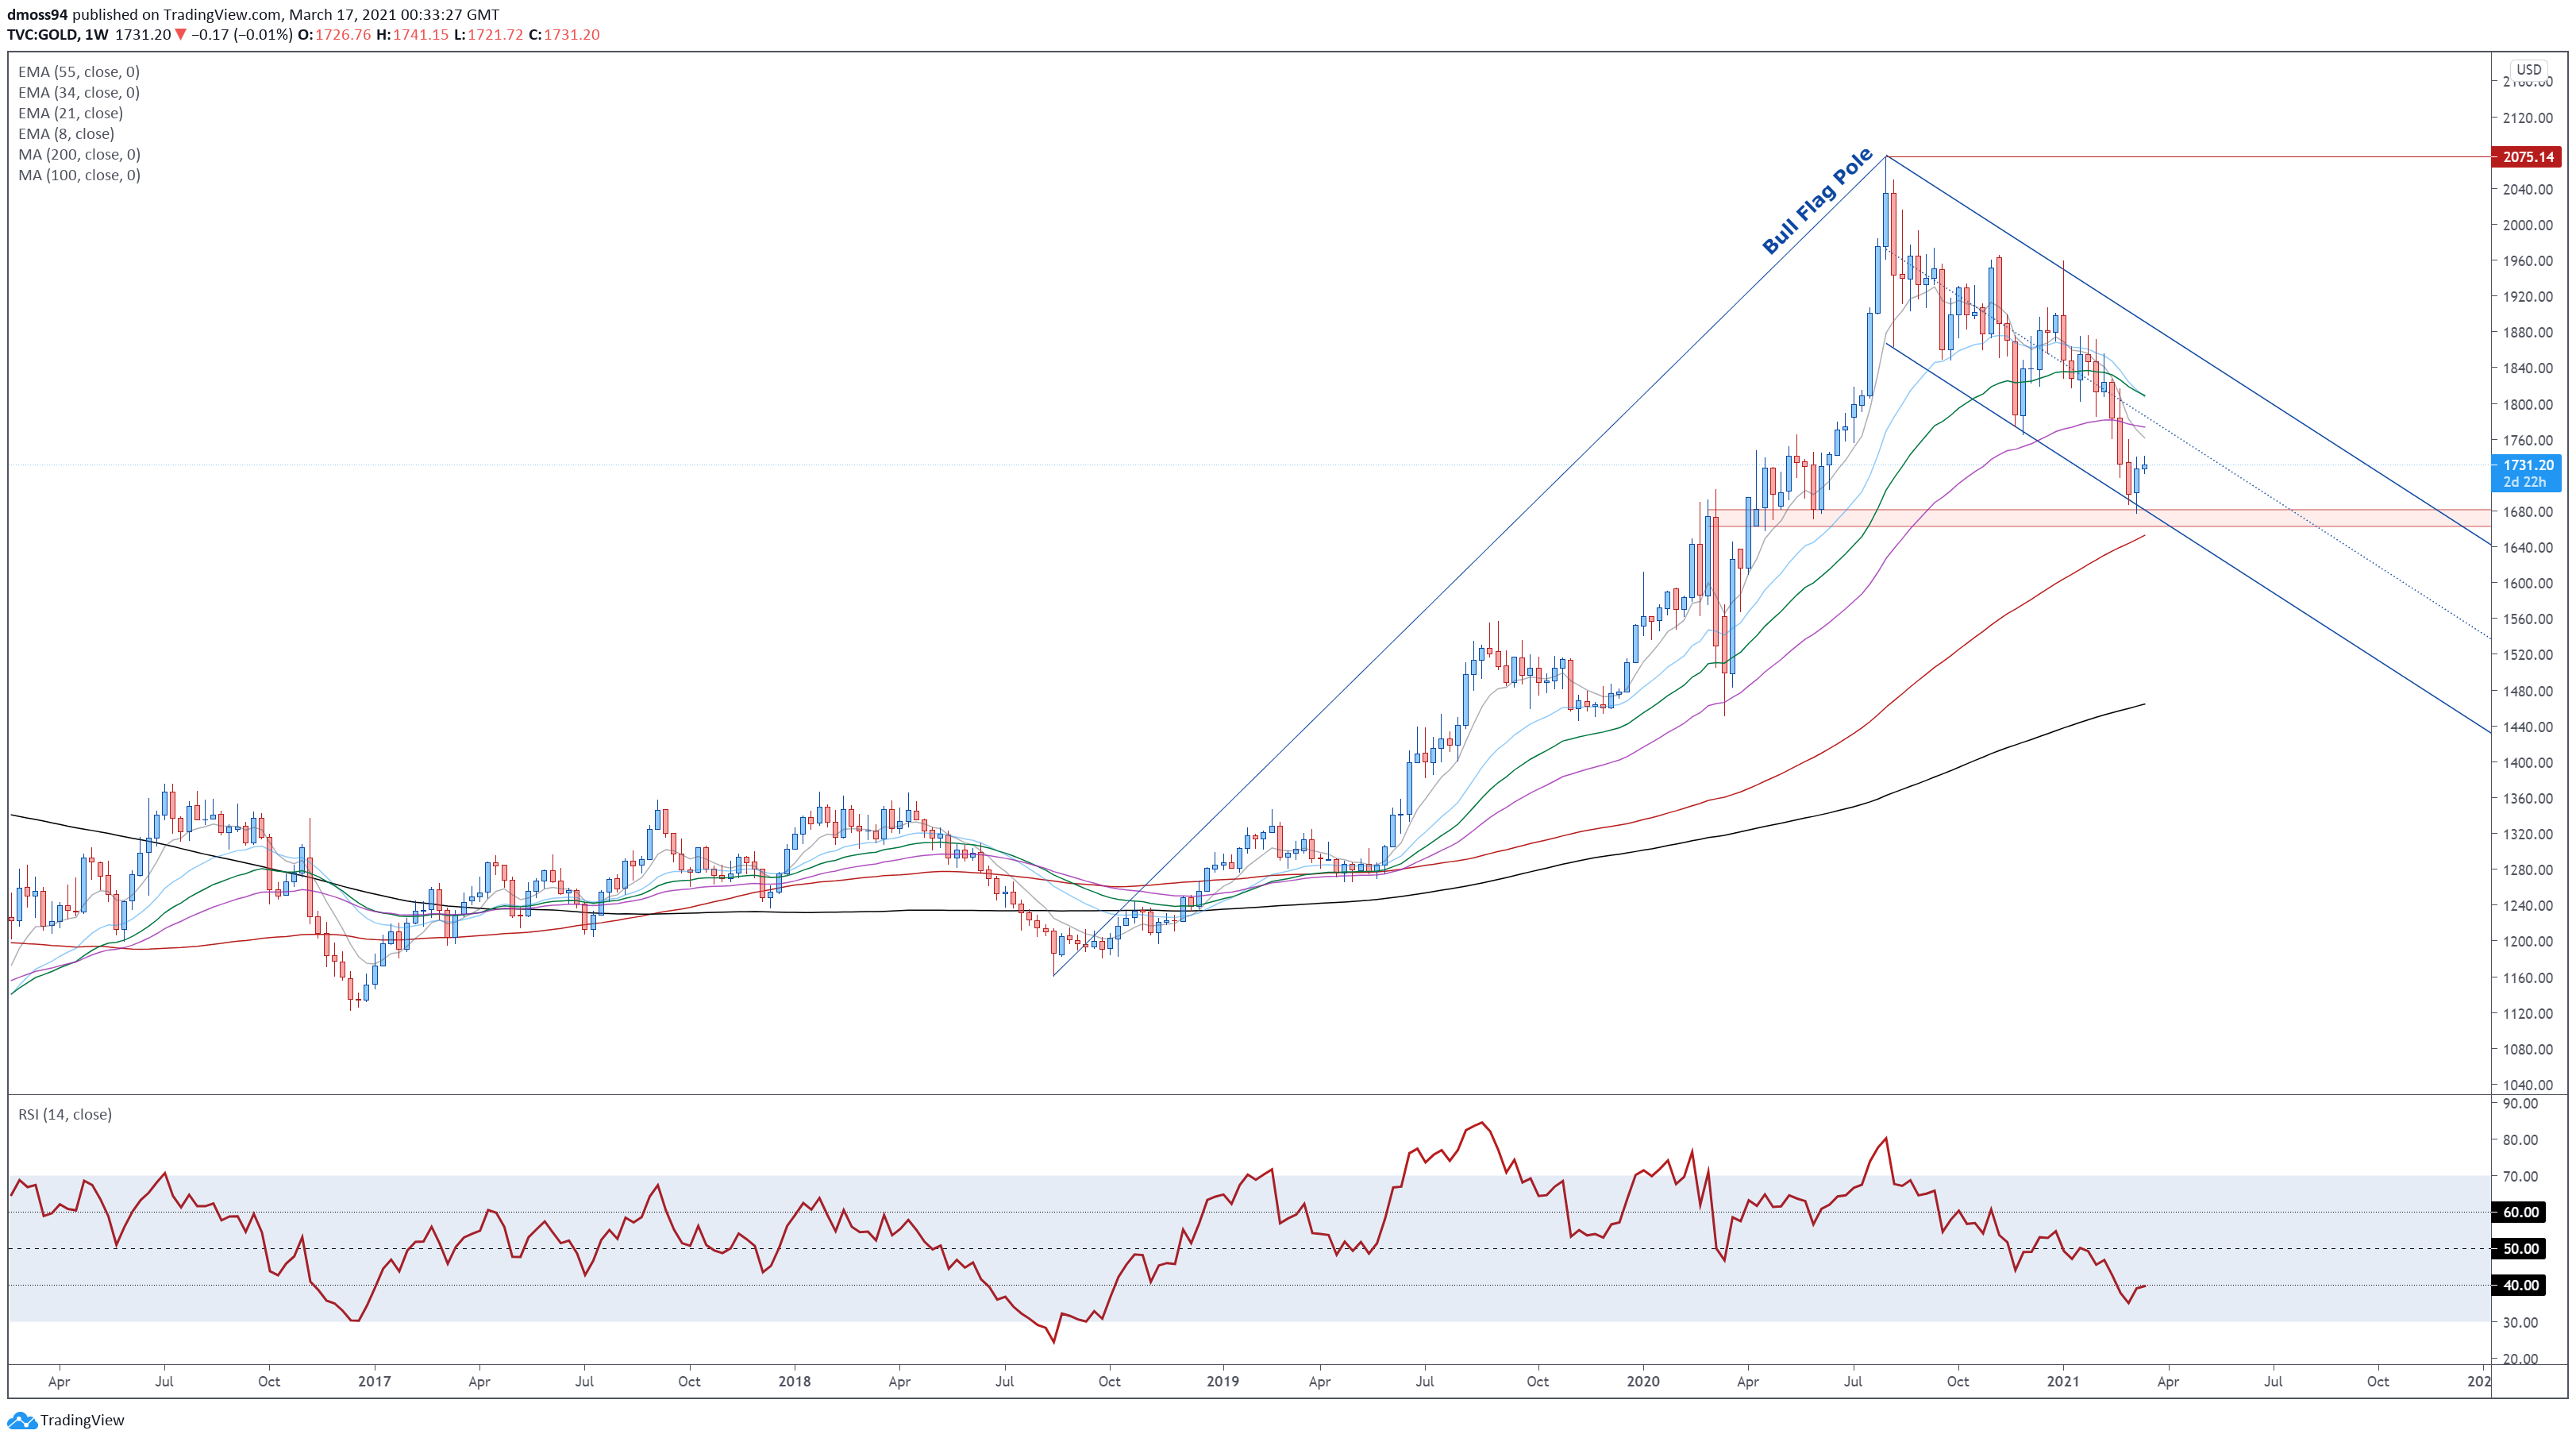
Gold weekly chart created using Tradingview
Gold Price Daily Chart – 8-EMA Could Guide Price Higher
Zooming into the daily chart also reinforces the bullish tilt seen on the weekly timeframe, as price bounces back above the fast-moving 8-EMA (1727) and eyes a push to retest the 50% Fibonacci (1763).
With the RSI drifting back above 40, and the slopes of the faster-moving 21-, 34- and 55-day moving averages notably plateauing, further gains are hardly out of the question.
Remaining constructively positioned above the 8-EMA could open the door for price to retest former support-turned-resistance at the 50% Fibonacci, with a convincing push above bringing range resistance at 1814 – 1824 into the crosshairs.
Alternatively, sliding back below 1720 may allow sellers to drive price back towards the monthly low (1677).
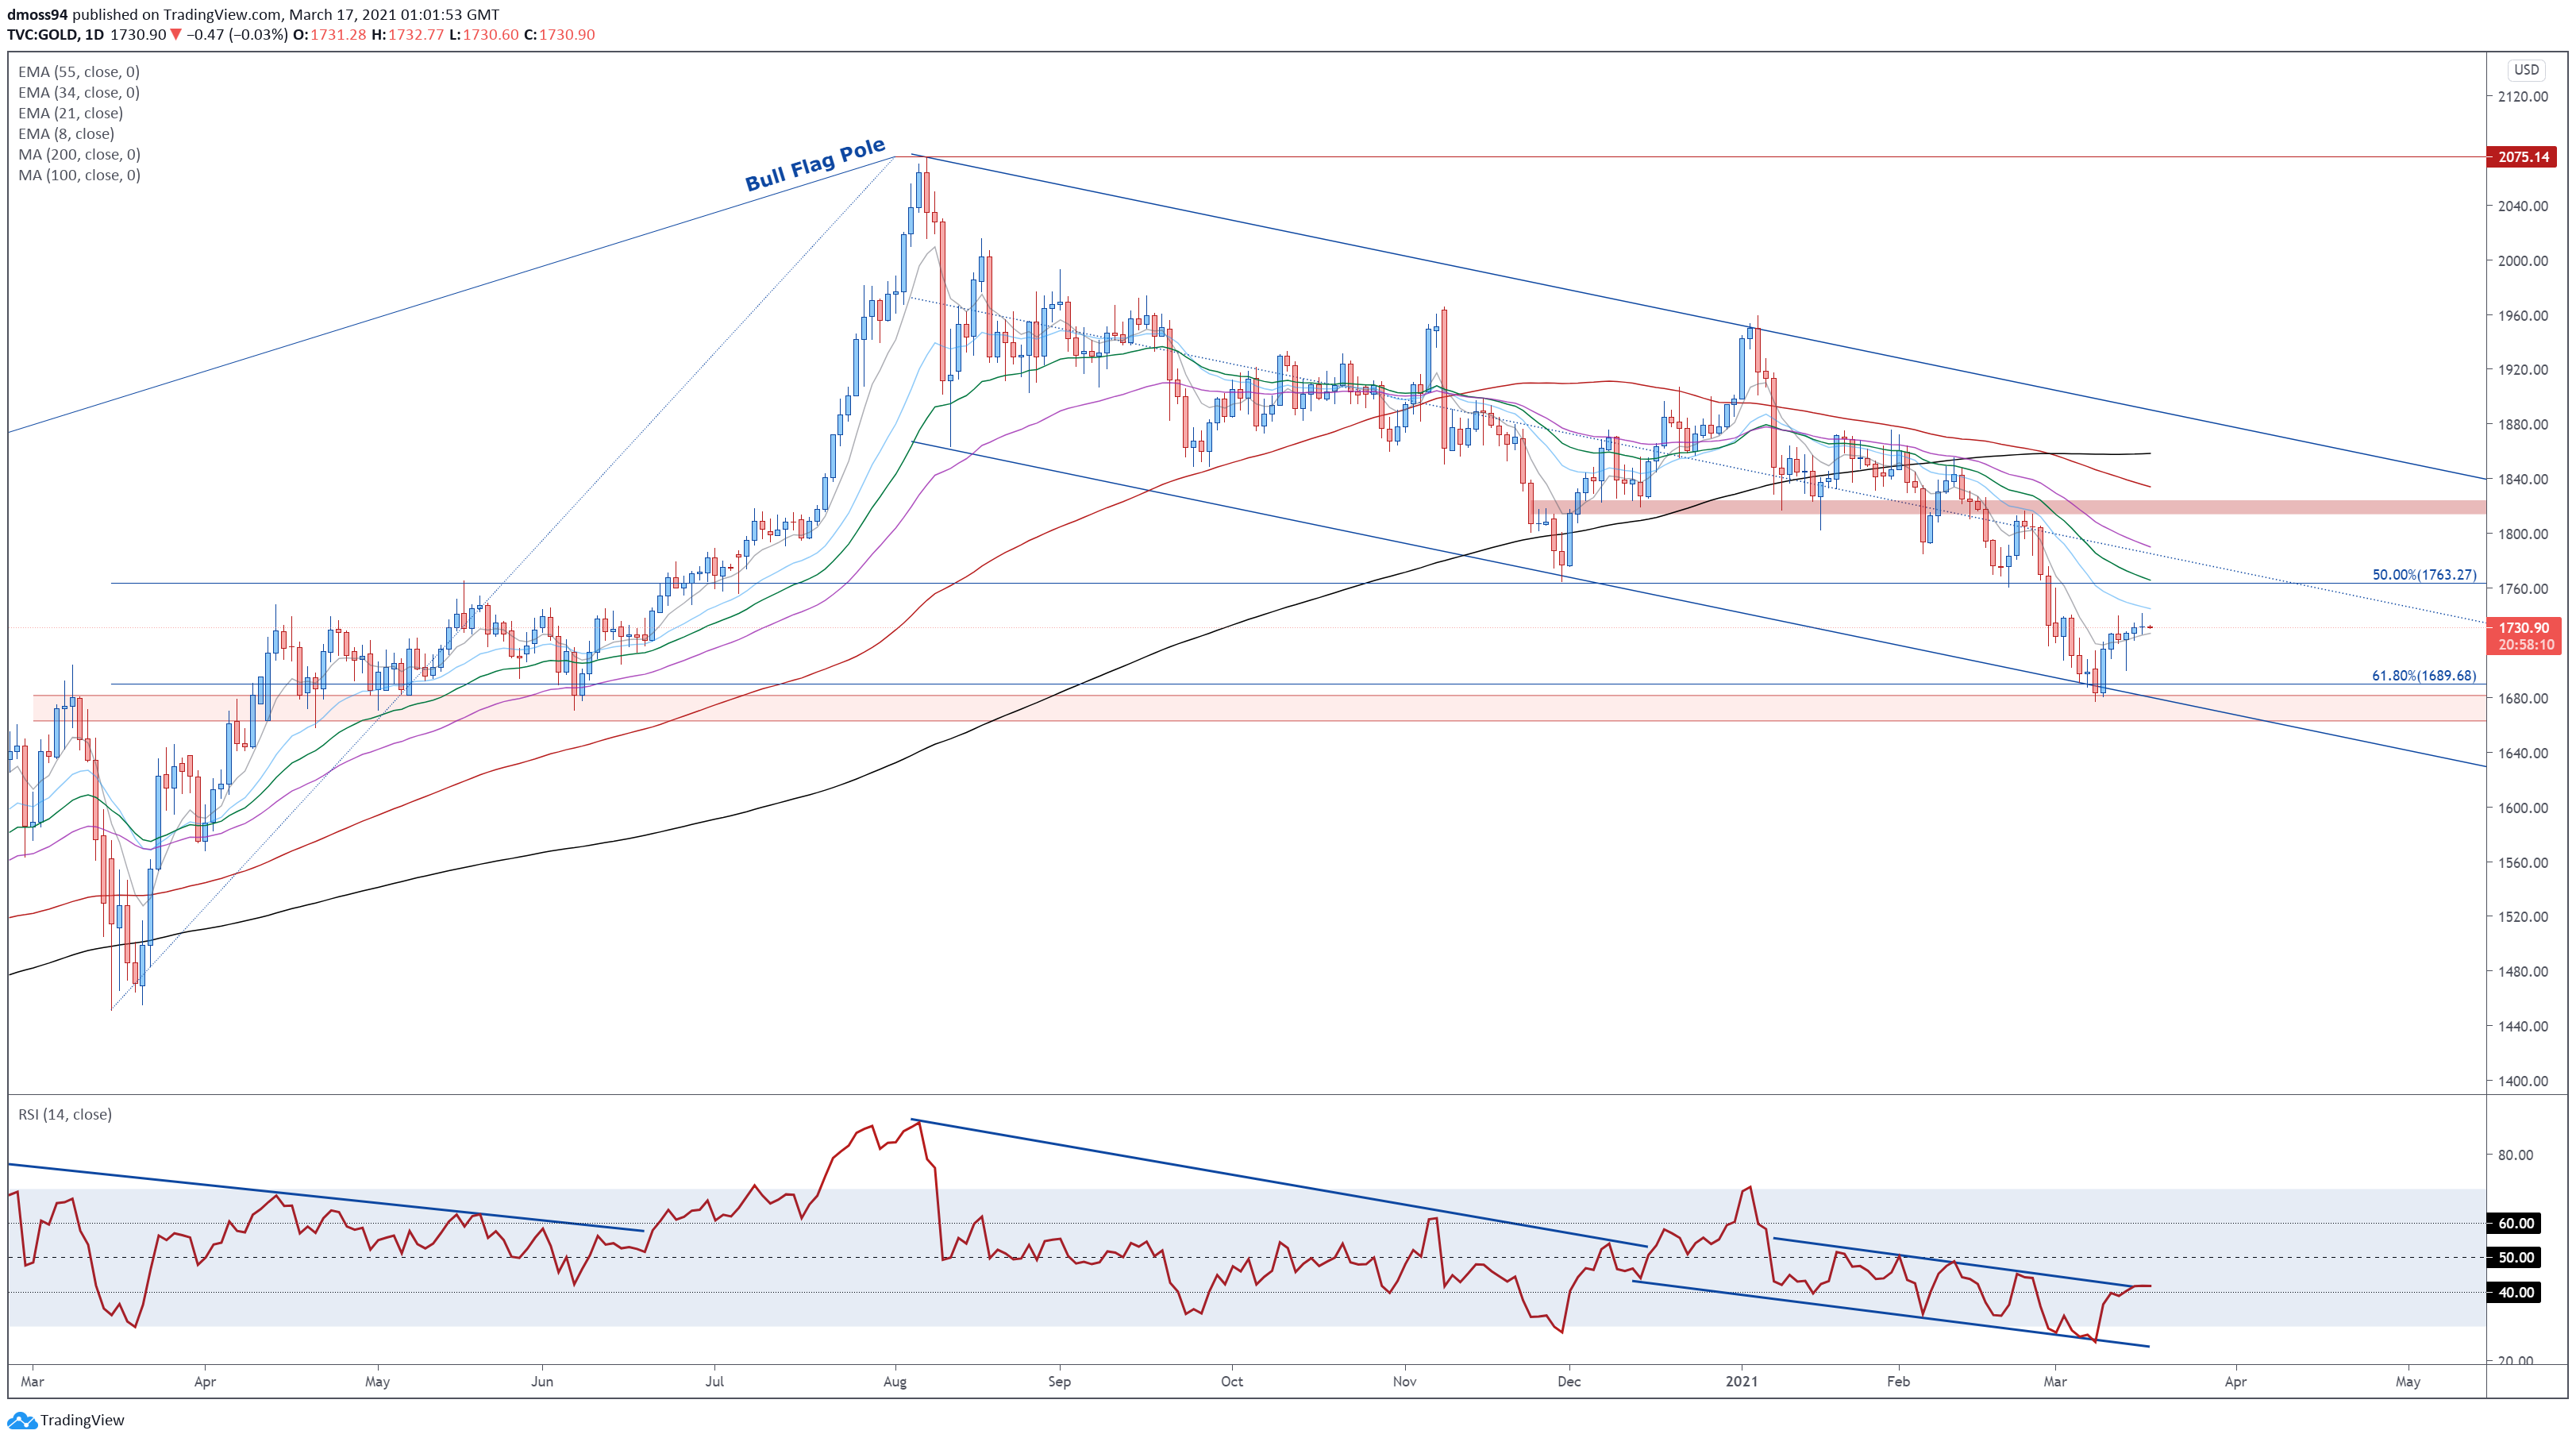
Gold daily chart created using Tradingview
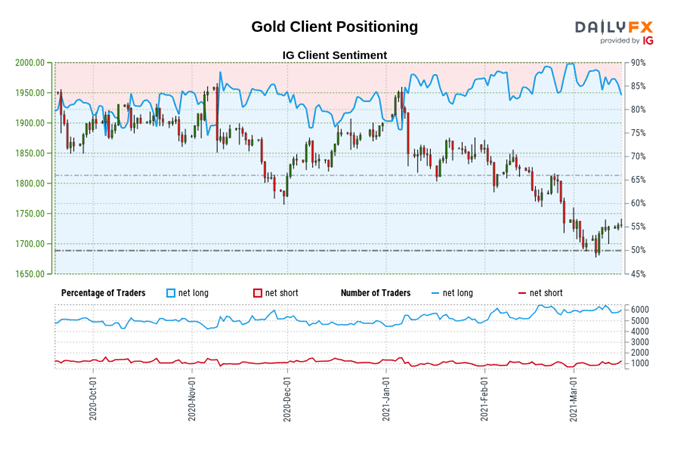
IG Client Sentiment Report
The IG Client Sentiment Report shows 83.78% of traders are net-long with the ratio of traders long to short at 5.16 to 1. The number of traders net-long is 0.03% higher than yesterday and 1.07% lower from last week, while the number of traders net-short is 1.36% lower than yesterday and 5.45% higher from last week.
We typically take a contrarian view to crowd sentiment, and the fact traders are net-long suggests Gold prices may continue to fall.
Positioning is more net-long than yesterday but less net-long from last week. The combination of current sentiment and recent changes gives us a further mixed Gold trading bias.
— Written by Daniel Moss, Analyst for DailyFX
Follow me on Twitter @DanielGMoss

Recommended by Daniel Moss
How to Trade Gold
Be the first to comment