

andresr
Thesis
Recent market volatilities created some very interesting opportunities in the REIT sector. Take the two leaders in the sector, Realty Income (NYSE:O) and Simon Property (NYSE:SPG), as an example. They both suffered sizable corrections. To wit, as seen from the chart below, O has suffered a total loss of 8.6% YTD and SPG 22%. Combined with their steady fundamentals, their valuations are at quite reasonable levels. Judging by their dividend yields, O currently provides a FWD yield of 4.74%. Compared to its 4 Year Average Yield of 4.19%, its current valuation is undervalued by about 13%. In SPG’s case, it currently provides a FWD yield of 6.05%. Compared to its 4 Year Average Yield of 6.13%, its current valuation is close to fair valuation (within about 1%).
Seeking Alpha data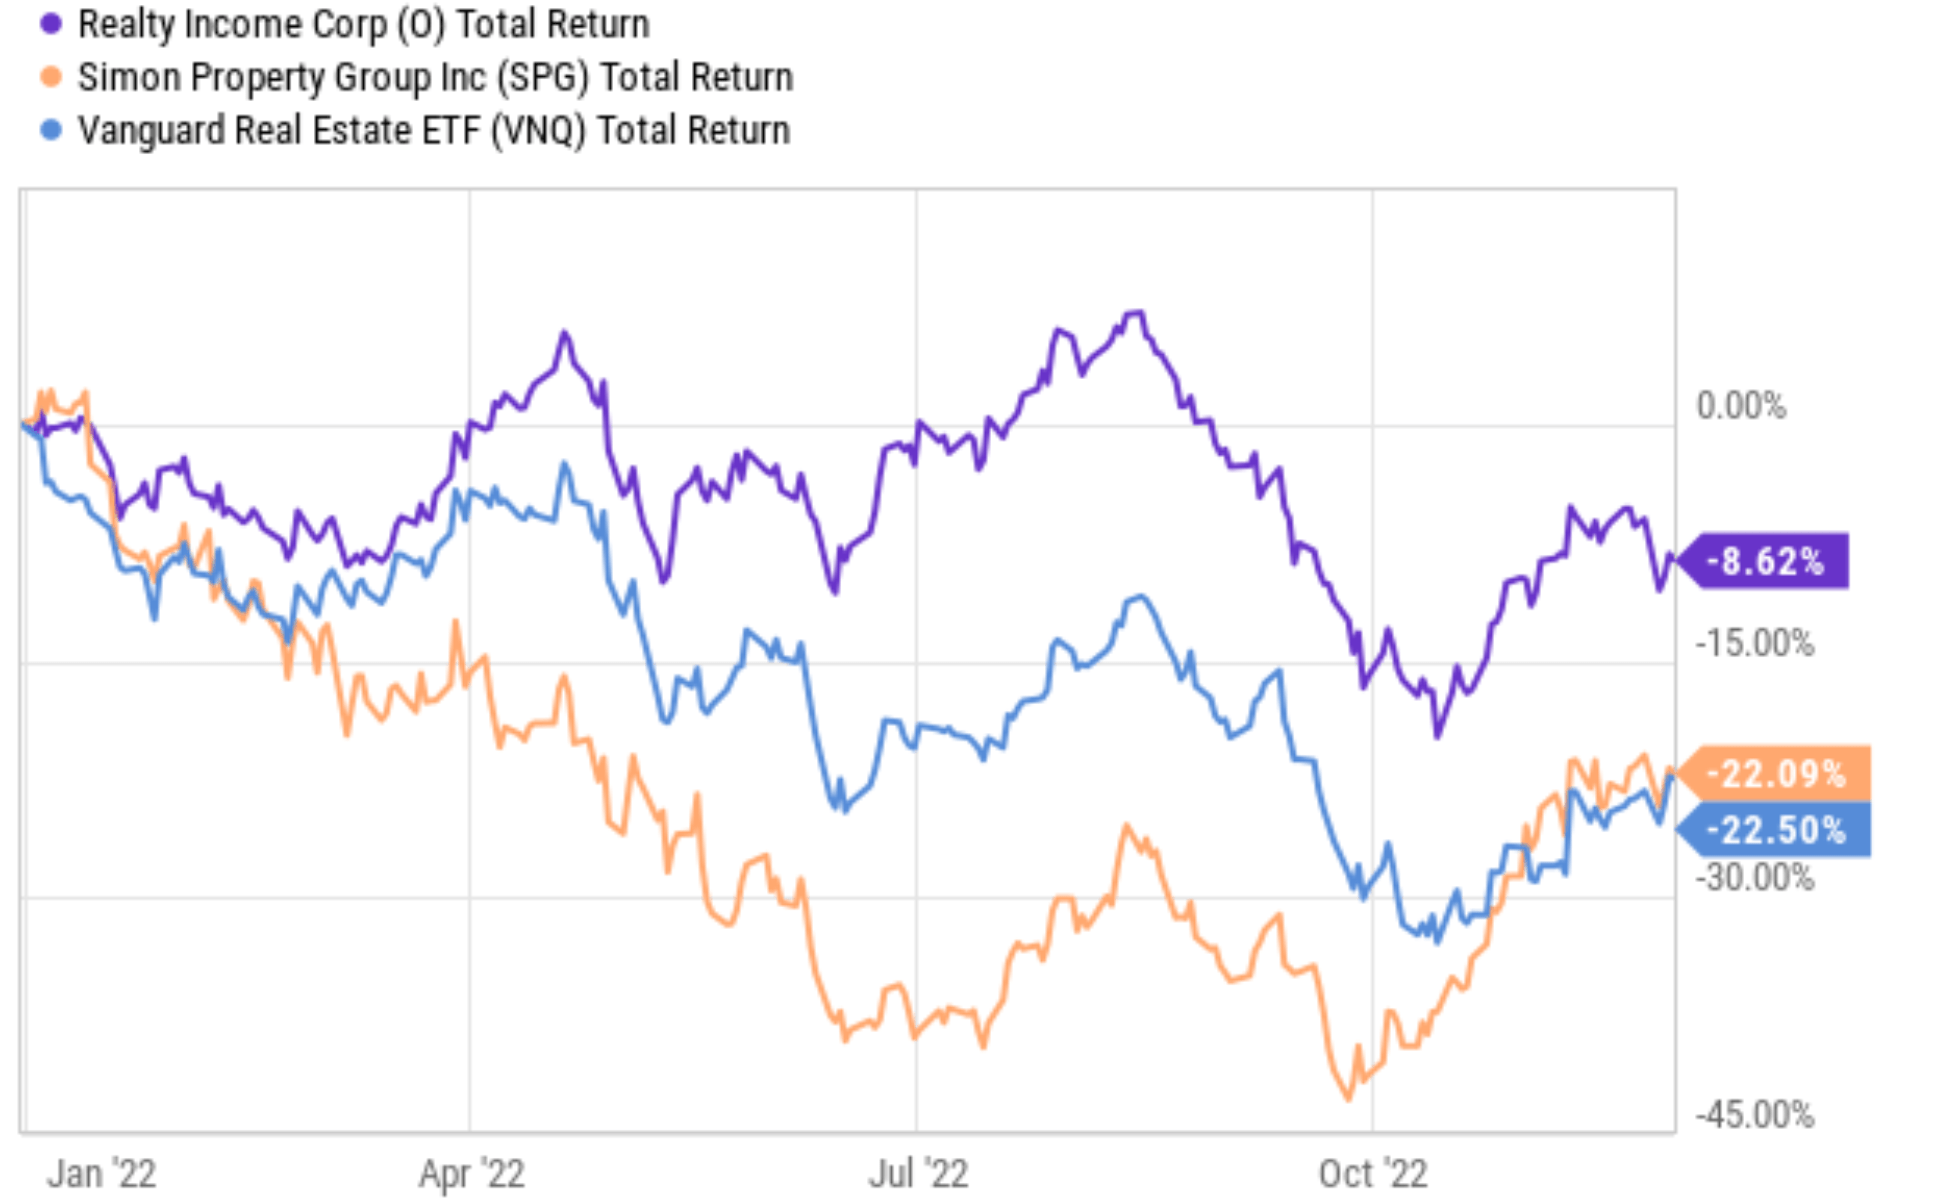
Having multiple good options poses its own problems. In this case, both O and SPG are both leading stocks in the REIT space. Let’s consider a few factors that could complicate the choice even just between O and SPG. As just mentioned, judging by their dividend yields, O is currently at a larger relative discount than SPG. However, SPG’s recent unstable dividend payouts could make the use of dividend yield unreliable as a valuation metric. Furthermore, in terms of absolute valuation metrics, SPG is trading at 10.1x FW AFFO, about 50% lower than O’s 15.6x. Finally, SPG’s financial strength and growth consistency are also weaker than O in my view as to be elaborated on later.
So how do potential investors holistically consolidate all these negative and positives? Whenever in doubt, I always like to go back to basics. And in the reminder of this article, I will apply the timeless principles developed by Benjamin Graham to analyze these two stocks. And my final verdict is that Graham himself probably would prefer O under the current conditions.
Benjamin Graham’s Checklist
In his classic, The Intelligent Investor, Benjamin Graham developed a checklist for picking defensive stocks. These rules are detailed in my earlier article and summarized below:
- Is the company large, prominent, and conservatively financed? The specific metrics to look for are stable financial strength, consistent capital structure, and a long record of continuous dividend payments.
- Especially the dividend record. Graham emphasized countless times the importance of dividend records – for good reasons. In his own words, he thinks “a record of continuous dividend payments for the last 20 years or more is an important plus factor in the company’s quality rating“.
- Has the company demonstrated an adequate level of Earnings Growth in the past? For defensive investors, growth is not the key and “adequate“ is enough. In Graham‘s mind, a minimum increase of at least one-third in per-share earnings in the past ten years is adequate enough.
- Finally, are the valuation multiples moderate? As a value investor to the core, he also recommended a series of methods for investors to gauge the price they should pay. And also, being fully aware of the uncertainties in his own method, he emphasized that you should always leave a safe margin of safety.
In the remainder of the article, we will apply the above rules on O and SPG one by one and see who better fits each of them.
O and SPG: Are they large, prominent, and conservatively financed?
The first two boxes are easy to check off. Realty is a leader in single-tenant and standalone commercial properties. It owns 11,136 properties in 50 states, Puerto Rico, the U.K., and Spain with a total of over 210.1 million square feet of space. Simon is a REIT leader in regional malls and outlets with interests in 203 properties in the U.S. and Puerto Rico, and also a total of 31 assets abroad.
The third box, whether they are conservatively financed, requires a closer look. O maintains an interest coverage ratio of 2.68x and SPG of 4.09x as shown in the chart below (the top panel). The overall economy’s interest coverage ratio is about 6x, substantially higher than both O and SPG. But bear in mind that REIT companies are in general more leveraged. It is therefore more meaningful to compare their leverages against their own track record. As seen in the chart, O’s average interest coverage ratio is about 2.3x in the past 10 years, and SPG’s average is about 3.4x. Thus, both of them are in a strong financial position by their own historical standard. The debt/EBITDA ratio (the bottom panel) confirms the above assessment. O’s current ratio sits at 5.4x, below its historical average of 5.64x by a good margin. And SPG’s ratio hovers around 6.1x, only slightly above its historical average of 5.93x.
So overall, I’d say that both O and SPG are large, prominent, and conservatively financed companies under their current conditions.
Source: Seeking Alpha data.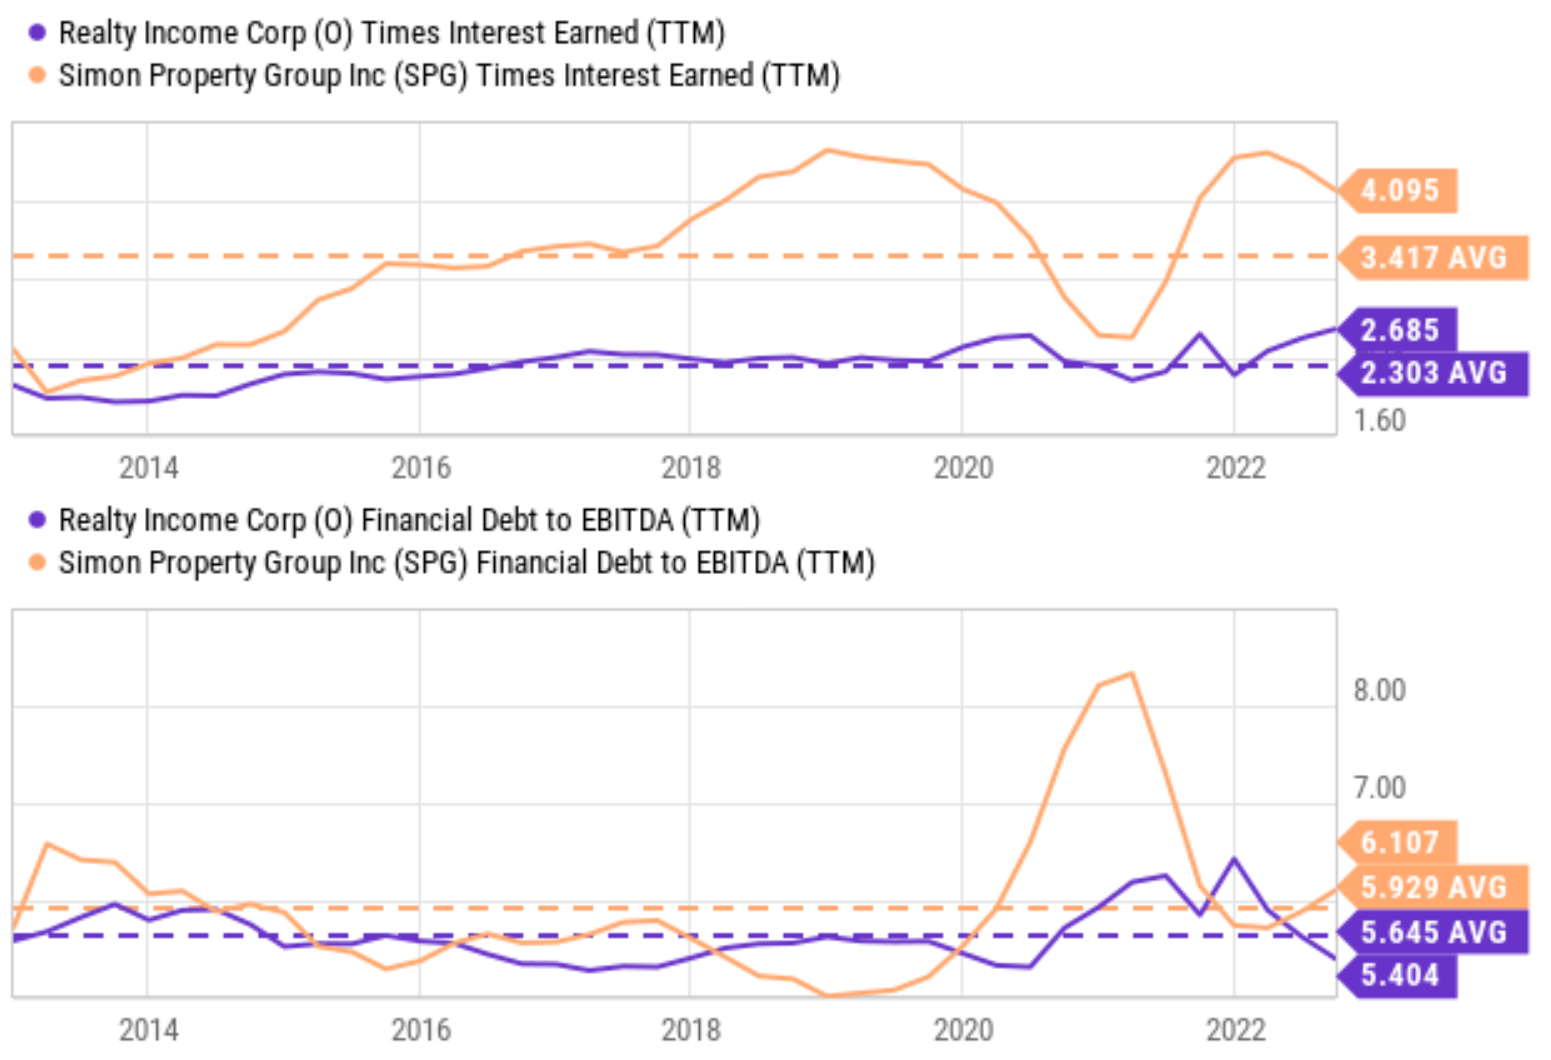
O and SPG’s dividend record
The dividend box is easy to check off for O. All is a different champagne that has been continuously increasing its dividend in the past 25 years, a track record much stronger than Graham’s requirement of 20 years of continuous payment. Furthermore, it has been maintaining a dividend growth rate of 4.17% CAGR in the past 3 years and 3.93% in the past 5 years.
SPG’s case is a bit more involved. It has been paying dividends continuously for more than 20 years too, thus meeting Graham’s requirement of 20 years of continuous payment. However, it cut its payout recently due to the impacts of the COVID pandemic as you can see from the chart below. As a result, its dividend has decreased at a rate of 5.9% CAGR in the past 3 years and 0.15% in the past 5 years. However, when we expand the horizon a bit wider to 10 years, its dividend has grown at a healthy rate of 5.3% CAGR.
So overall, my conclusion is both O and SPG have passed the dividend record test too, although O is clearly the more resilient business here.
Source: author based on Seeking Alpha data.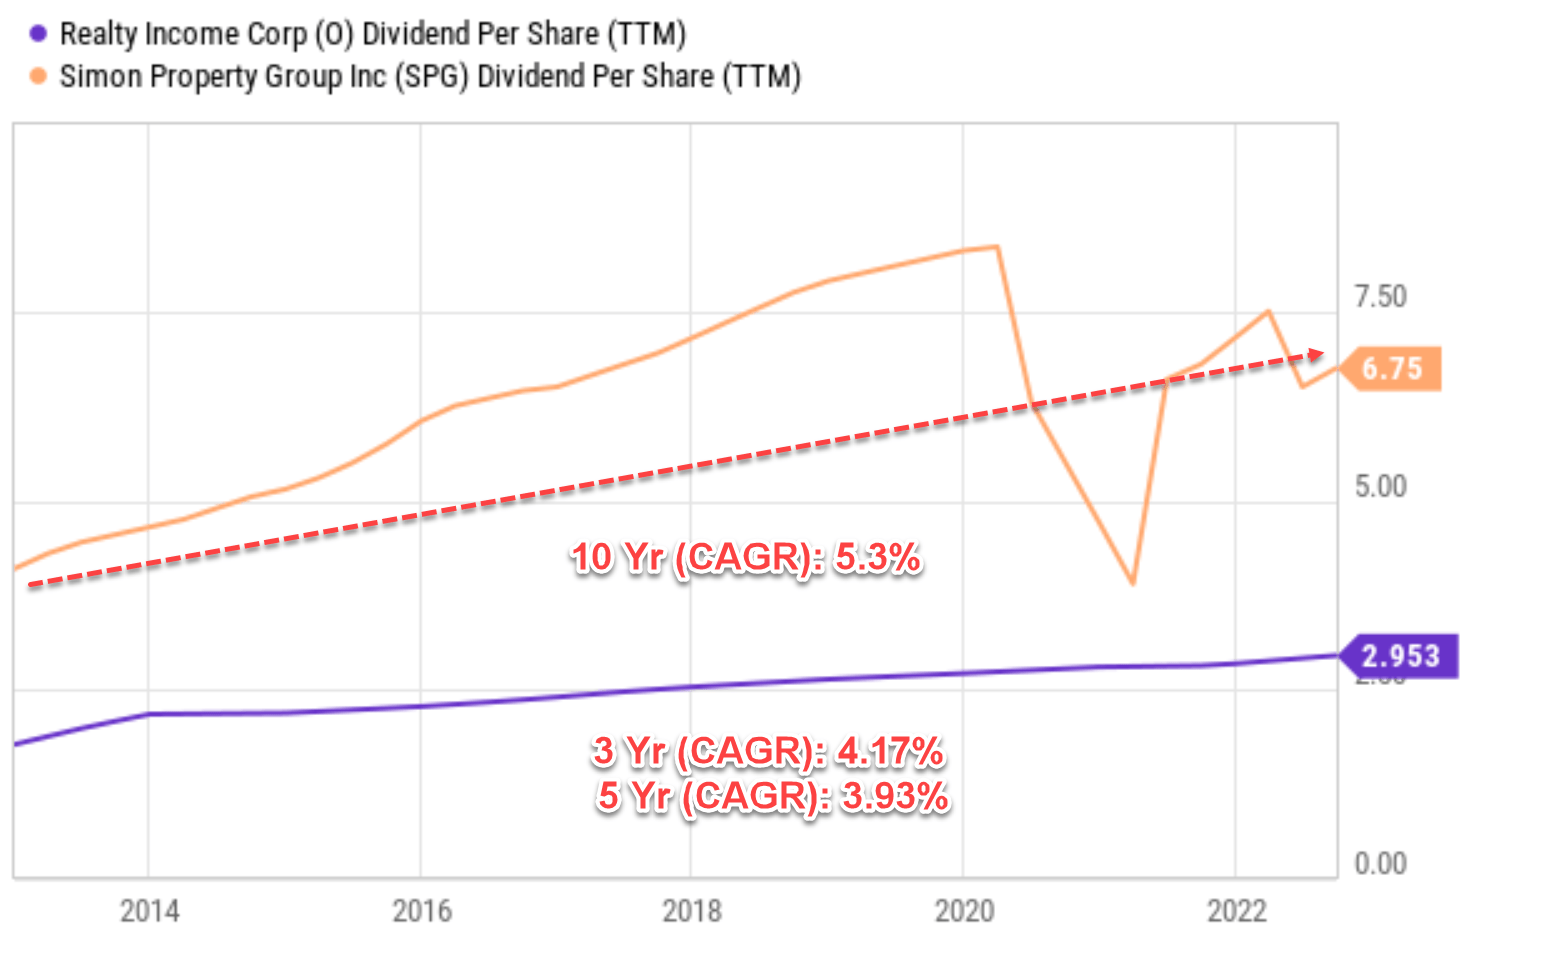
O and SPG: adequate level of earnings growth
As aforementioned, in Graham’s mind, adequate growth means a minimum increase of at least one-third in per-share earnings in the past 10 years. This translates into an annual growth rate of 2.9% CAGR. And as judged by their dividend payout in the past 10 years, both O and SPG have easily met this criterion too.
O and SPG’s valuation
Finally, as also mentioned earlier,
As a value investor to the core, Graham recommended a series of methods for investors to gauge the price they should pay. Here we will examine two of them (the other methods he recommended essentially paint the same picture). First, he recommended the PE for a defensive stock should be around 8.5 plus twice the expected annual growth rate, which I call the Graham PE. Hence, in his mind, a business that completely stagnates should be worth about 8.5x PE.
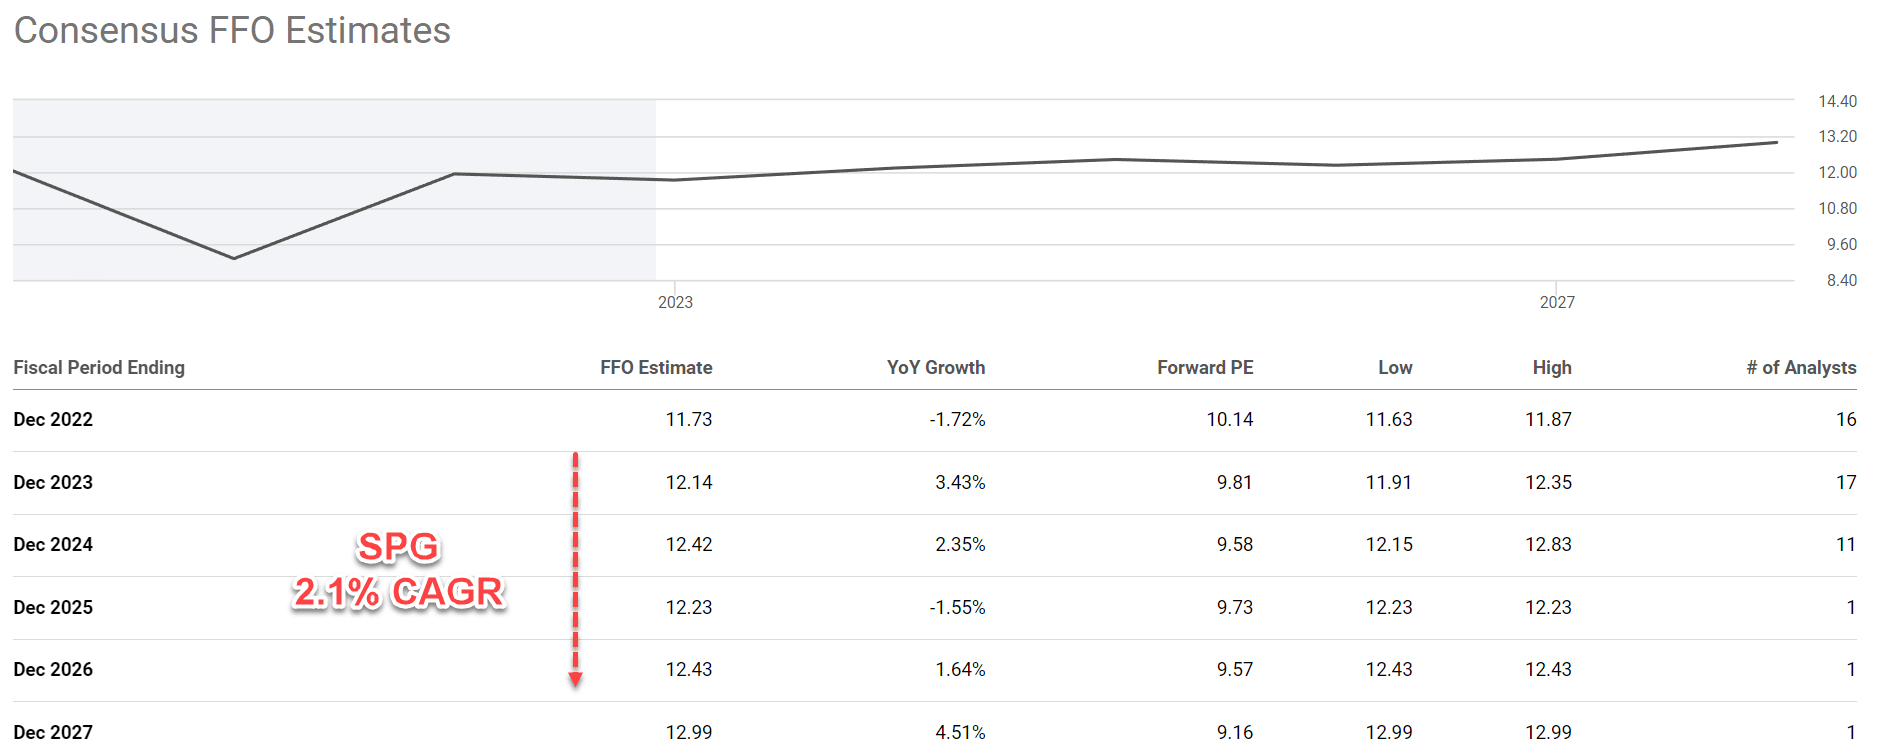
And in O’s case, consensus estimates project its AFFO growth rates to be about 4.8% flat in the next 5 years (from $4.01 in 2022 to $5.07 in 2027), quite consistent with its past growth rates. For SPG, consensus estimates project its AFFO to grow at a rate of 2.1% in the next 5 years (from $11.73 in 2022 to $12.99 in 2027), a bit too conservative in my view. But we will stick this projected rate to be on the conservative side in my valuation analysis.
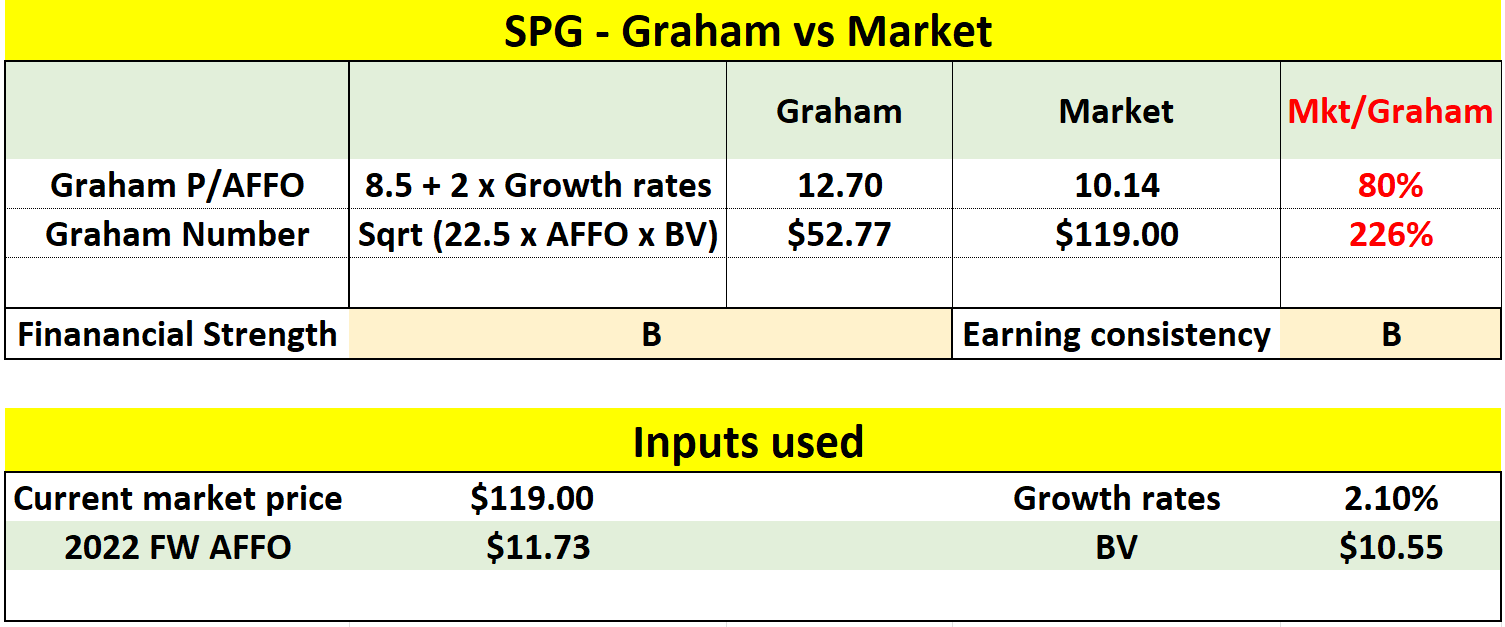
Based on the above growth projections, the Graham P/AFFO would be 18.1x for O (8.5 + 2 * 4.8=18.1). Compared to its actual P/AFFO multiple of 15.66x at its current price, its market valuation is about 13% discounted from the Graham multiple. For SPG, its Graham P/AFFO would be 12.7x (8.5 + 2 * 2.1=18.1). Compared to its actual P/AFFO multiple of 10.14x at its current price, its market valuation is about 20% discounted from the Graham multiple.
Source: author based on Seeking Alpha data. Source: author based on Seeking Alpha data.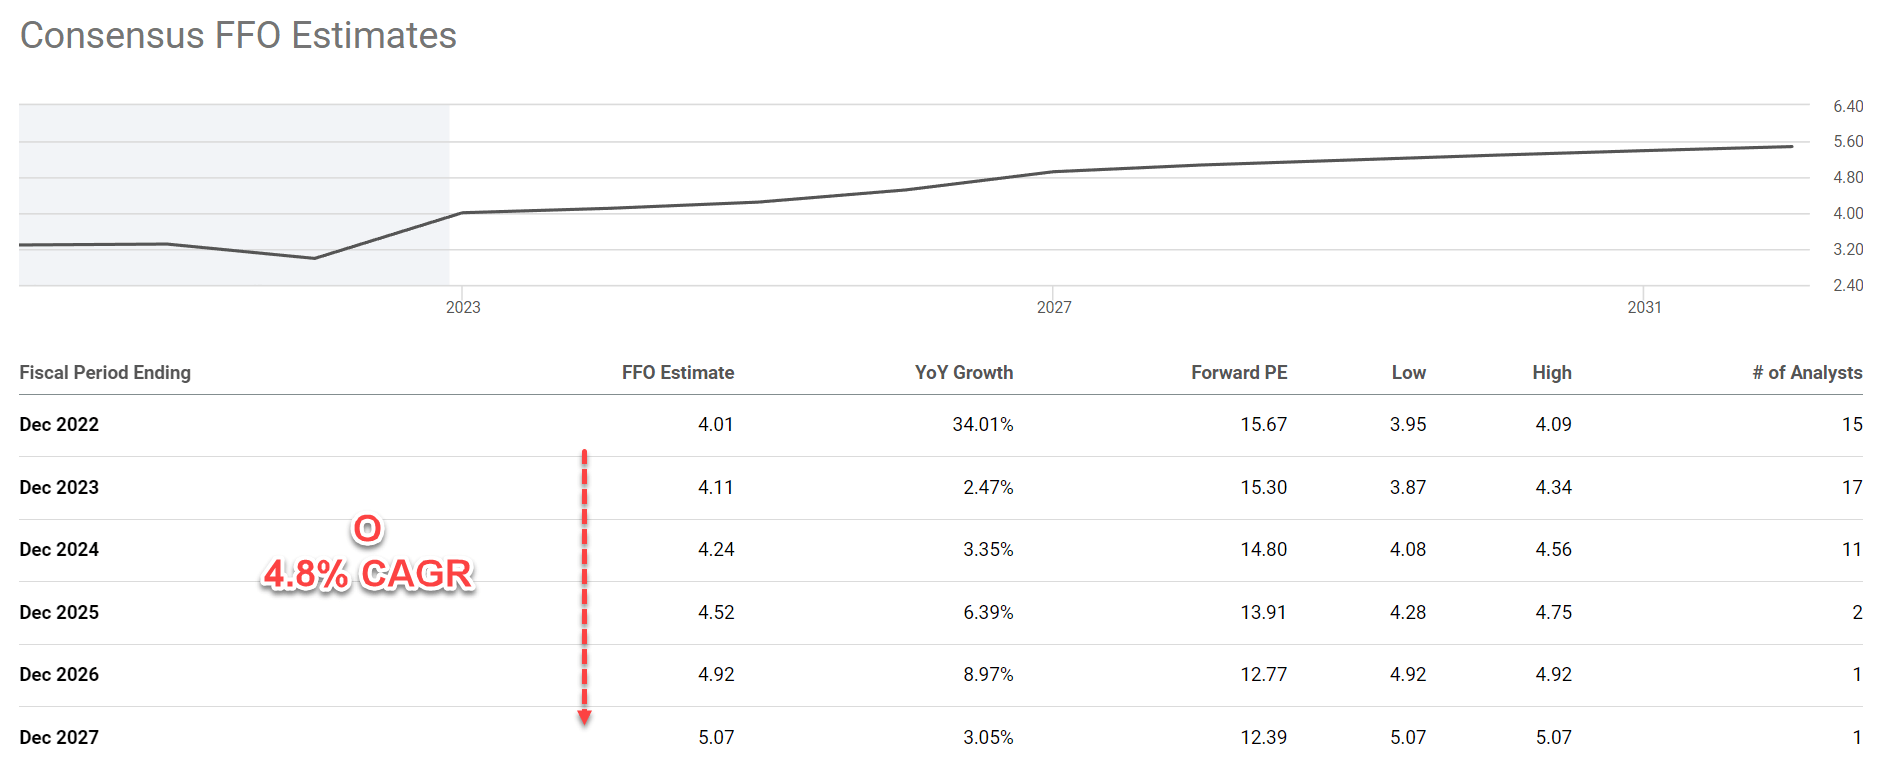
Of course, Graham himself is aware of the uncertainties in his above methods (e.g., the estimation of growth rates always invites uncertainties). Thus, he also developed additional metrics for cross-checking purposes. Next, I will check their valuations using the following Graham Number:
In general, Graham cautions against paying a price of more than 15x times earnings or more than 1.5x times the book value (“BV“). However, a PE multiple above 15x could be justified if the P/BV ratio is lower than 1.5x. And vice versa. And as a result, the Graham number considers both the 15x PE limit and the 1.5x P/BV limit. More specifically, the Graham number is the square root of A) 22.5 (which equals 15 times 1.5), B) the EPS, and C) the book value.
For REIT stocks like O and SPG, I will just replace the EPS with their AFFO. The Graham numbers for O and SPG are shown in the table below with the inputs I assumed (all obtained from Seeking Alpha as of this writing). As seen, the Graham number for O turned out to be $61.7, almost the same as its market price of $62.8. The Graham number for SPG turned out to be $52.77. And its market price of $119 is more than 2x higher than its Graham number.
Source: author based on Seeking Alpha data. Source: author based on Seeking Alpha data.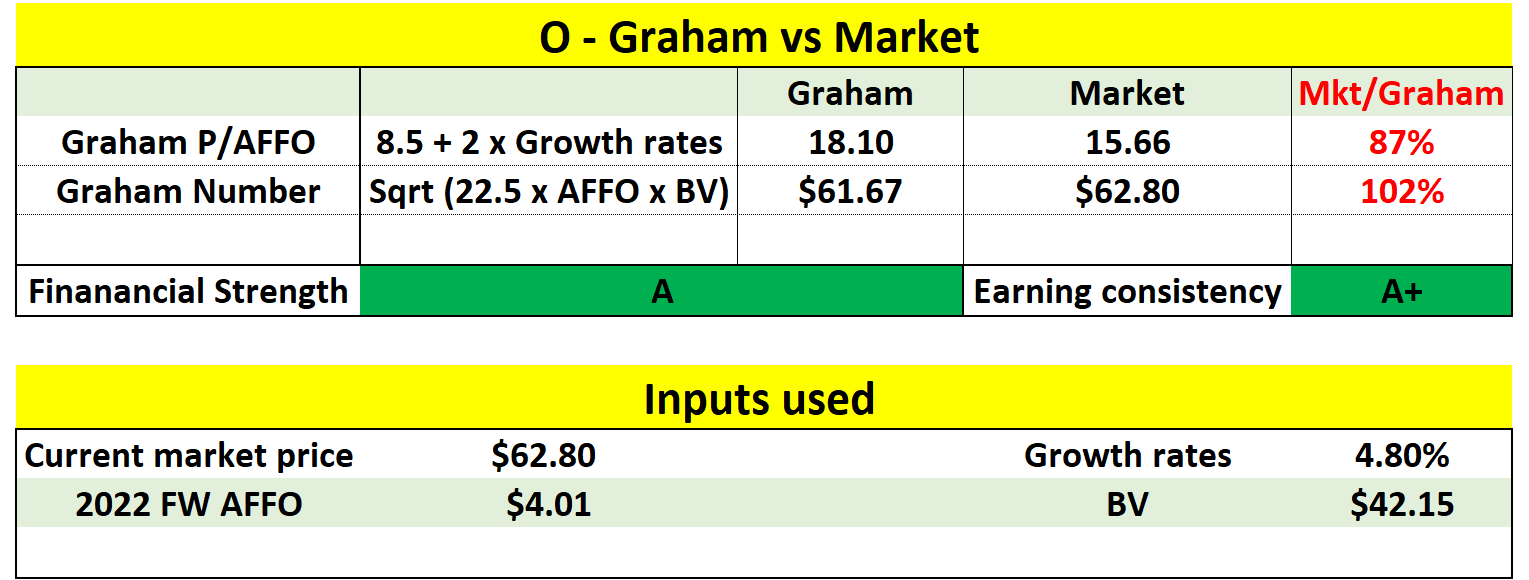
Risks and final thoughts
Specific risks for O and SPG have been discussed in detail by other Seeking Alpha authors already (including my own articles). So, here I won’t further add to these specific risks. Instead, I will make a few comments on the risks and uncertainties associated with the Graham numbers used above. As shown in the Graham number analyses above, the Graham number for O is very close to O’s market prices. But the Graham number for SPG is only about ½ of its market price. Part of the reason is that the Graham number is based on BV and ignored the fact that every $1 of the property on the book can have different earnings powers at different companies. For example, O’s return on total capital is on average 2%~3% in recent years, but SPG’s average is around 8%. Therefore, each $1 of SPG’s property should be worth more than O’s property, which is a factor that the Graham number did not include.
All told, recent market volatilities created some interesting opportunities in the REIT sector. In particular, two leading stocks, O and SPG, have checked off all boxes on Graham’s checklist with the possible exception of SPG’s Graham number. And both showed a large discount compared to the Graham P/AFFO multiple. And I see both as excellent choices. The little exception with SPG might go away too if we adjust for the factor mentioned in the above paragraph.
But since Graham’s checklist is developed with picking “defensive stocks” as the primary goal, I have to conclude that the O is the better pick here for conservative accounts. It offers more resilient earnings and dividends than SPG as discussed above. Furthermore, adjusting SPG’s Graham number will obviously involve some additional assumptions and personal judgment (which would pay off handsomely if you made the right assumptions). When faced with two choices, conservative investors like myself should always prefer the one that involves the least number of assumptions and personal judgments.
Be the first to comment