

asbe
Investment Thesis
Realty Income Corporation (NYSE:O), a Dividend Aristocrat, is widely regarded as among the best managed and most popular investments available for income-oriented investors, as well as for those with long-term wealth building goals. It provides a good case study for thinking about real returns.
An analysis will show that real returns for Realty Income in recent years have been positive, although significantly less than the nominal returns usually discussed.
Sustained significant inflation will challenge those returns. This suggests a lower target price may be appropriate.
Introduction
Real returns (returns after inflation) are critical to meeting investors’ goals – paying future bills and building wealth.
However, financial reports, analysis, earnings calls, and time series data in company presentations – are all presented in nominal terms.
For 25 years, inflation was low enough, ~ 2.2% per year, that most investors viewed nominal results as a “good enough” representation of the true state of affairs. Discussion of results in real terms has been rare.
However, in 2021 inflation materially increased, and reached 40-year highs in 2022. The gap between nominal and real terms is now large enough to significantly impact an assessment of how well an investment is contributing to meeting an investor’s real goals.
The inflation rate actually breached 4% in April 2021 (red square) but for simplicity I’ve used 01 January 2021 as the pivot point between “low” and “high” inflation periods in the analysis for this article.

US Monthly Inflation Data (Chart by US Inflation Calculator, data CPI from BLS)
We’ll look at the anchoring effect for inflation expectations, the difference between nominal and real returns for Realty Income, CPI data for the last decade, what high inflation looks like, inflation expectations going forward, and offer some comments for investors.
Anchoring Expectations
Inflation in the US has been relatively low for a long time, in fact over the adult lifetime of many investors and analysts. That provides a pretty firm anchor for expectations.
The data below, going back 25 years and ending at the 31 December 2020 pivot point, shows an average 2.2% inflation rate. There’s been some variation, but significant excursions were fairly rare and brief, and if anything, the last 10 years have been below the long-term average.
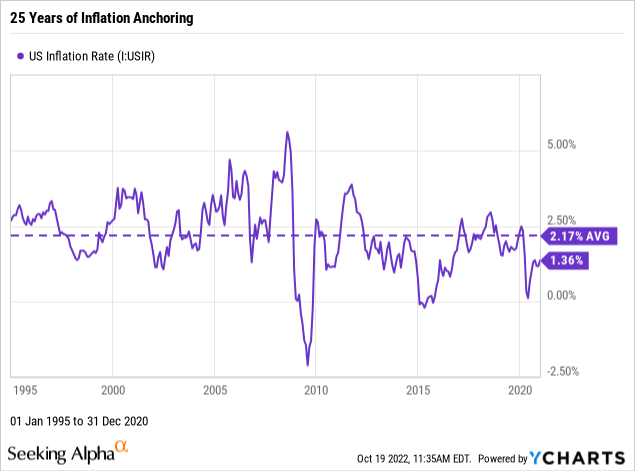
One of the results of this anchor is that everyone is used to reporting and thinking in nominal (i.e. ignoring inflation) vs. real results. It’s dramatically simpler, and usually has been “good enough”. Basically inflation was low enough that it was routinely ignored.
While this has been quite reasonable for traders with short holding periods, it’s less so for investors with holding periods in years or decades.
Let’s look at our example, Realty Income. I would emphasize I’m not being specifically critical of Realty Income here; this is essentially universal practice.
What’s Presented and What’s Left Unsaid
Well give four examples of the difference between nominal and real returns.
Earnings Call
In the 04 Aug 2022 Realty Income Q2 2022 earnings call, Christie Kelly, CFO, said (emphasis mine):
During the second quarter, our business generated $0.97 of AFFO per share, representing 10.2% year-over-year growth.
We affirm our previously announced 2022 AFFO per share guidance of $3.84 to $3.97, representing nearly 9% annual growth at the mid-point.
For context, the US Bureau of Labor Statistics “BLS” announced in July 2020:
Over the 12 months ended June 2022, the Consumer Price Index for All Urban Consumers increased 9.1%. The 9.1% increase in the all items index was the largest 12 month increase since the 12 month period ending November 1981.
With that context, results were basically flat.
Investor Presentation
From the August 2022 Realty Income Investor Presentation:
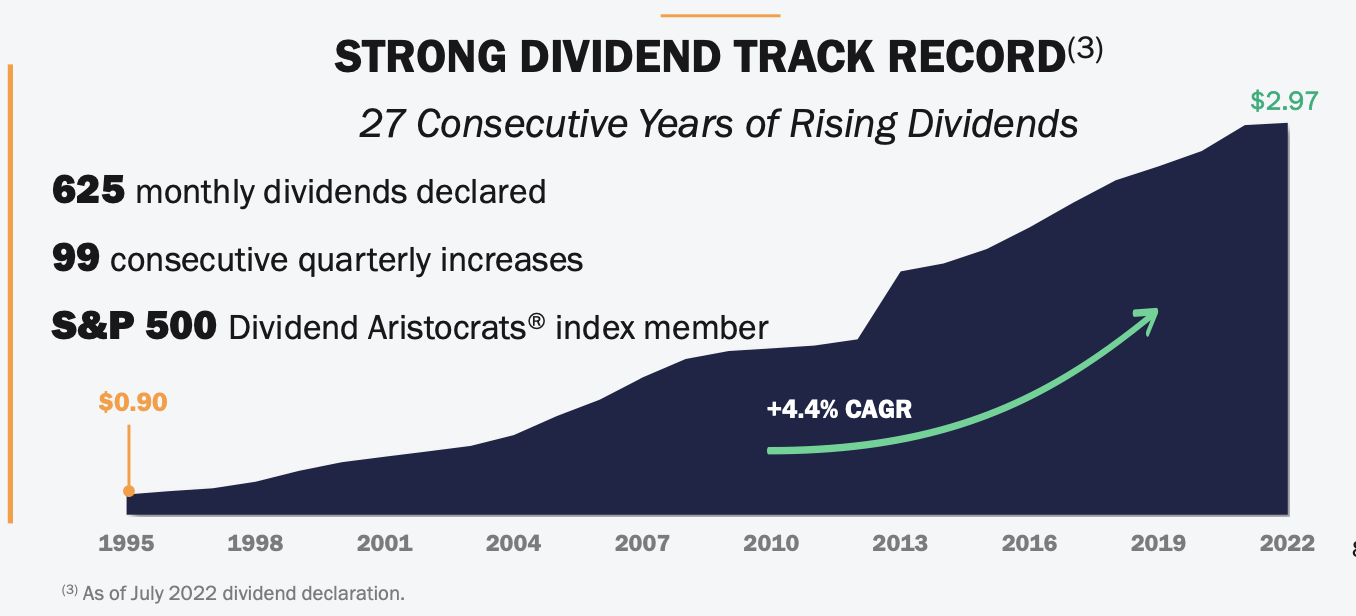
Nominal Dividends Over Time (Realty Income – August 2022 Investor Presentation)
The Bureau of Labor Statistics “BLS” publishes CPI data and offers a handy calculator here.

Inflation 1995 – July 2022 (BLS CPI Calculator)
The dividend increased $2.07 over that 27-year period, from $0.90 to $2.97. However, $0.87 of that $2.07 increase (i.e. 42%) was required just to maintain the initial value of the dividend. The real CAGR was about 1.9%, significantly less than the 4.4% CAGR nominal increase, but still positive.
The share price (not shown) increased from $8.59 on 1 January 1995 to $68.29 over that period. However, $8.34 of that increase was required just to maintain the initial value of the share price. For the share price, the real CAGR was about 5.3%, again significantly less than the 8.0% nominal CAGR, but still positive.
Chart Analysis
I used YCharts here because it’s convenient, but other packages are similar. In an investment analysis, one might see something like the chart for Realty Income below (starting 5 years before the 01 January 2021 pivot repoint). Over the past almost 7 years, the chart shows that Realty Income saw a 15% increase in price and a 25% increase in dividend payment.
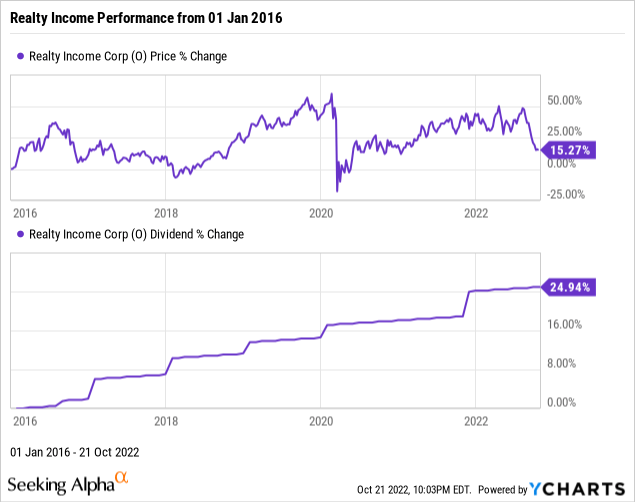
However, the CPI increase over this period is 25%. In terms of real returns, an investor lost about 9% of value by price, and saw dividend increases that just matched inflation.
Custom Excel Analysis
For another view, we can look at nominal dividends, inflation, and the real dividends left after inflation, on a year by year basis. In this case, everything is on the same chart.
The dividends yields are the average yield for the year from Seeking Alpha, the inflation data from the World Bank via the Federal Reserve, and for the estimated 2022 year, the FOMC. The impact of increased inflation in 2021 and 2022 is evident.
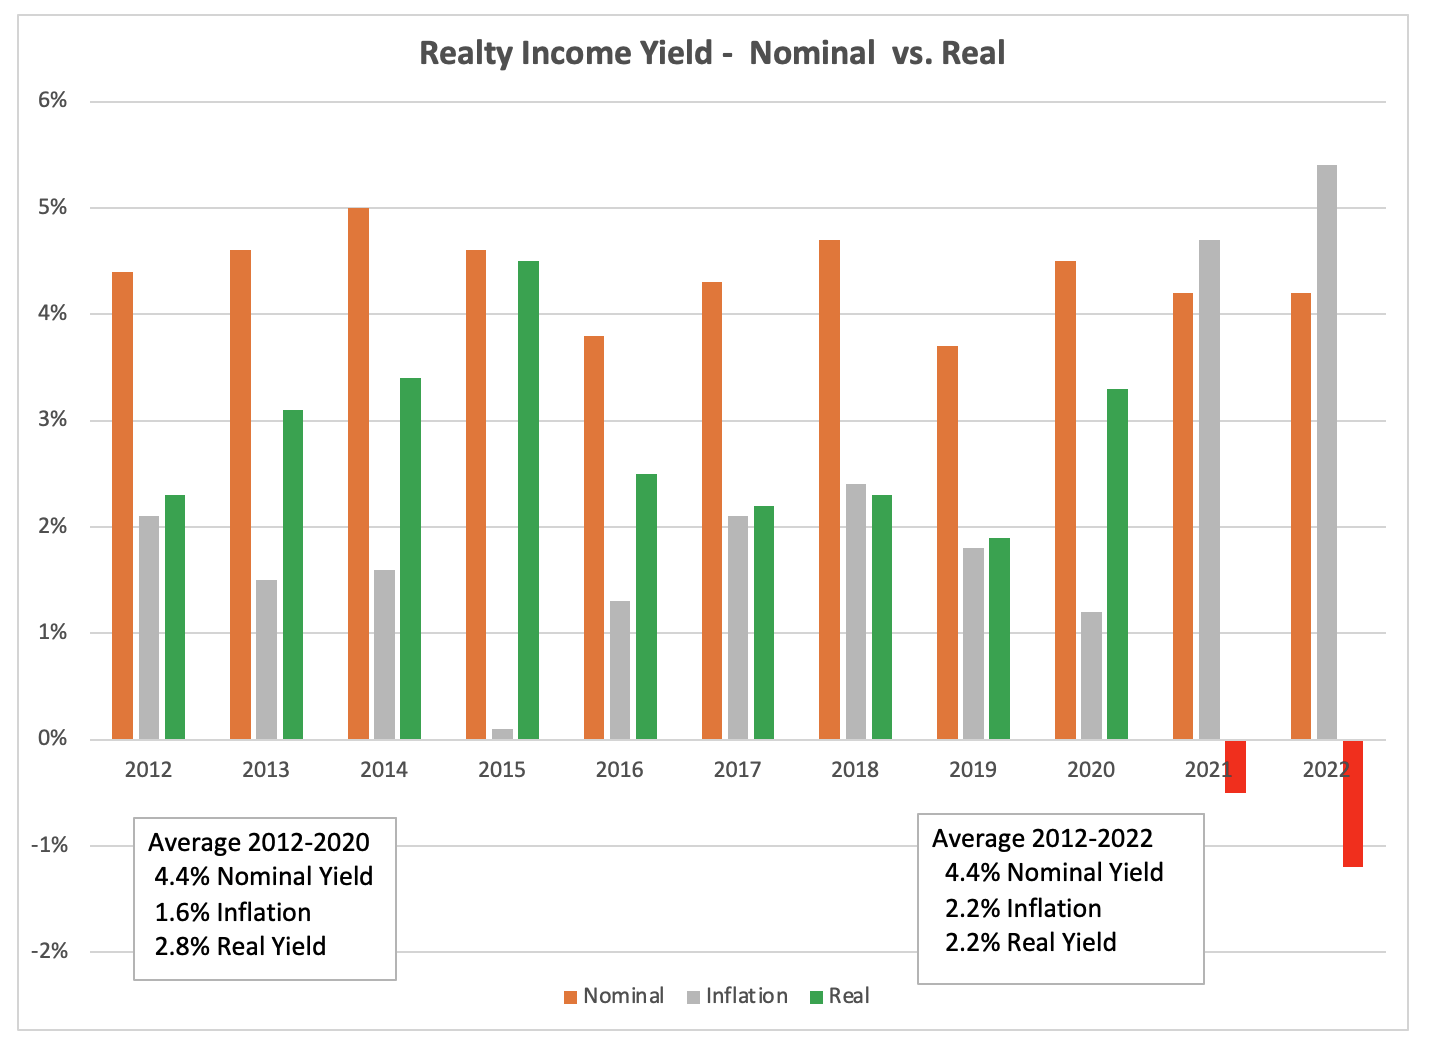
Realty Income Yield (Chart by author, data from SA, Federal Reserve)
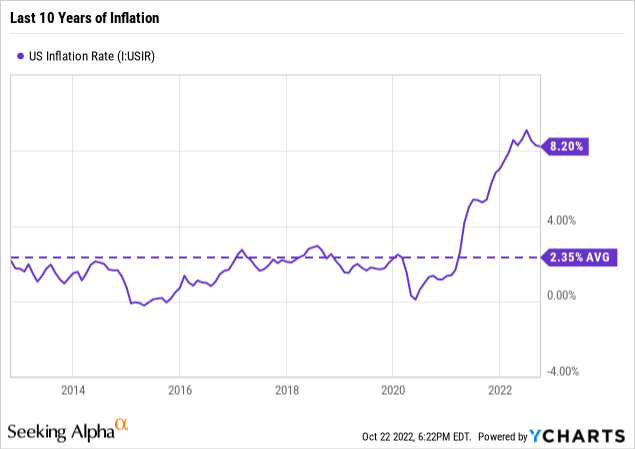
CPI Over the Last Decade
We can see inflation rate plotted here for the last 10 years, with I:USIR is monthly CPI. There is a clear change, around the 01 January 2021 pivot point.
If we exclude the data after our pivot point, we see the chart below; 1.5% average inflation.

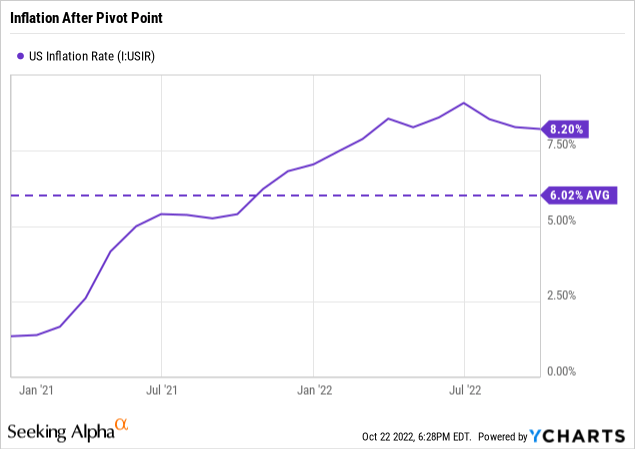
If instead we focus on the period after pivot point, we see the chart below; 6% average inflation.
In recent years, up to ~ 18 months ago, an investor could assume that the difference between nominal and real returns – about 1.5% – was small enough to ignore in most assessments.
However, with inflation at current levels, that assumption is more difficult to justify.
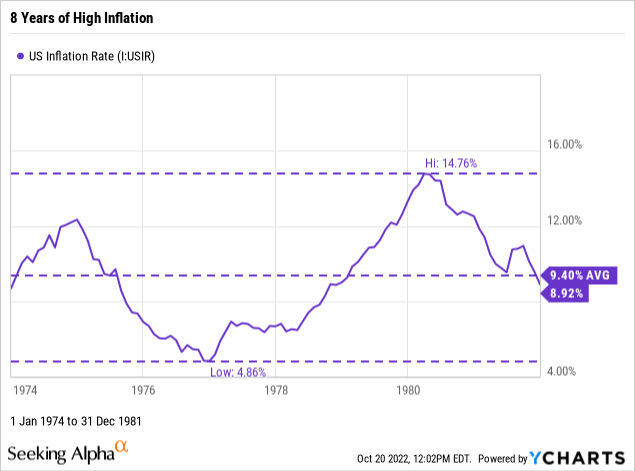
What High Inflation Looks Like
The US had had sustained periods of relatively high inflation. There are probably still a few senior managers around who have personal memories of adjustable rate mortgages resetting to 12%, and twice a year cost of living salary adjustments, but for most people in the investment community the idea of significant sustained inflation is abstract textbook material.
The chart below illustrates that experience – an 8-year period with average inflation above 9%.
It’s interesting to note the correlation with energy supply issues. The first oil embargo – which raised energy prices 3X – started in October 1973. The second oil supply crisis in 1979 caused energy prices to increase 2X. These events are clearly visible on the chart below, which shows WTI prices in October 2022 dollars. The grey bars are recessions.
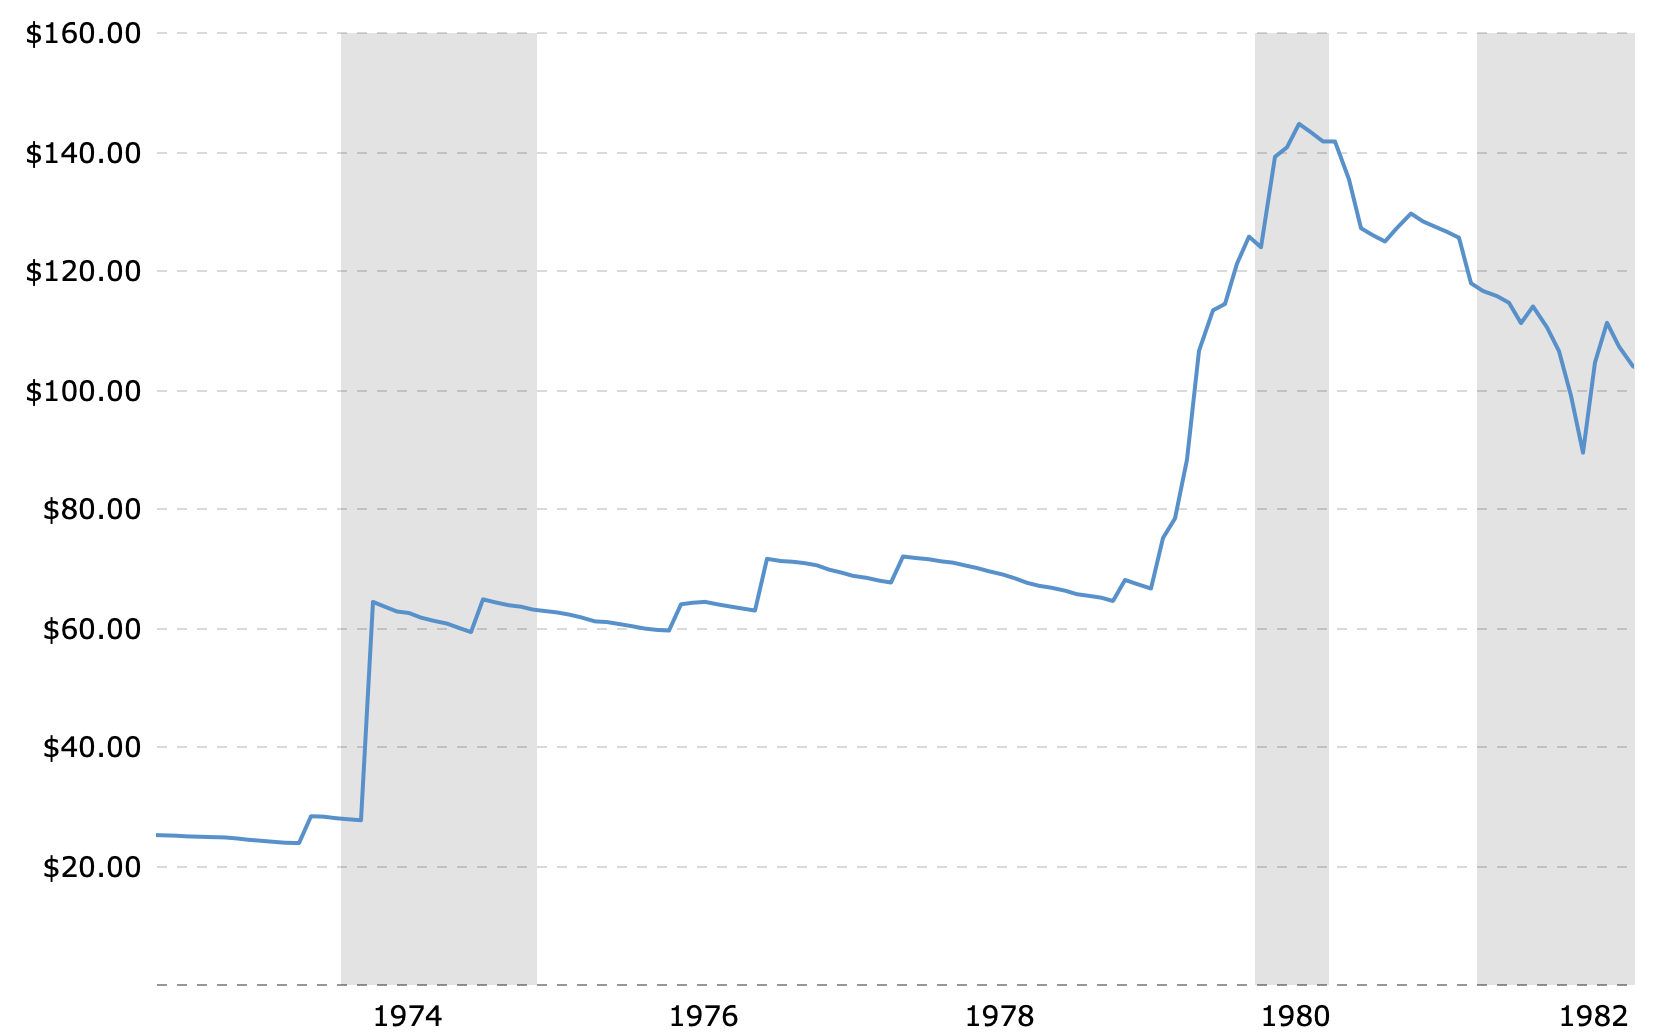
WTI Oil Prices – 2022 Dollars (Macro Trends)
Inflation Expectations Going Forward
The Federal Reserve’s Open Market Committee “FOMC”, provided estimates for inflation and other metrics after their 21 September 2022 meeting. The Central Tendency estimates exclude the 3 highest and lowest estimates. PCE is personal consumption expenditures.
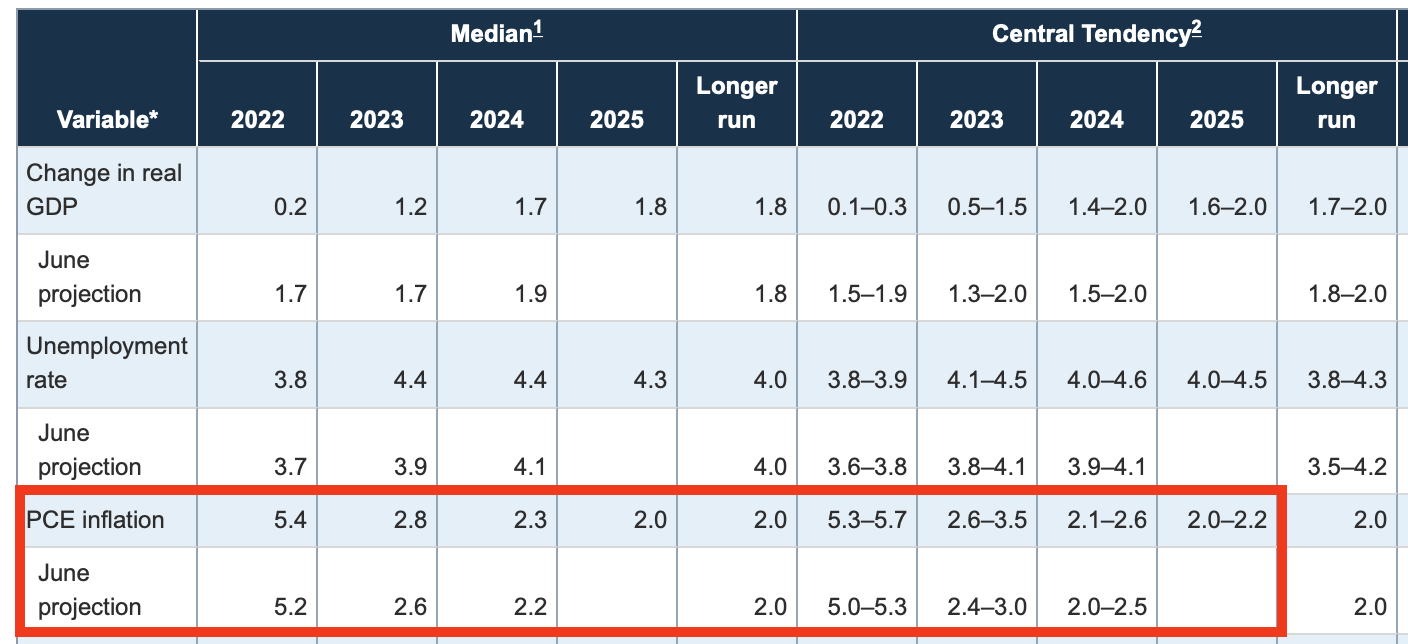
FOMC Projections (Federal Reserve Open Market Committee)
Their median estimate of PCE inflation is 5.4% for 2022 and 2.8% for 2023.
Looking out 10 years, The Philadelphia Federal Reserve Bank computes a 10-year inflation outlook called the Aruoba Term Structure of Inflation Expectations “ATSIX”; a smooth, continuous curve of inflation expectations three to 120 months ahead, analogous to a yield curve.
This combines the results of major surveys — the Survey of Professional Forecasters published by the Federal Reserve Bank of Philadelphia and the Blue Chip Economic Indicators and Blue Chip Financial Forecasts. They believe this method to be more accurate than market based forecasts.
The 30 September 2022 (latest available) result is shown below.

Inflation Exceptions – Next 10 Years (Philadelphia Federal Reserve Bank)
Looking out even longer term, the Federal Reserve Bank of Cleveland offers a projection for 30 years. It’s interesting to see the changes from September 2021 to September 2022. The September 2022 estimate shows the long-term rate at 2.4%.
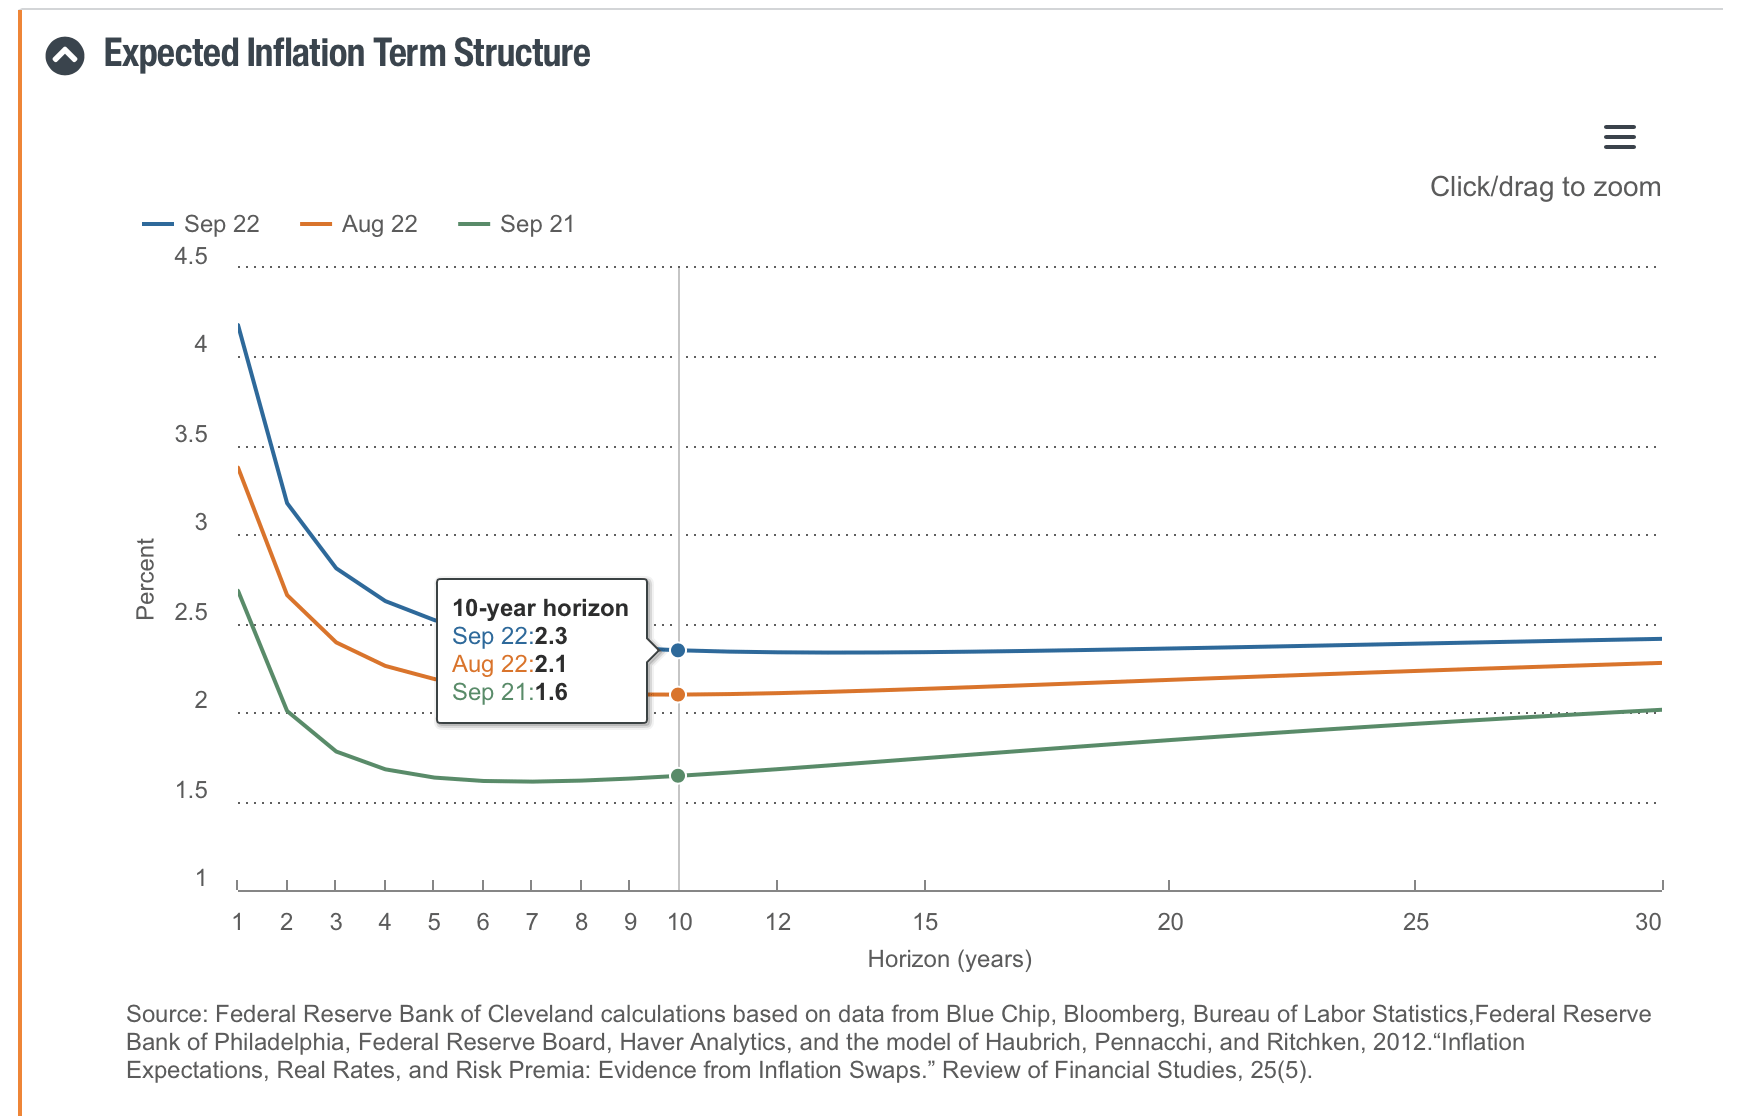
30 Year Inflation Projection (Federal Reserve Bank of Cleveland)
At least in public, FOMC members expect to be able to control inflation.
Reuters reported on 11 October 2022 that Federal Reserve Bank of Cleveland President Loretta Mester said that even with a large amount of rate rises this year, the central bank has yet to get surging inflation under control and will need to press forward with tightening monetary policy.
Mester said that inflation should come down to 3.5% by next year and back to the Fed’s 2% target in 2025. The Fed’s preferred price pressure gauge, the personal consumption expenditures price index, stood at 6.2% in August.
It’s useful to recall that 18 months ago these same forecasters almost uniformly missed the current increase in inflation. Their track record is mixed.
Other Are Less Sanguine
A number of other analysts are less sanguine, and believe the FOMC may have trouble reaching 2%, and may even be forced to settle for a new, higher inflation rate, say 4%, which would become hard to ignore in financial analysis.
The most recent University of Michigan Consumer Survey reports 5-year inflation expectations of 2.9%.
Markets Insider reports an October 2022 Bank of America analysis:
“Historically, it takes an average of 10 years for a developed economy to return to 2% inflation [once] the 5% threshold is breached,” BofA said.
Perhaps among the more bearish of mainstream views, Nouriel Roubina, New York University professor of Economics and well known author, also known as “Dr. Doom”, appearing on Bloomberg’s Odd Lots podcast in October 2022, predicting that the FOMC will “wimp out” on controlling inflation in the face of recession and stress in the financial markets.
Investor Takeaway
Today the difference between nominal and real returns is the greatest it’s been in decades.
While many forecasts call for inflation to fall to ~ 3% within a year or so, and to 2-3% over the longer term, this is not a unanimous view. The US saw nearly a decade of significantly higher inflation in the ’70s.
In the meantime, investors reviewing Q3 results should be aware that reports of year-over-year revenues, earnings, or dividend increases that are less than 8% denote a decline in real terms.
Over the longer term, even a 2.5-3% inflation rate creates a significant difference between nominal and real returns. Compounded over a decade or more, this has a material impact.
Investors who hold assets in taxable accounts may wish to carefully consider the impact on real returns of paying taxes on nominal gains.
Realty Income appears to provide a reasonable store of value, albeit with materially lower real than nominal returns. Over the long term, I would expect their physical assets to reprice to reflect real values. At the current price, I would rate it a Hold under the SA rating system.
Personally, I have owned Realty Income since the November 2021 acquisition of Vereit, Inc., and consider it a core “hold forever” asset. It is on my watch list, with a buy target near $50, which would provide a 3% real yield in the face of 3% inflation.
Be the first to comment