


jaturonoofer
There is nothing new in Wall Street. There can’t be because speculation is as old as the hills. Whatever happens in the stock market today has happened before and will happen again.”
Jesse Livermore
Bull markets are born on pessimism, grow on skepticism, mature on optimism, and die on euphoria”
Sir John Templeton
Life and investing are long ballgames.”
Julian Robertson
Introduction
Bear markets will bring even the strongest companies to their knees, with capitulation selling occurring in the last holdouts. Additionally, bear markets often mark the transition phase in secular bull and secular bear markets among different sectors of stocks. Case in point, circa 2000, I was a young investment analyst working at Charles Schwab (SCHW), and we were recommending undervalued, unloved, out-of-favor REITs at the time, including Realty Income (NYSE:O) shares, which nobody wanted.
Why?
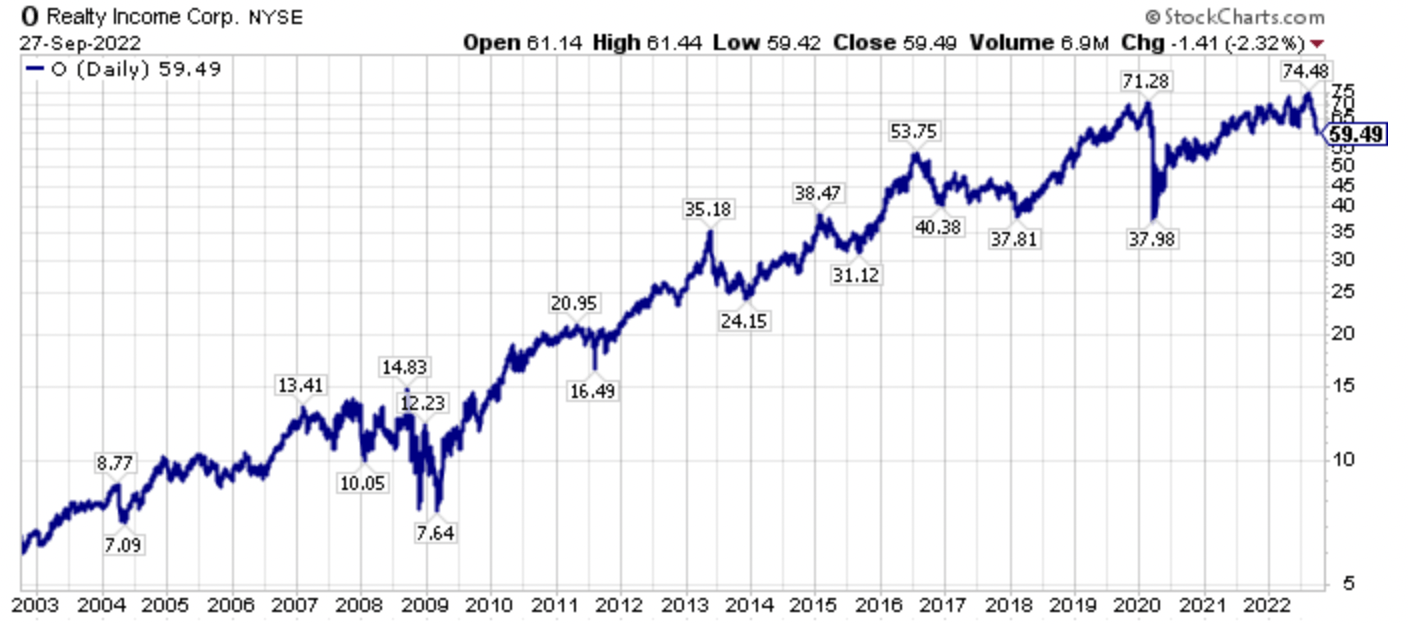
The simple answer at the time was that REITS were viewed as chronic under-performers. Looking at the very long-term price chart of Realty Income, it is easy to see why this was inferred.
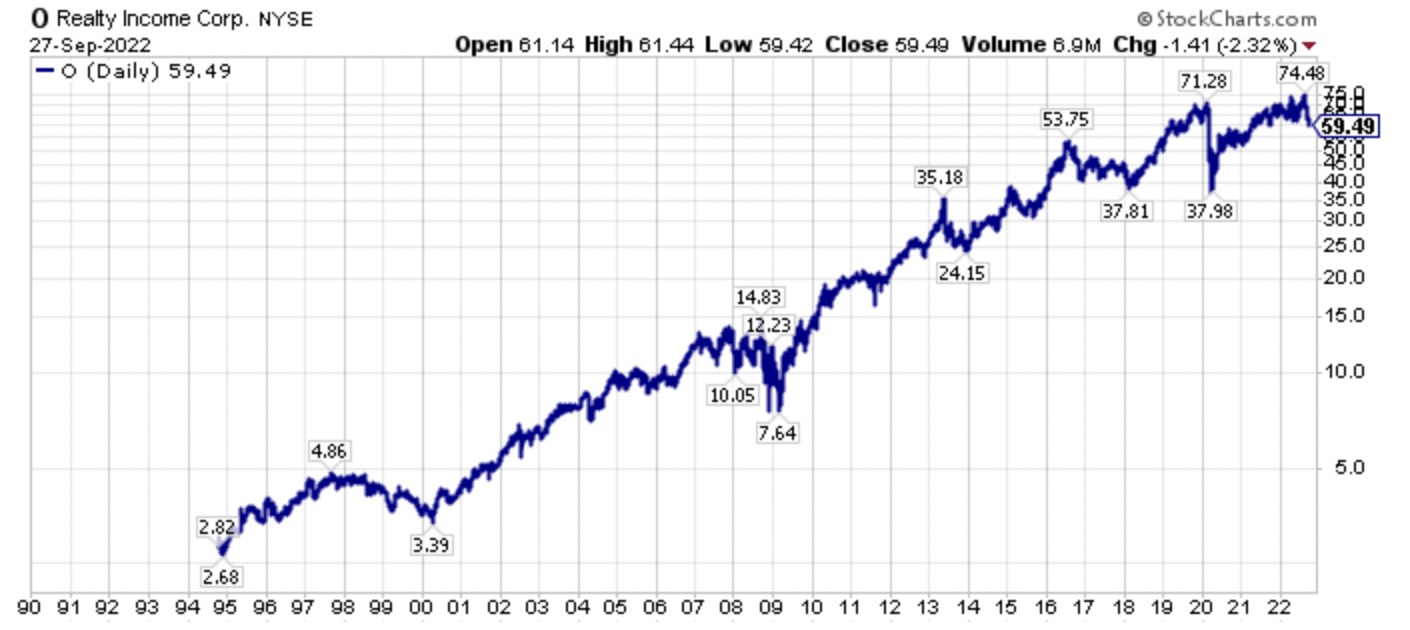
Realty Income (O) Long-Term Price Chart (Author, StockCharts)
Compared to a rocketing SPDR S&P 500 Index ETF (SPY), especially from 1997-1999, the culmination of the technology bubble, Realty Income shares declined 43.4% from their 1997 highs to their early 2000 lows.
With such disappointing relative and absolute performance in the late 1990’s, REIT shares, including Realty Income shares, were virtually abandoned by investors, despite sitting on the precipice of a two decade run of unprecedented growth. The kicker was that starting valuations were excellent.
Keep that refrain in mind, as over the past couple of years, I have been repeating the refrain that starting valuations are incredibly important.
Ironically, and coming full circle from my actual experience roughly 22 years ago, a real world example of disappointing real returns relative to expectations is Realty Income, which is a stock I wrote about publicly on Aug. 3, 2016, with the title “Realty Income Corporation: Even More Extravagantly Overpriced.”
Since that article was published, Realty Income, which is one of the most popular and written about stocks on Seeking Alpha, gaining notoriety and acclaim that it could only dream about in 2000, has severely underperformed the S&P 500 Index (SP500).
More specifically, Realty Income shares declined 12.2% on a price only basis since August 3rd, 2016, and shares have returned 14.2% on a total return basis, which is admittedly better. However, these returns are both substantially behind the S&P 500 Index return of 69.1% over this time frame, as shown by the screenshot below from my previous Seeking Alpha article.
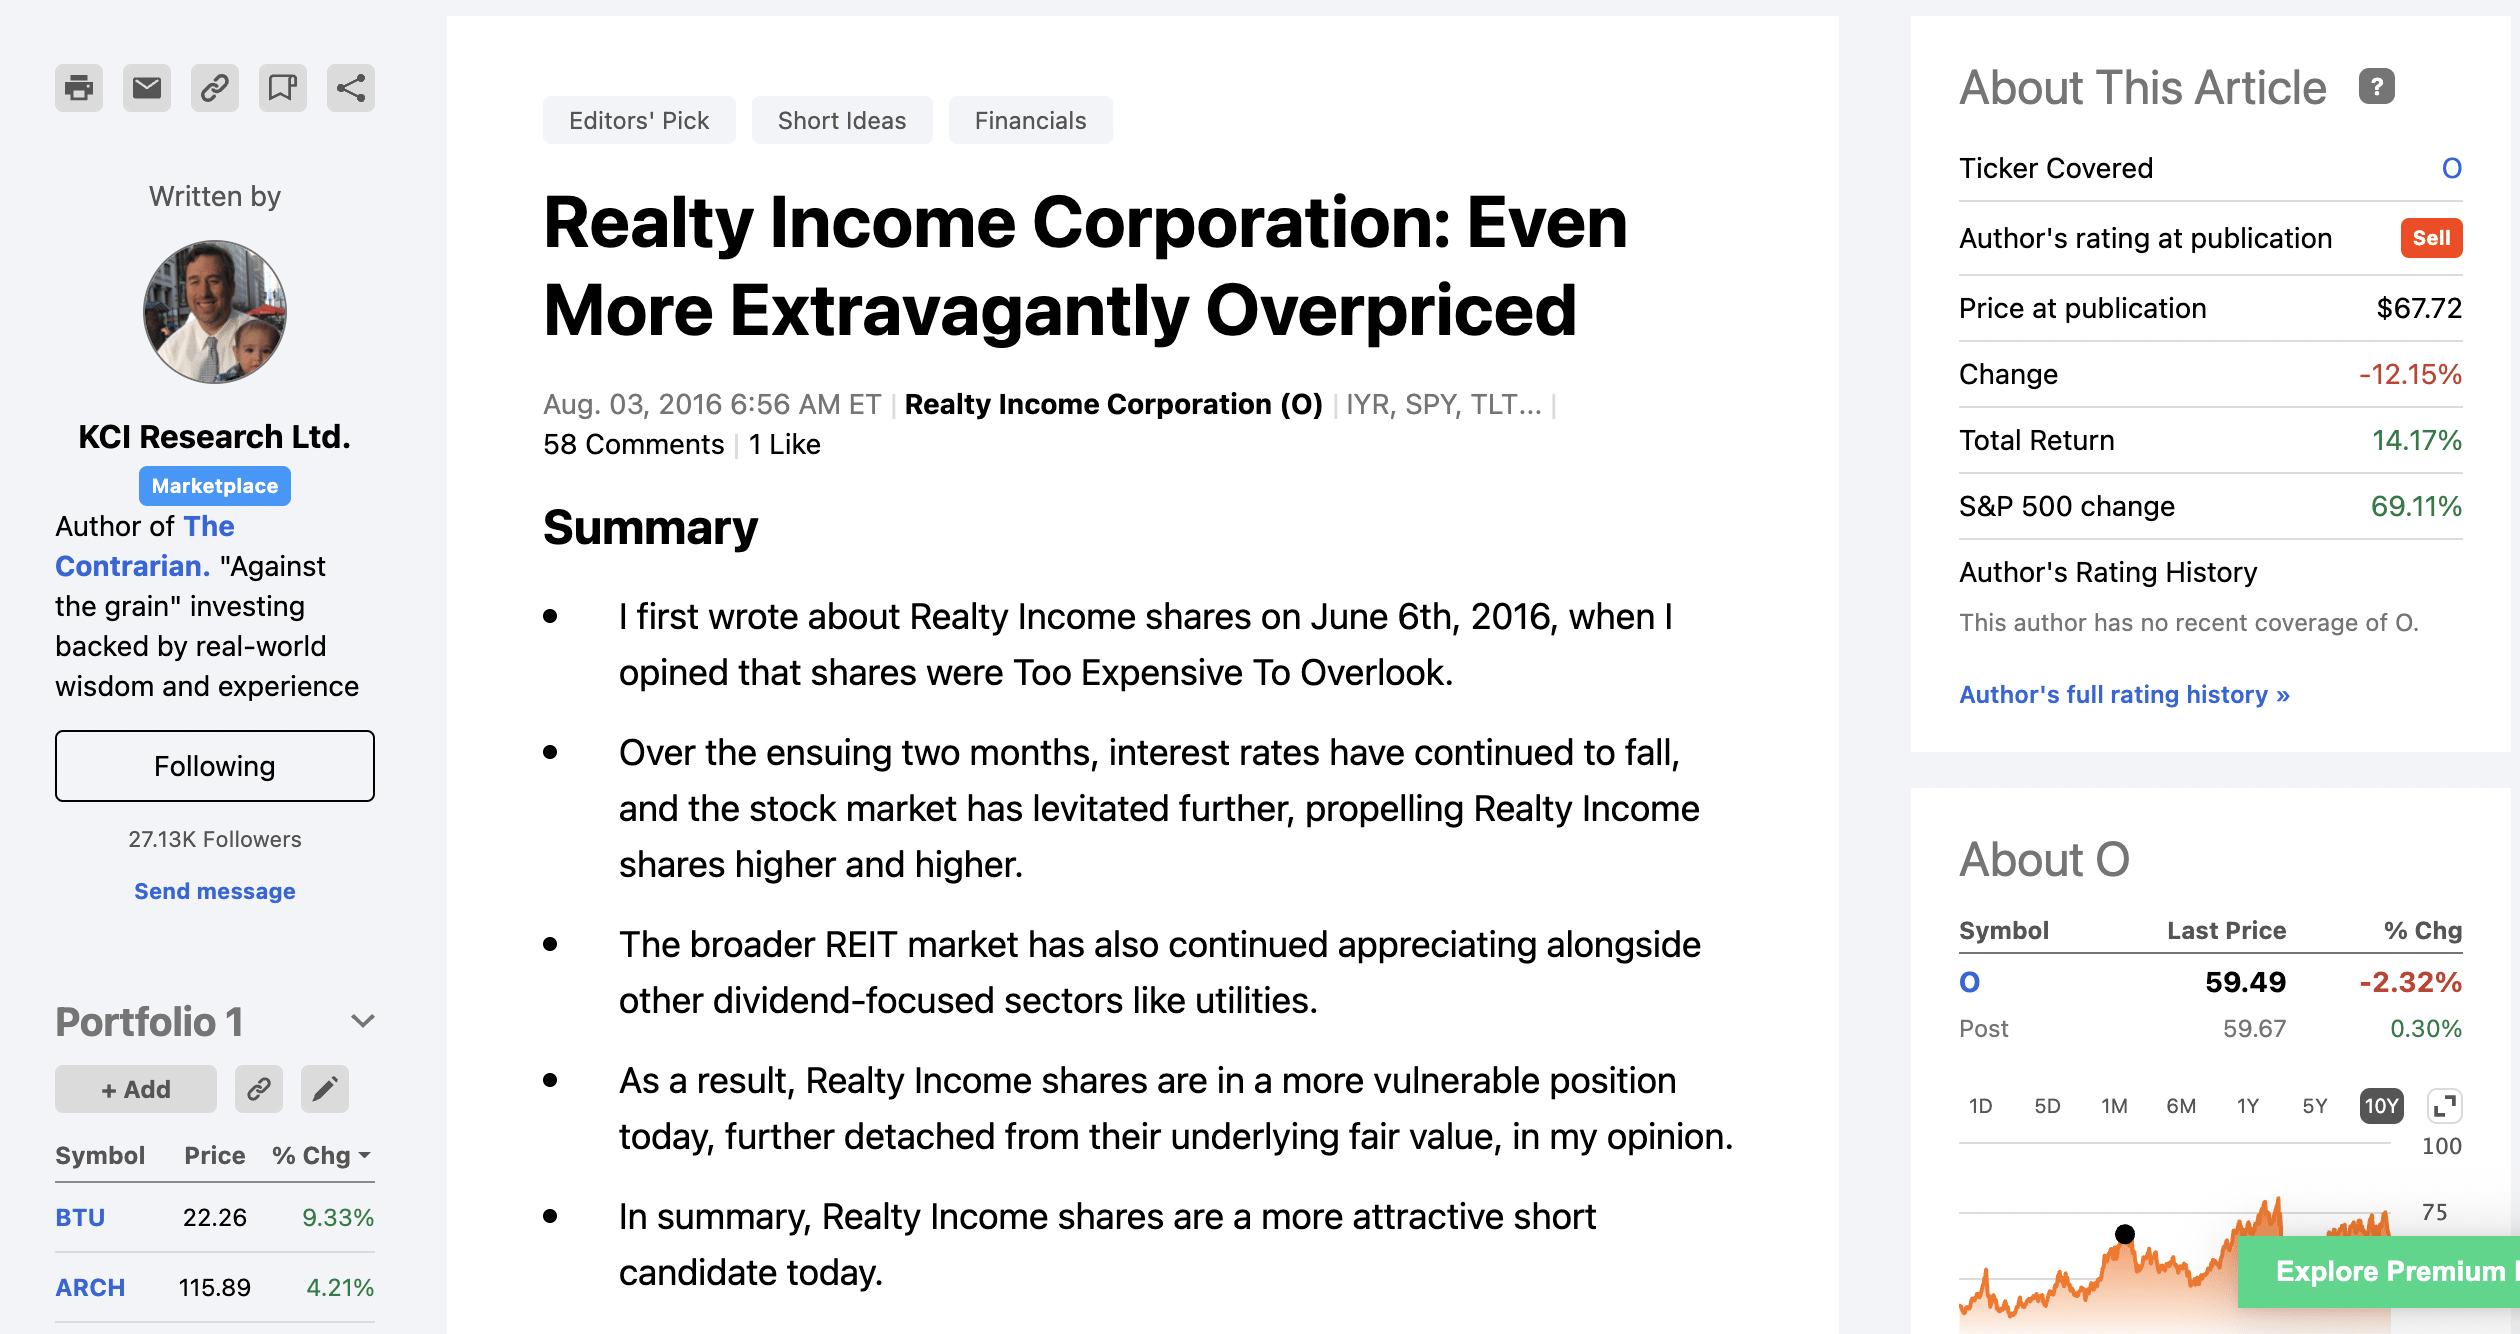
Author’s August 3rd, 2016 Seeking Alpha Article (Author, Seeking Alpha)
Taking a broader look at the REIT sector, the last six plus years have been a roller coaster for REIT shares. There was a general price rise, then a sharp plunge during the pandemic, then a furious recovery, followed by another decline as long-term interest rates catapulted higher, and recessionary fears rose.
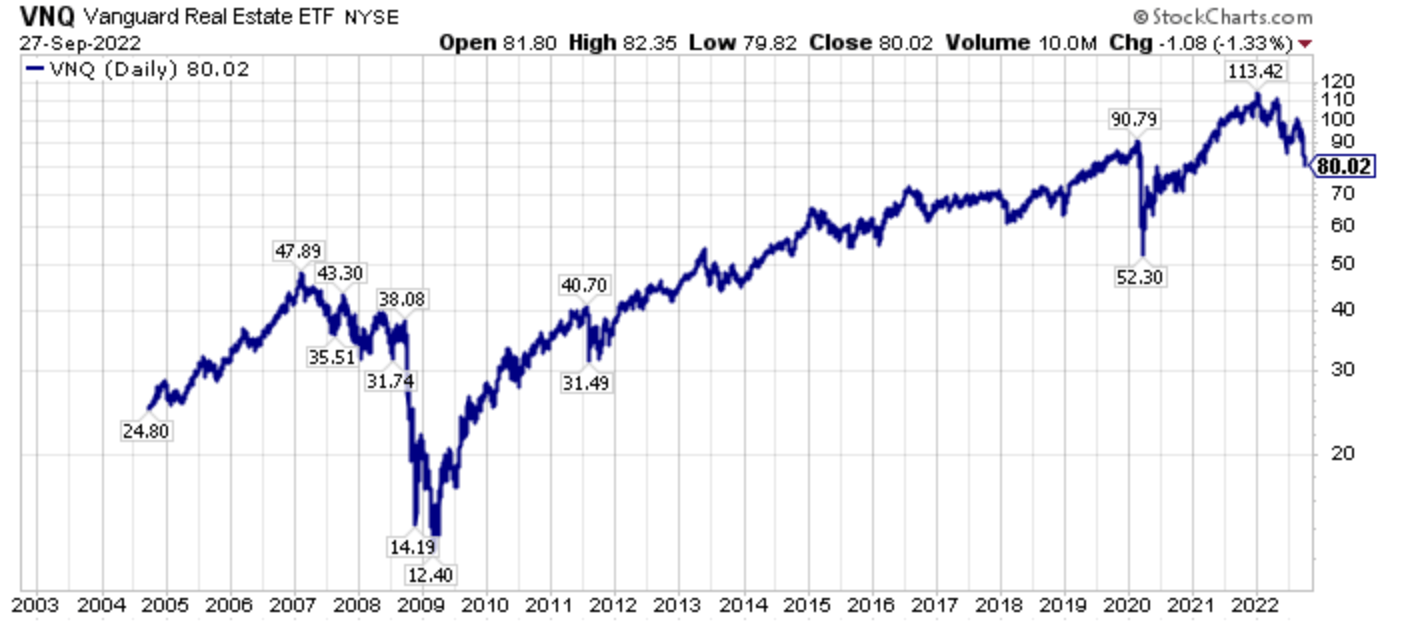
VNQ 20-Year Price Chart (Author, StockCharts)
Looking back, many REITs started to underperform materially beginning in August 2019, which was interesting, because long-term interest rates were declining substantially in 2019. With the benefit of hindsight, this was a negative divergence.
Specific to Realty Income, shares actually declined for a majority of 2016, 2017, and into early 2018, before regaining their footing. From there, shares of made a new total-return price high, though notably less than VNQ, however, shares have turned down again.

O 20-Year Price Chart (Author, StockCharts)
Bottom line, starting valuations matter, and in my 2016, article, I articulated how it would be difficult for Realty Income shares to outperform going forward, and that has indeed been the case over six years later. Going further, I would argue that Realty Income shares are not fully reflecting the higher interest rate environment, nor the building recessionary hurricane, and thus there is more potential absolute and relative downside potential in Realty Income shares. The silver lining is that this long-term consolidation will eventually lead to a new bull market, however, we probably will need to see apathy and capitulation first.
Starting Valuations Are Incredibly Important As A Determinant Of Future Returns
Lower starting valuations have consistently implied higher future annual returns in the U.S. stock market.
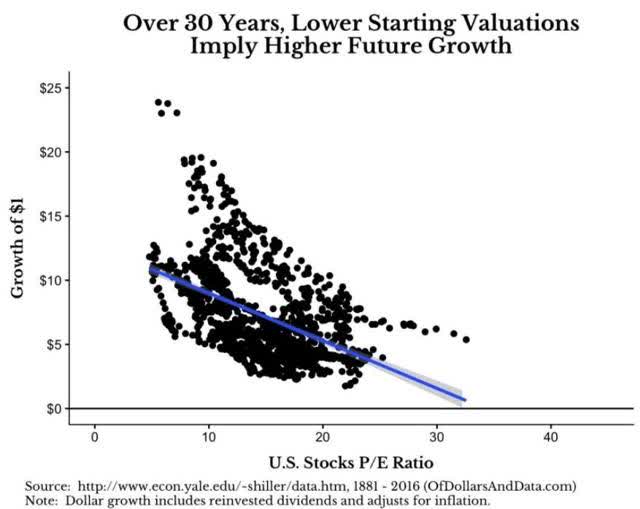
Starting Valuations Dictate Longer-Term Returns (Robert Shiller, Yale)
In my Aug. 2016 Realty Income article, I used this valuation snapshot from Morningstar.
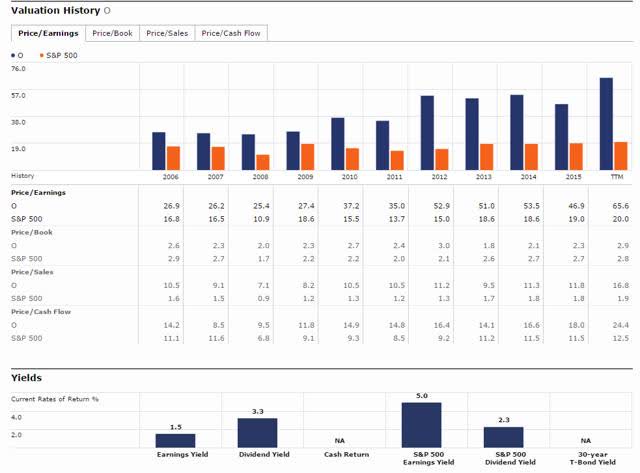
August 3rd, 2016 Valuation Table From Author’s Article. (Author, Morningstar, Seeking Alpha.)
Noting that the traditional valuation ratios listed above did not include REIT preferred metrics like FFO, I added this caveat.
The valuation metrics shown above leave out some of the preferred valuation metrics for REIT shares used by REIT investors. Having gotten that out of the way, the valuation tables show a useful mix of statistical data to compare relative and absolute valuations. From looking at the table objectively, the conclusion is clear. Simply put, shares of Realty Income have never been more expensive on an absolute or relative basis.
Realty Income’s price-to-earnings ratio (P/E) is trading at a 10-year high, at an eye-opening 65.6 for the trailing twelve months. More importantly, its price-to-cash flow ratio (P/CF) is trading at a 10-year high of 24.4 times cash flow for the TTM, and its price-to-sales ratio (P/S) is trading at a ten-year high. Clearly, on a historical basis, Realty Income’s shares are expensive compared to its own prior multiples, and expensive relative to the S&P 500 Index.
At the time I published the 2016 article, REIT investors were focusing on funds from operations, declining cap rates, and compressed cap rates. In a falling interest rate environment, that narrative made sense, though the winds have shifted today.
Building on this narrative, with rising interest rates that narrative has partially shifted to rising cap rates, rising interest rates, though I would argue we are still early in this adjustment process, which is why REIT shares could continue to struggle, especially triple-net lease REITs, whose share prices are highly inversely correlated to longer-term interest rates.
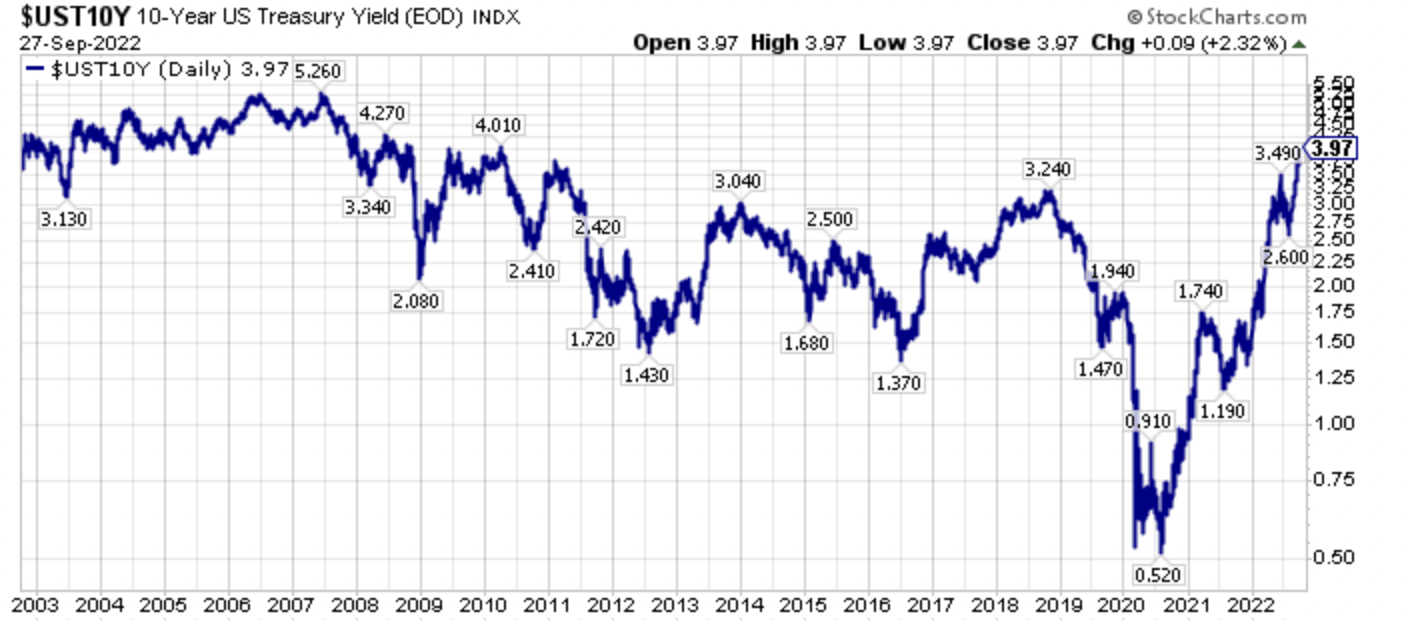
U.S. 10-Year Treasury Yields (Author, StockCharts)
Bigger picture, investors often put their capital into investments at the top of a cycle, leading to losses. The most prominent, recent example of this is the ARK Innovation ETF, which has cumulatively lost over $7 billion dollars for investors.

Cumulative Gains/Losses For ARKK (Author, Mike Green)
The ARK Innovation ETF is something I have been outspokenly bearish on with the following three public articles.
ARK Innovation ETF: Implosion Is On The Horizon
ARKK: Why Cathie Wood Is Wrong To Bet Against Commodity Prices
ARKK Implosion Is On The Horizon Part II
Different from Apple (AAPL), which I recently opined on, or the SPDR S&P 500 ETF, the ARK Innovation ETF is well into its bear market, with ARKK peaking in February of 2021. Interestingly, however, investors kept buying ARKK for most of 2022, until very recently, when inflows turned into outflows.
Tying this all together into the bigger picture, many investors have hammered in the refrain that REITs have outperformed for roughly two decades, forgetting that REITS have traded at historically high valuation multiples, all the way back to 2016 in the case of Realty Income, and that they were vulnerable to both rising interest rates and multiple compression.
Looking At The Bigger Picture Of REIT Underperformance
On July 2nd, 2020, I wrote a bullish article on Simon Property Group (SPG), titled, “Simon Property Group Shows Recovery Is Ahead Of Schedule,”.
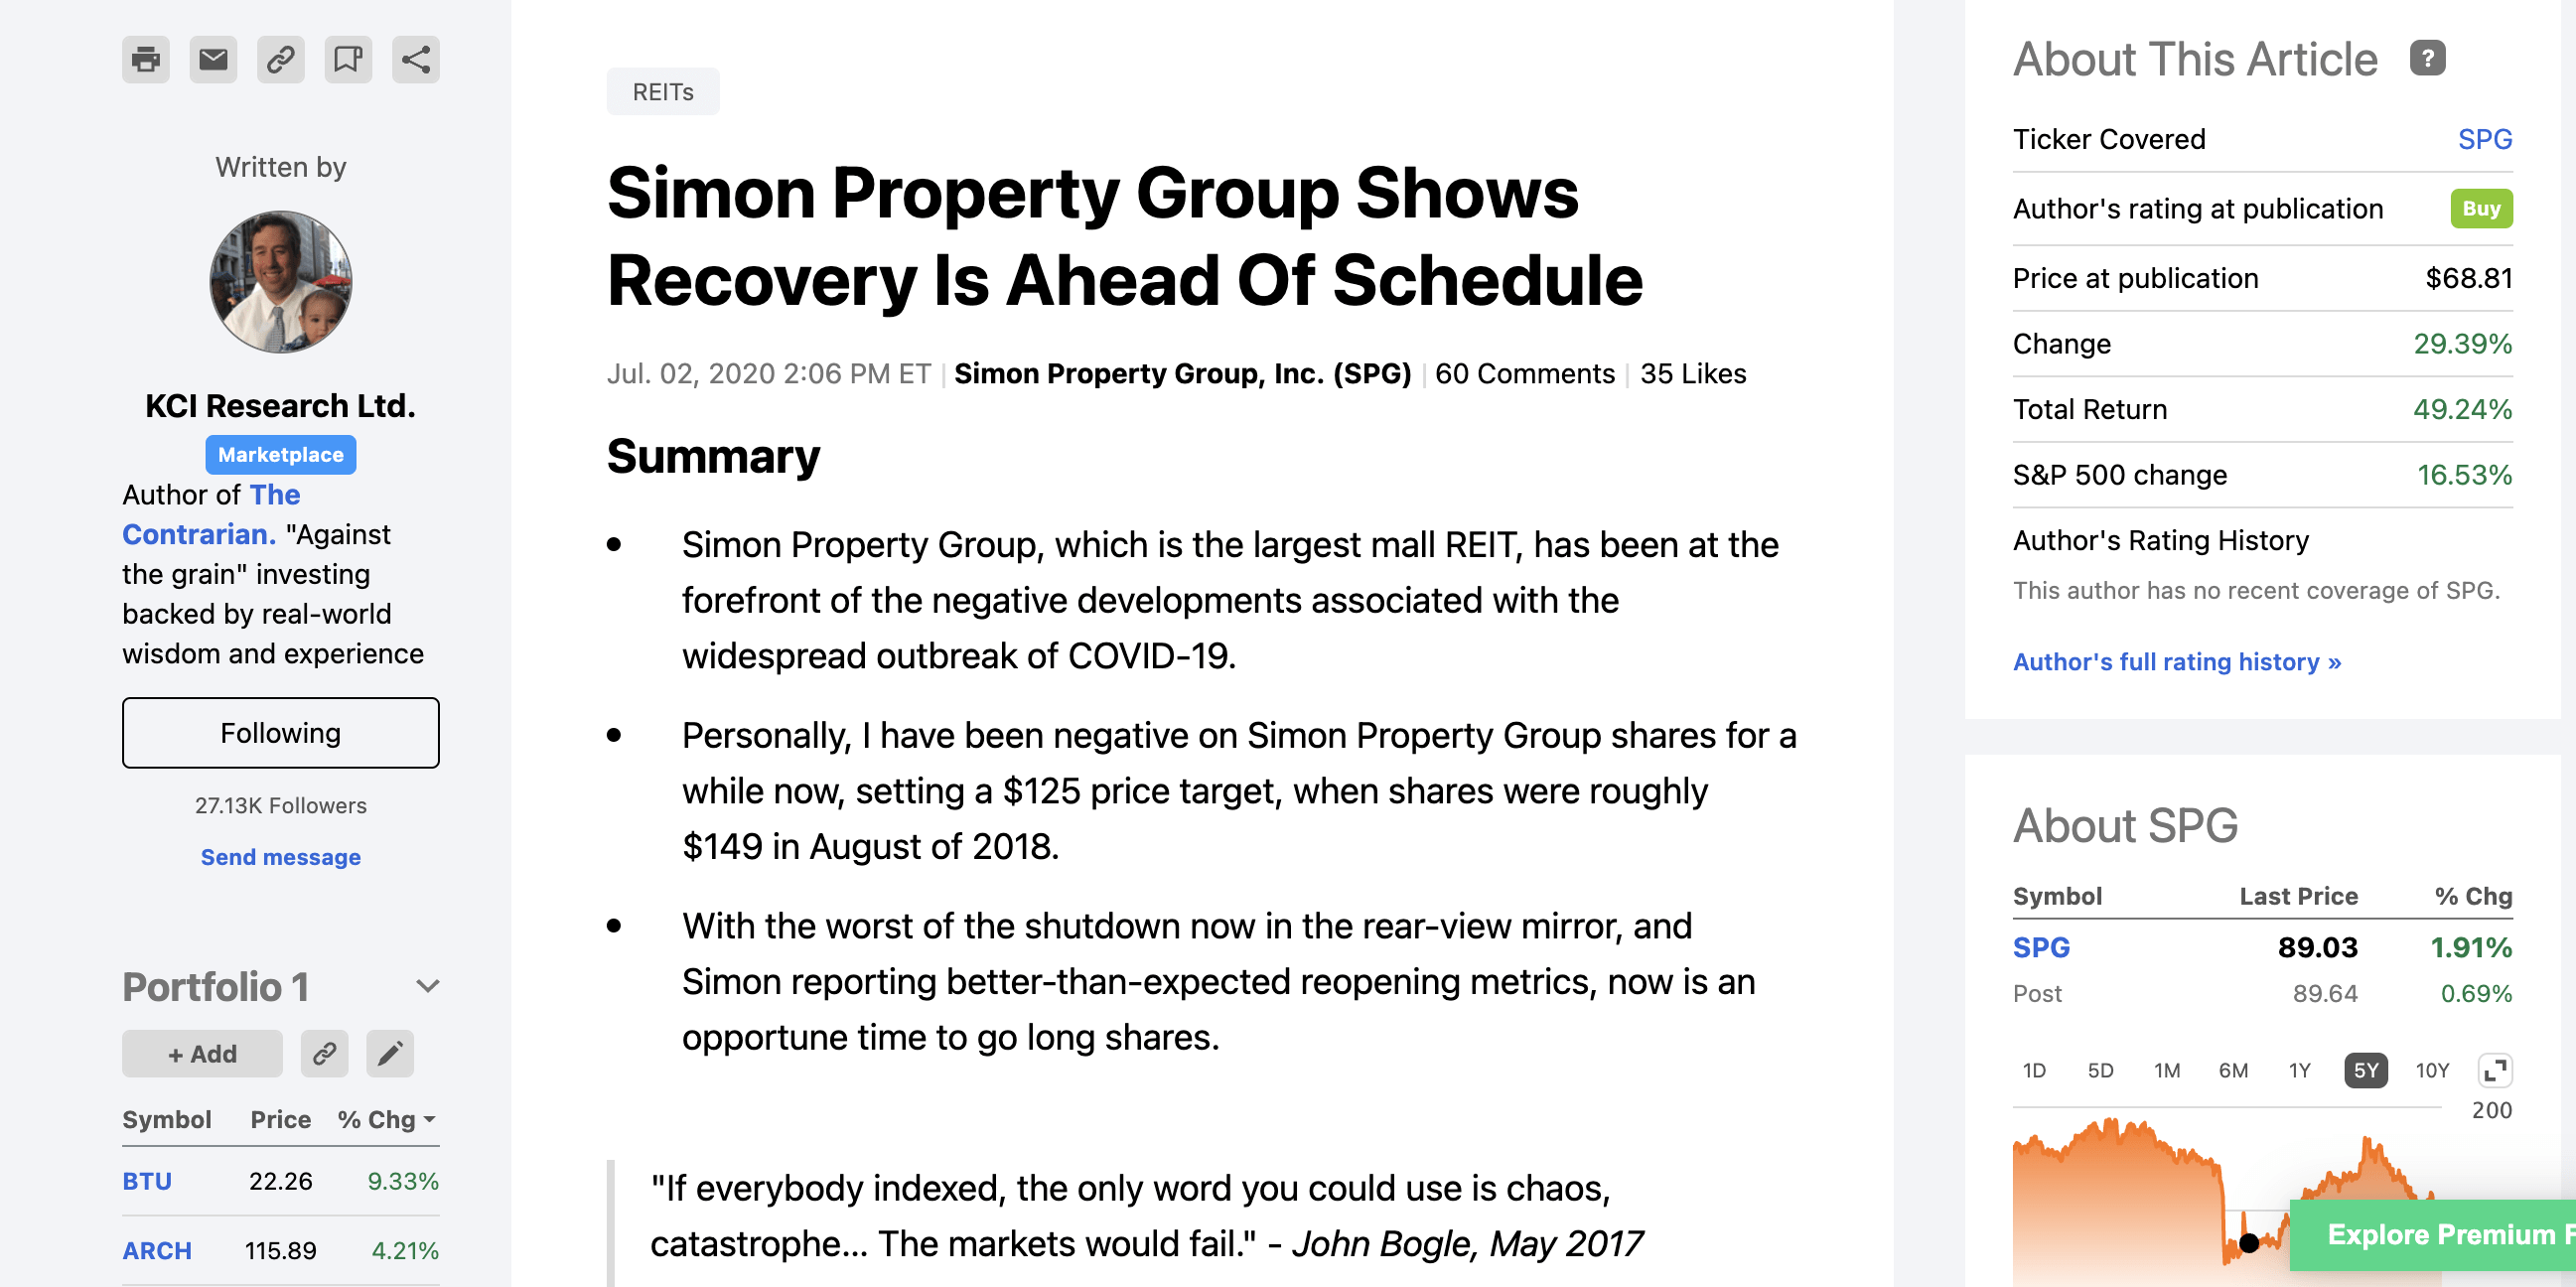
Author’s July 2nd, 2020 SPG Article (Author, Seeking Alpha)
In that article, I used the following snapshot image from The Contrarian to illustrate that I had been bearish on REITs all the way back in Aug. 2019.
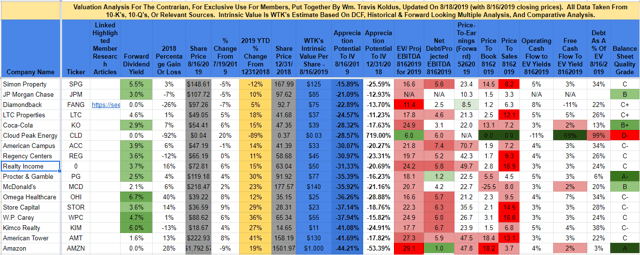
The Contrarian Valuation Table From 2019 (Author, The Contrarian)
Using that table, I then provided context, highlighting that my price targets from Aug. 2019 had largely got the directional call on REITs correct, with a couple of notable misses too. Here’s the relevant commentary that I authored from the July 2, 2020, article on Simon Property Group.
As you can see from the above image, I had a $125 price target for SPG shares on Aug. 16, 2020, when shares were trading for $148.61 that day.
Looking back at this particular window of intrinsic value price targets from Aug. 16, 2019, I got the direction right on 14 of the 17 listed equities in the table above, specifically Simon Property Group, where the stock traded at $148.61 on Aug. 16, 2019, my price target was $125, and it is trading at $70.03 as I write this article, JPMorgan Chase (JPM), where the stock traded at $107.72 on 8/16/19, my price target was $85, and it is trading at $93.40 as I write this, and Diamondback (FANG), where the stock traded at $97.26 on 8/16/2019, my price target was $75, and it trades at $40.93 today as I’m penning this article (Author’s Note, despite my miss on FANG, the energy sector is something I have hit the bullseye on the last couple of years).
LTC Properties (LTC), Coca-Cola (KO), Cloud Peak Energy, American Campus (ACC), Regency Centers (REG), Realty Income, McDonald’s (MCD), Omega Healthcare (OHI), STORE Capital (STOR), W. P. Carey (WPC), and Kimco Realty (KIM) follow the examples illustrated above, where their share prices moved in the direction of my Aug. 16, 2019, intrinsic value price targets, meaning downwards. With the benefit of hindsight, I should have been a REIT-focused analyst, as I would have saved many a lot of money, as these stocks dominated the list of my overvalued candidates circa August of 2019.
In contrast, I missed the mark on the list above, which is a partial list of my misses (this is a humbling business) with my intrinsic value price targets on Procter & Gamble (PG), which I still think investors should be short today as it is historically overpriced from my vantage point, American Tower (AMT), which has benefited from multiple secular tailwinds, and Amazon (AMZN), the singular Belle Of The Ball Stock (my terminology), that has benefited from secular tailwinds too, which I will discuss later in this article.
Again, looking at the 20-year price chart of Realty Income, it’s clear that shares struggled in 2016, through 2017, and into 2018, and then rose pretty much uninterrupted until the COVID-19 stock market meltdown.
O 20-Year Stock Price Chart (Author, StockCharts)
As mentioned briefly in the introduction, the Vanguard Realty ETF topped at $113.43 in the last year, considerably above its pre-COVID $90.79 price high, a 24.9% gain, while Realty Income only made a marginal new price high of $74.48, a scant 4.5% above its pre-COVID price high. Thus, even in the REIT recovery, fueled by monetary largesse and the low interest rates forever narrative post COVID, Realty Income shares underperformed relative to its peer group, and relative to the broader equity market.
Rising Interest Rates Remain The Reason To Be Bearish On Realty Income Going Forward
Similar to the sentiment at the time from my Realty Income article from over two years ago, reading commentary on REITs, many analysts are bullish right now, as they view the pullback as a buying opportunity.
On its surface, this makes sense, however, much different than the REIT recovery coming out of 2020, the interest rate backdrop is largely different today.
In fact, the last time I published an update in this series, the iShares 20+ Year Treasury Bond ETF (TLT) was trading at $163.82.
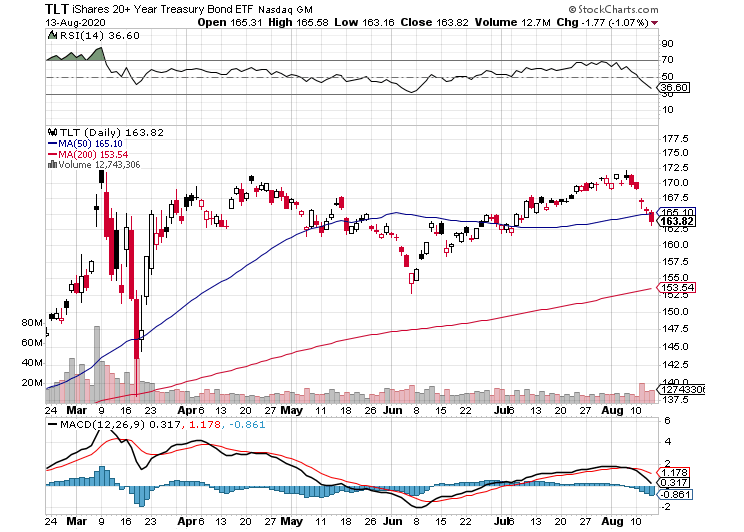
Author’s TLT Chart From The August 14th, 2020 Article (Author, Seeking Alpha)
Fast forward over two years, and the iShares 20+Year Treasury ETF has been in free-fall, now trading at $100.95, as of Tuesday, September 28th’s closing price.
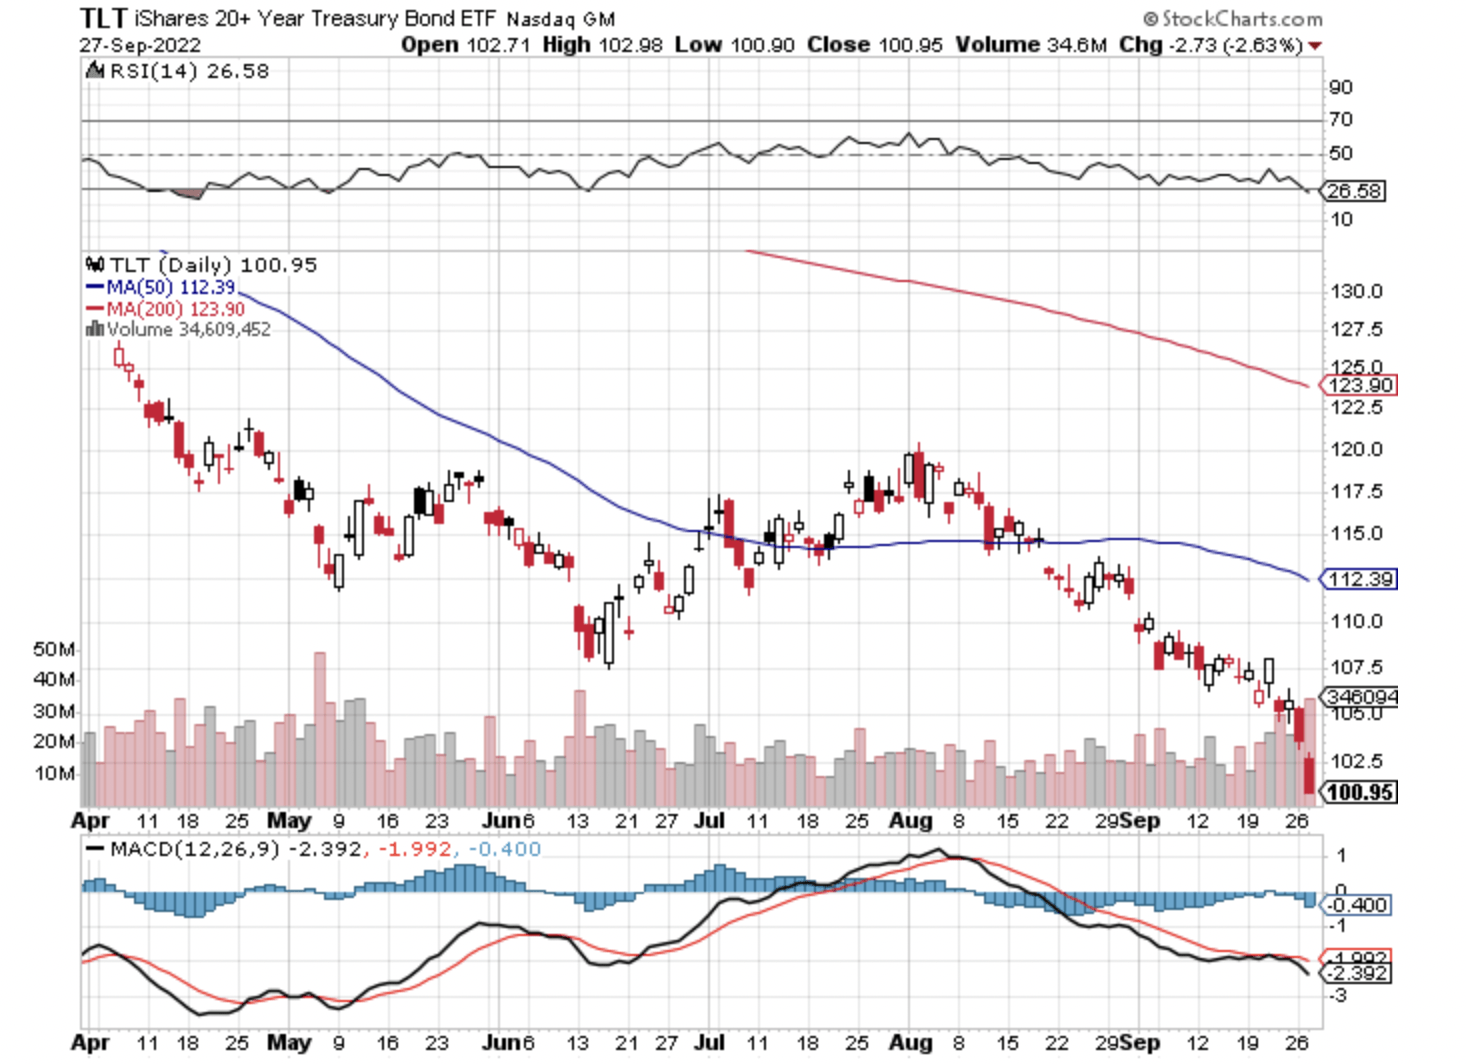
TLT Short-Term 09282022 Price Chart (Author, StockCharts)
The price destruction in long-term bonds has been enormous, with the iShares 20+Year Treasury ETF down 30.9% in 2022 year-to-date as I write this note. Now some reading this will say that this is a natural price decline given the high inflationary environment, and given that we are weaning ourselves off of monetary policy injections and fiscal injections in the aftermath of the pandemic.
Yes, this is partially true, however, TLT is down 23% since I authored the August 22nd, 2019 article titled, “TLT: Bond Bulls Being Led To The Slaughter“.

Screenshot From Author’s August 22nd, 2019 SA Article (Author, Seeking Alpha)
For perspective, the SPDR S&P 500 ETF is up 24.8% over this time frame, and Realty Income shares are down 4.2% over this time frame. Thus, so far, I would argue that higher long-term interest rates are only partially being priced in right now. This is with the 10-Year Treasury yield trading at 4% as I write this, as illustrated earlier with a chart in this article.
In a recession, could interest rates decline?
Yes, of course. However, in a structurally higher inflationary environment, or a stagflationary environment, an investor must keep open the possibility that long-term rates could stay here for a while, and any interest rate cuts at the short-end of the curve may merely steepen the yield curve.
Building on this narrative, say the Fed Funds neutral rate today is in the 2% to 2.5% range as recent policymakers have suggested. Well, if the yield curve steepens back to historical levels over the last 30-years, even if short-term interest rates are cut down to this level, we could be looking at 10-Year Treasury Yields that are closer to the 4% to 5% range for a long time.
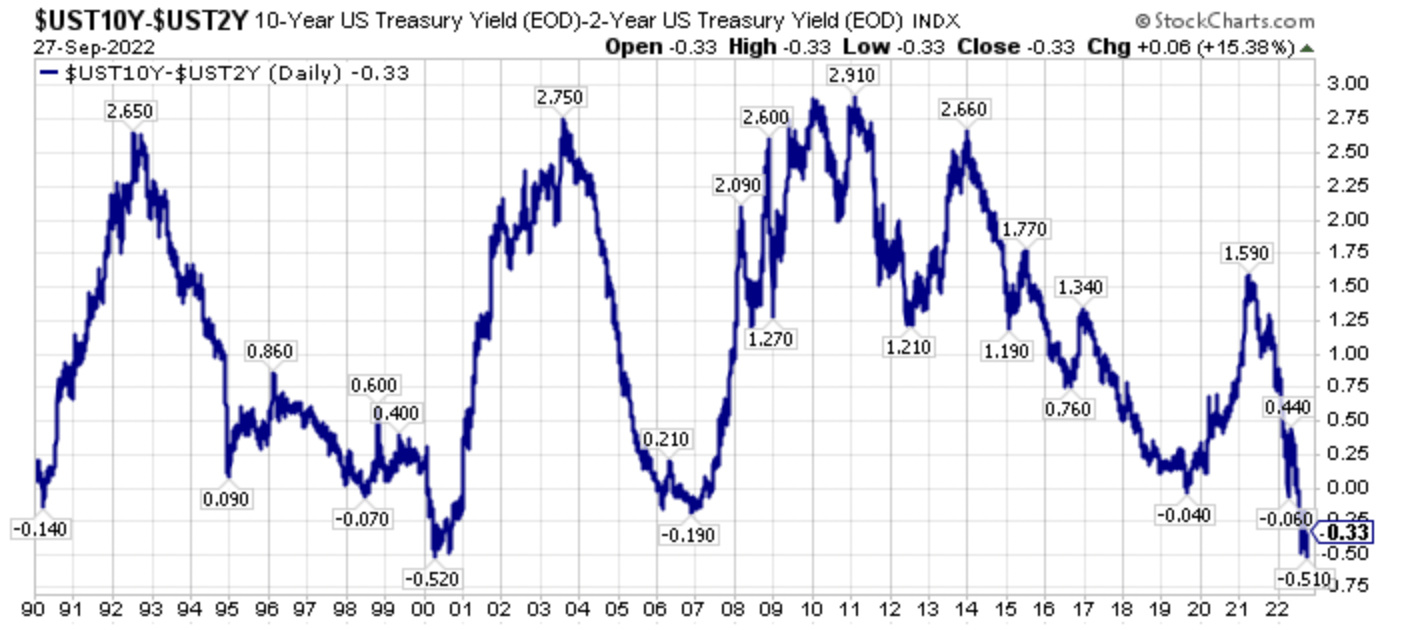
10-2 Yield Spread (Author, StockCharts)
Going further, if the neutral rate is higher, then all of sudden, all of the valuation discount work that many investors have been using has to be thrown out the window, and the price deck of many REITs will be lower as cap rates expand, driven by the higher interest rate for longer backdrop. Ironically, this is exactly the opposite of lower for longer rates that many bullish analysts have used over the preceding six plus years.
Closing Thoughts – Realty Income Shares Have Materially Underperformed The Market
For six plus years, Realty Income has underperformed the overall market and the underperformance could continue. Go back in time to six plus years ago when I authored my August 3rd, 2016 article on Realty Income, when many REIT investors were bullish on the name, and it would be hard to believe how poorly Realty Income shares have performed versus the broader equity market. Bigger picture, this long-term consolidation could continue, ultimately ending in a capitulation where many investors give up on REITs, as they did in the late 1990’s. Having said that, in the very short-term, Realty Income shares are very oversold, as long-term interest rates have risen, and the bear market has sunk its teeth into the last holdouts of strength in the broader equity market.
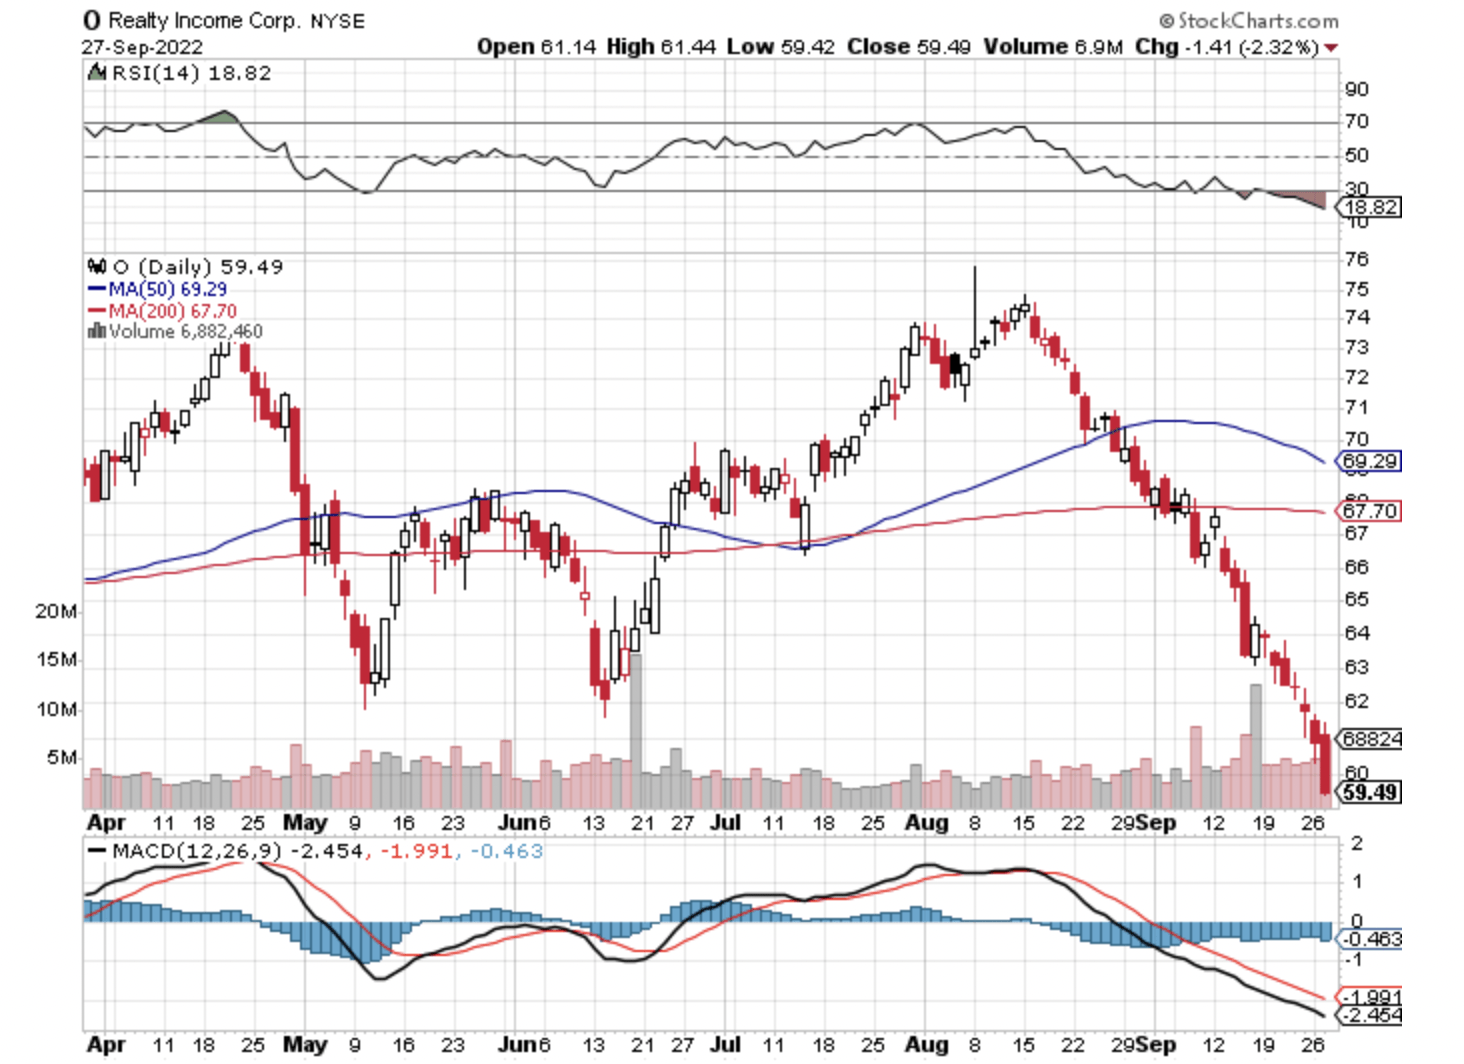
Realty Income Short-Term Price Chart (Author, Seeking Alpha)
Thus, in the very short-term, a bounce could be possible at any time, as Realty Incomes shares are short-term oversold. Looking at a monthly chart, however, Realty Income shares are rolling over on a monthly basis and the decline could be just starting.
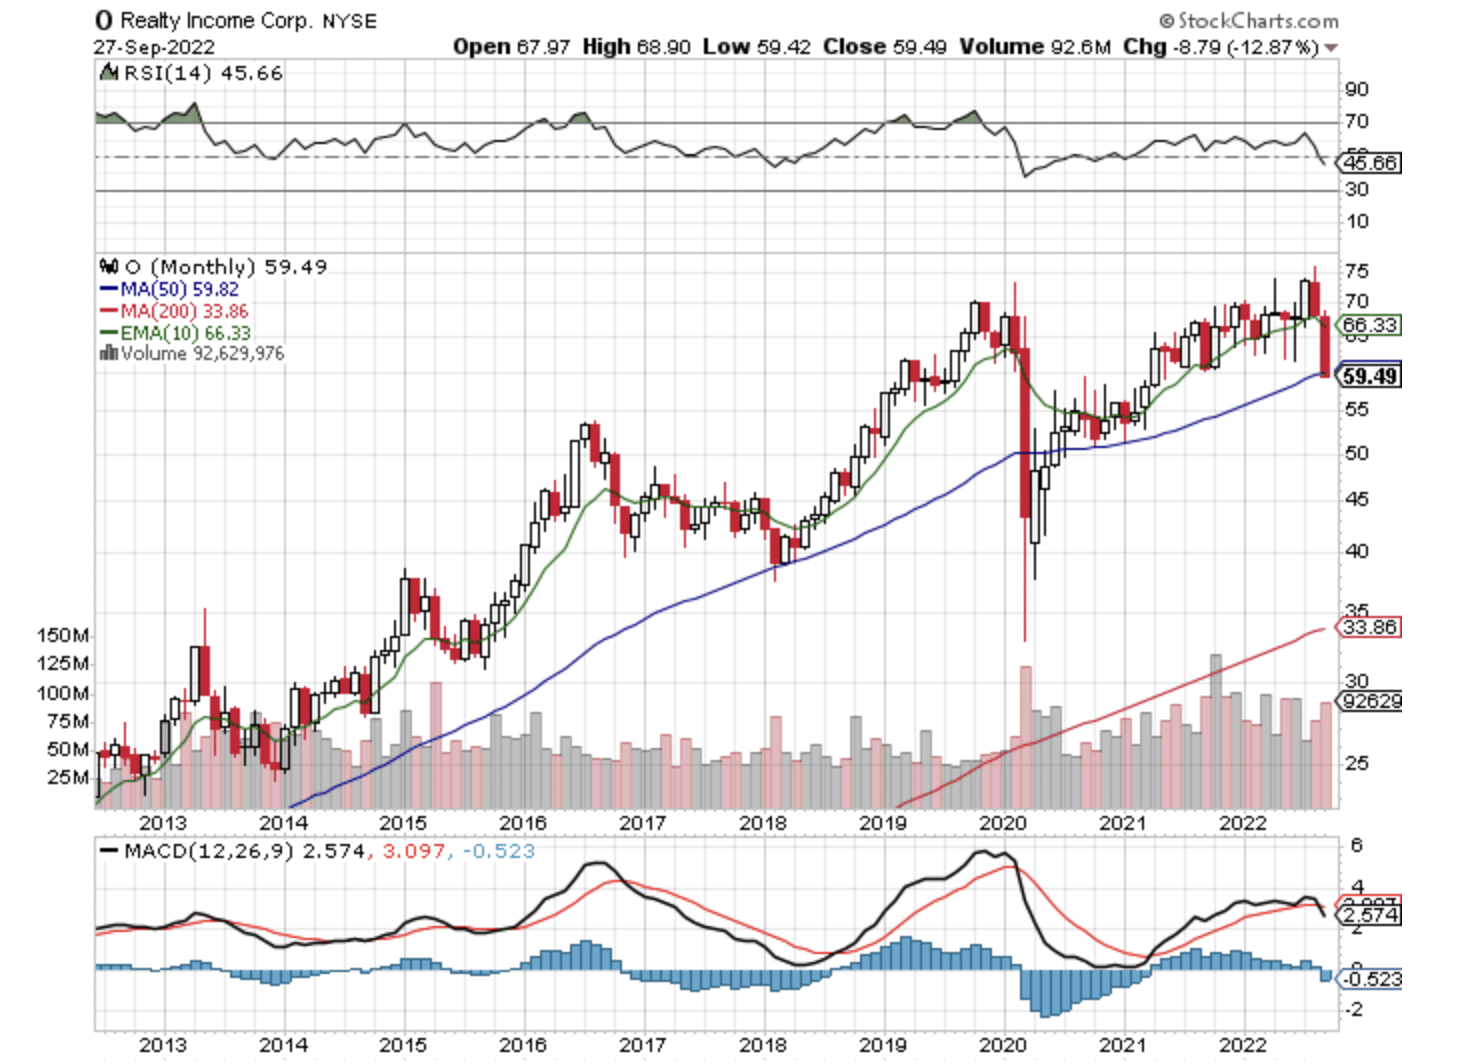
Realty Income Monthly Price Chart (Author, StockCharts)
Hard to imagine a further decline in Realty Income shares after the last month’s price drop?
Understandable, however, picture an earnings recession, as this is really not priced into the broader market yet as S&P 500 earnings estimates have remained surprisingly resilient.
To provide a bigger picture perspective, when I authored my article on Aug. 3, 2016, article on Realty Income, I had a price target of $40 for Realty Income shares, and Morningstar had a $50 price target.
Since then, my price target was nearly hit twice, and I have actually raised my discounted cash flow price target to $50 per share, two years ago, and now to $57 today. Over the same time frame, Morningstar has raised their intrinsic value price target, first to $65 per share, from $50 per share, and now to $78 per share.
Thus, there’s not extravagant downside in Realty Income shares today in a base-case scenario, unless there is capitulation selling in a broader equity market sell-off, which would be a silver lining for those looking to take a position in Realty Income. Given the relatively still poor starting valuation, as I said in my last update, there’s the very real chance that Realty Income shares deliver suboptimal performance again compared to the broader equity market as the consolidation in shares continues. Investor’s often forget, however, stock prices can go nowhere for a decade, especially in the aftermath of a long-term bull market, and with REITs in general, we did have almost two decades of consistent outperformance from 2000 through 2020.
Ultimately, starting valuations are incredibly important, and interest rates matter for interest rate sensitive assets, and REITs, specifically triple net lease REITs, are at the top of the list of interest rate sensitivity. With regard to interest rates, the focus should be on longer-term interest rates, particularly the shape of the yield curve, and both its starting valuation, which remains less than ideal, after investors have piled into Realty Income shares the past two decades. Further, the impact of rising interest rates, including the epic rise over the past year, is just being digested, and felt now. At some point in the future, when it is undervalued, and unloved again, like it was in late 1999 or early 2000, Realty Income will be a table pounding buy for investors, however, we are not there yet, in my opinion.
Wrapping up, quietly at first, and now more rapidly as the capital rotation has broadened in scope, we have seen a passing of the baton of market leadership. Once the last safe-haven equities like Realty Income succumb to the broader bear market selling pressures, perhaps this passing of the baton will be clearer, however market phase changes like this take a long time, meaning years in the process. Will there be ebbs and flows to this process? Unequivocally yes, meaning expect relative pullbacks as investors reposition, and investors of all stripes try to re-orientate around the inflection point that is occurring real time.
At this juncture, most investors are simply just becoming aware of the ongoing bear market and the leadership transition that has been taking place since the broader equity markets bottomed in March of 2020, though relative and absolute price action this year in 2022 has certainly opened more eyes.
Recognizing this changing backdrop after years of study, including being too early, I have been pounding the table on the extremely out-of-favor commodity equities for several years now, and I still think we’re in the early innings of what will be a longer-term secular bull market, albeit with significant volatility. Personally, I think we will supersede the capital rotation that took place from growth-to-value during 2000-2007, which also coincided with the last secular commodity bull market which ran from 2000-2008.
Investors skittish of commodity equities should research cast aside financials as they also will benefit from a renewed steepening of the yield curve, which is probably forthcoming following the eventual Fed pause and pivot, whenever it occurs, which could even be a year out at this juncture.
Understanding the bigger picture, then having an understanding of the bottoms-up fundamentals has been the key to outperformance, and this is a path that has not been easy with those participating confirming this reality. However, the road less taken is sometimes the better one, and I firmly believe that today, as traditional stocks, bonds, and real estate continue to offer very poor starting valuations, though they’re better than at the start of this year where I opined it was better to be in cash for the next seven years, and very poor projected future real returns from today’s price levels. More specifically, the out-of-favor assets and asset classes, including commodities and commodity equities and out-of-favor specific securities, are where the historic opportunity has been, and that’s where it still stands, from my perspective.
Be the first to comment