

jittawit.21
Thesis
We updated investors in our previous article on Realty Income Corporation (NYSE:O) to bide their time and wait for a deeper pullback to re-test its critical support zone ($62), given the macro headwinds discussed in our article.
We are pleased to inform investors that the market has answered our call, as it sent O tumbling rapidly from its August highs, down nearly 25% through its September lows. Accordingly, O underperformed the market significantly, despite being a high-quality retail-focused net-lease REIT.
We remind investors to continue paying attention to its valuations and ex-US headwinds due to the tremendous strength seen in the dollar index.
However, the battering has likely de-risked its near-term execution risks. Accordingly, it helped set up a less aggressive entry zone for investors who waited patiently, coupled with attractive valuations.
Accordingly, we revise our rating from Hold to Buy.
O Re-tested Its $62 Support Level as We Posited
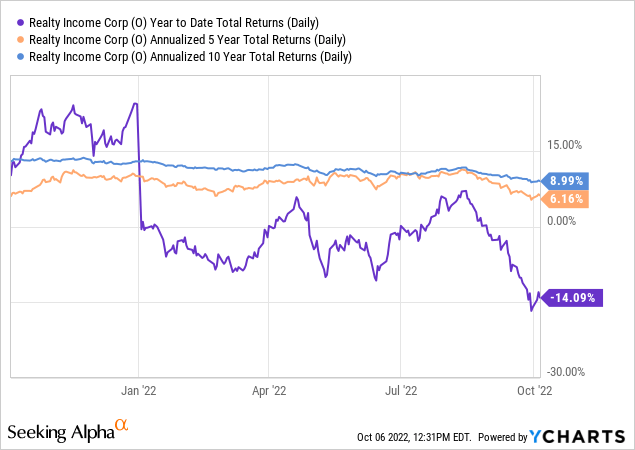
Despite the steep decline that saw O lose all its gains for 2022, investors should note that O has been a solidly consistent performer for investors over the past five to ten years, as seen above.
Notably, it posted a 10Y total return CAGR of 9%, which has been remarkably stable over time. Therefore, we believe it helps REIT investors anchor their portfolio performance well as they invest in other higher-risk allocations to drive alpha.
O price chart (monthly) (TradingView)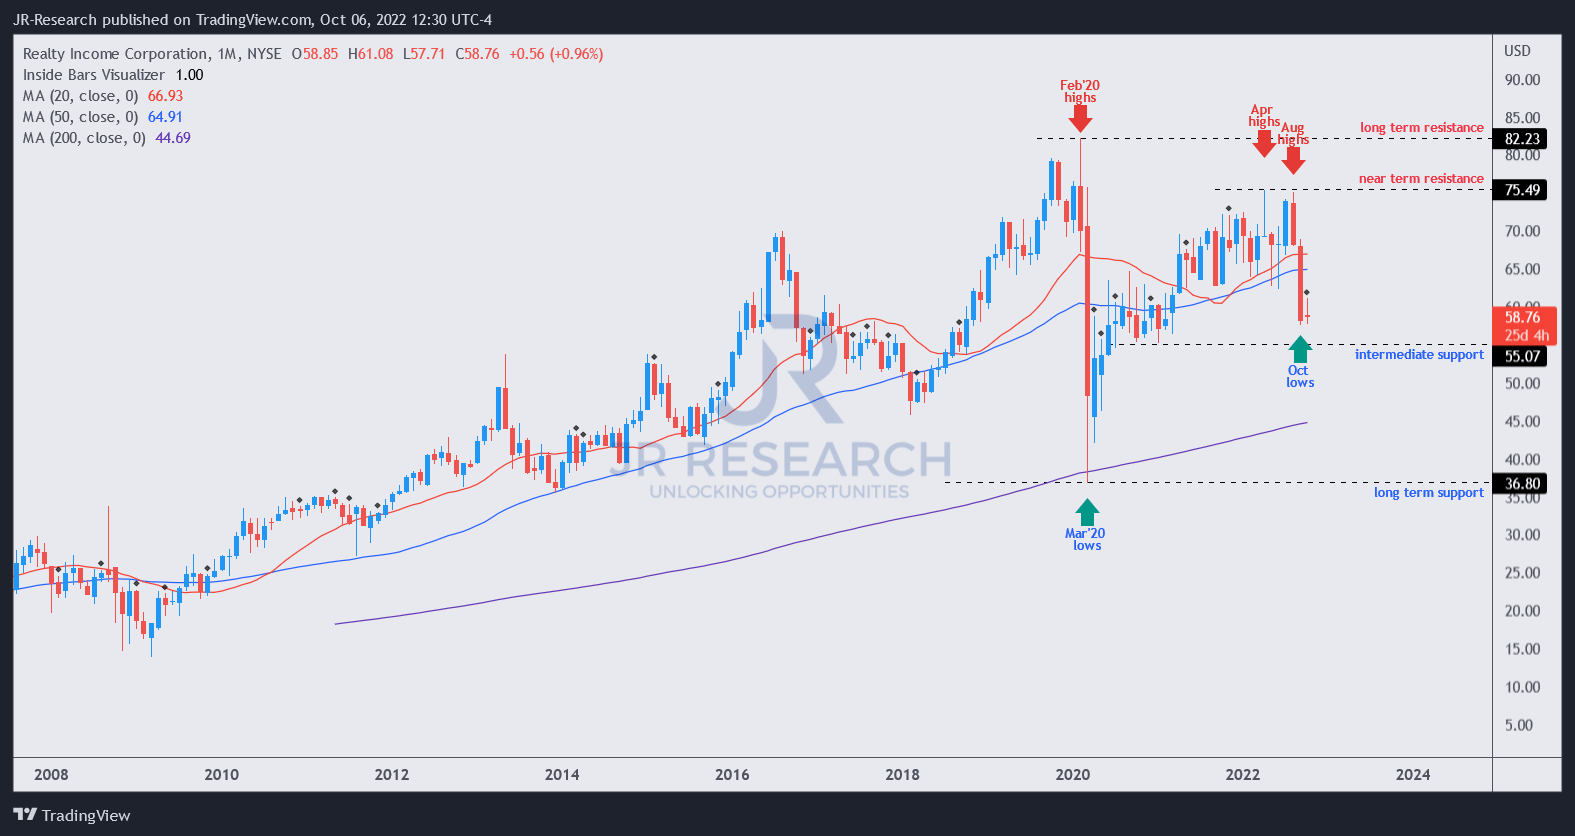
As a result, we are not surprised to glean that O has had a robust long-term uptrend over time since it bottomed out resolutely in March 2009.
Even the stunning decline in the March 2020 COVID panic turned out to be a massive bear trap (indicating the market denied further selling downside decisively). Buyers returned rapidly to support its March lows and lift O back up to its critical 50-week moving average (blue line).
Therefore, we believe it’s clear that the market has a firm conviction in management’s ability to deliver its strategy. Accordingly, we think investors need to capitalize on massive selloff opportunities that could help drive significant alpha for income investors on top of their dividend yields.
With the steepest selloff seen in O over the past two months from its August highs, we believe the opportunity is here. Let us go into greater detail with its medium-term chart.
O price chart (weekly) (TradingView)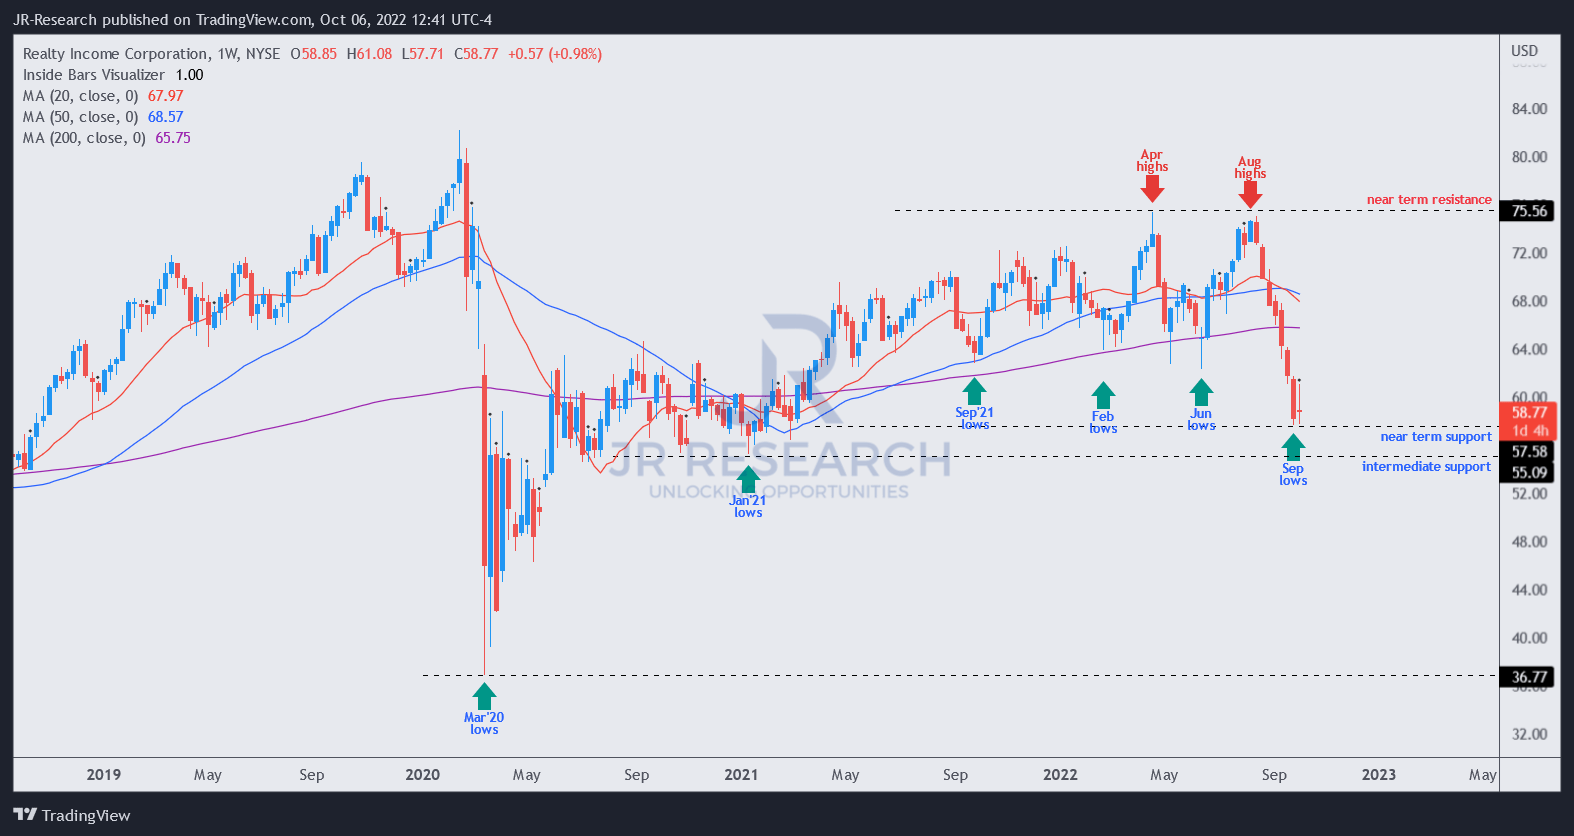
As seen above, the steep decline started in August after forming its highs at its near-term resistance. Investors need to consider that level as having significant selling pressure, with buyers losing tremendous momentum in April and August. Therefore, those levels are likely resolutely defended by the sellers, and investors should be wary about adding close to those levels for now.
Notwithstanding, the selldown sent O spiraling toward its near-term support ($58), which broke below the level ($62) that we urged investors to watch before considering adding more positions.
We believe the capitulation was likely linked to the recent worsening forex headwinds as currency speculators piled onto bullish USD trades. Therefore, the market needed to de-risk Realty Income’s significant ex-US AFFO exposure.
Furthermore, the selloff also took out O’s significant lows dating back to September 2021. As a result, the downside volatility likely worsened as these investors fled in droves to mitigate further losses. Hence, we believe a significant level of downside risks is probably reflected in the current levels.
Despite that, there’s another significant low that the market could consider taking out at its intermediate support zone. Therefore, we urge investors to layer in their positions, capitalizing on further downside volatility if the market goes into another selling frenzy. Notwithstanding, the reward-to-risk profile looks attractive at the current levels.
Is O Stock A Buy, Sell, Or Hold?
O NTM Dividend yields % valuation trend (koyfin)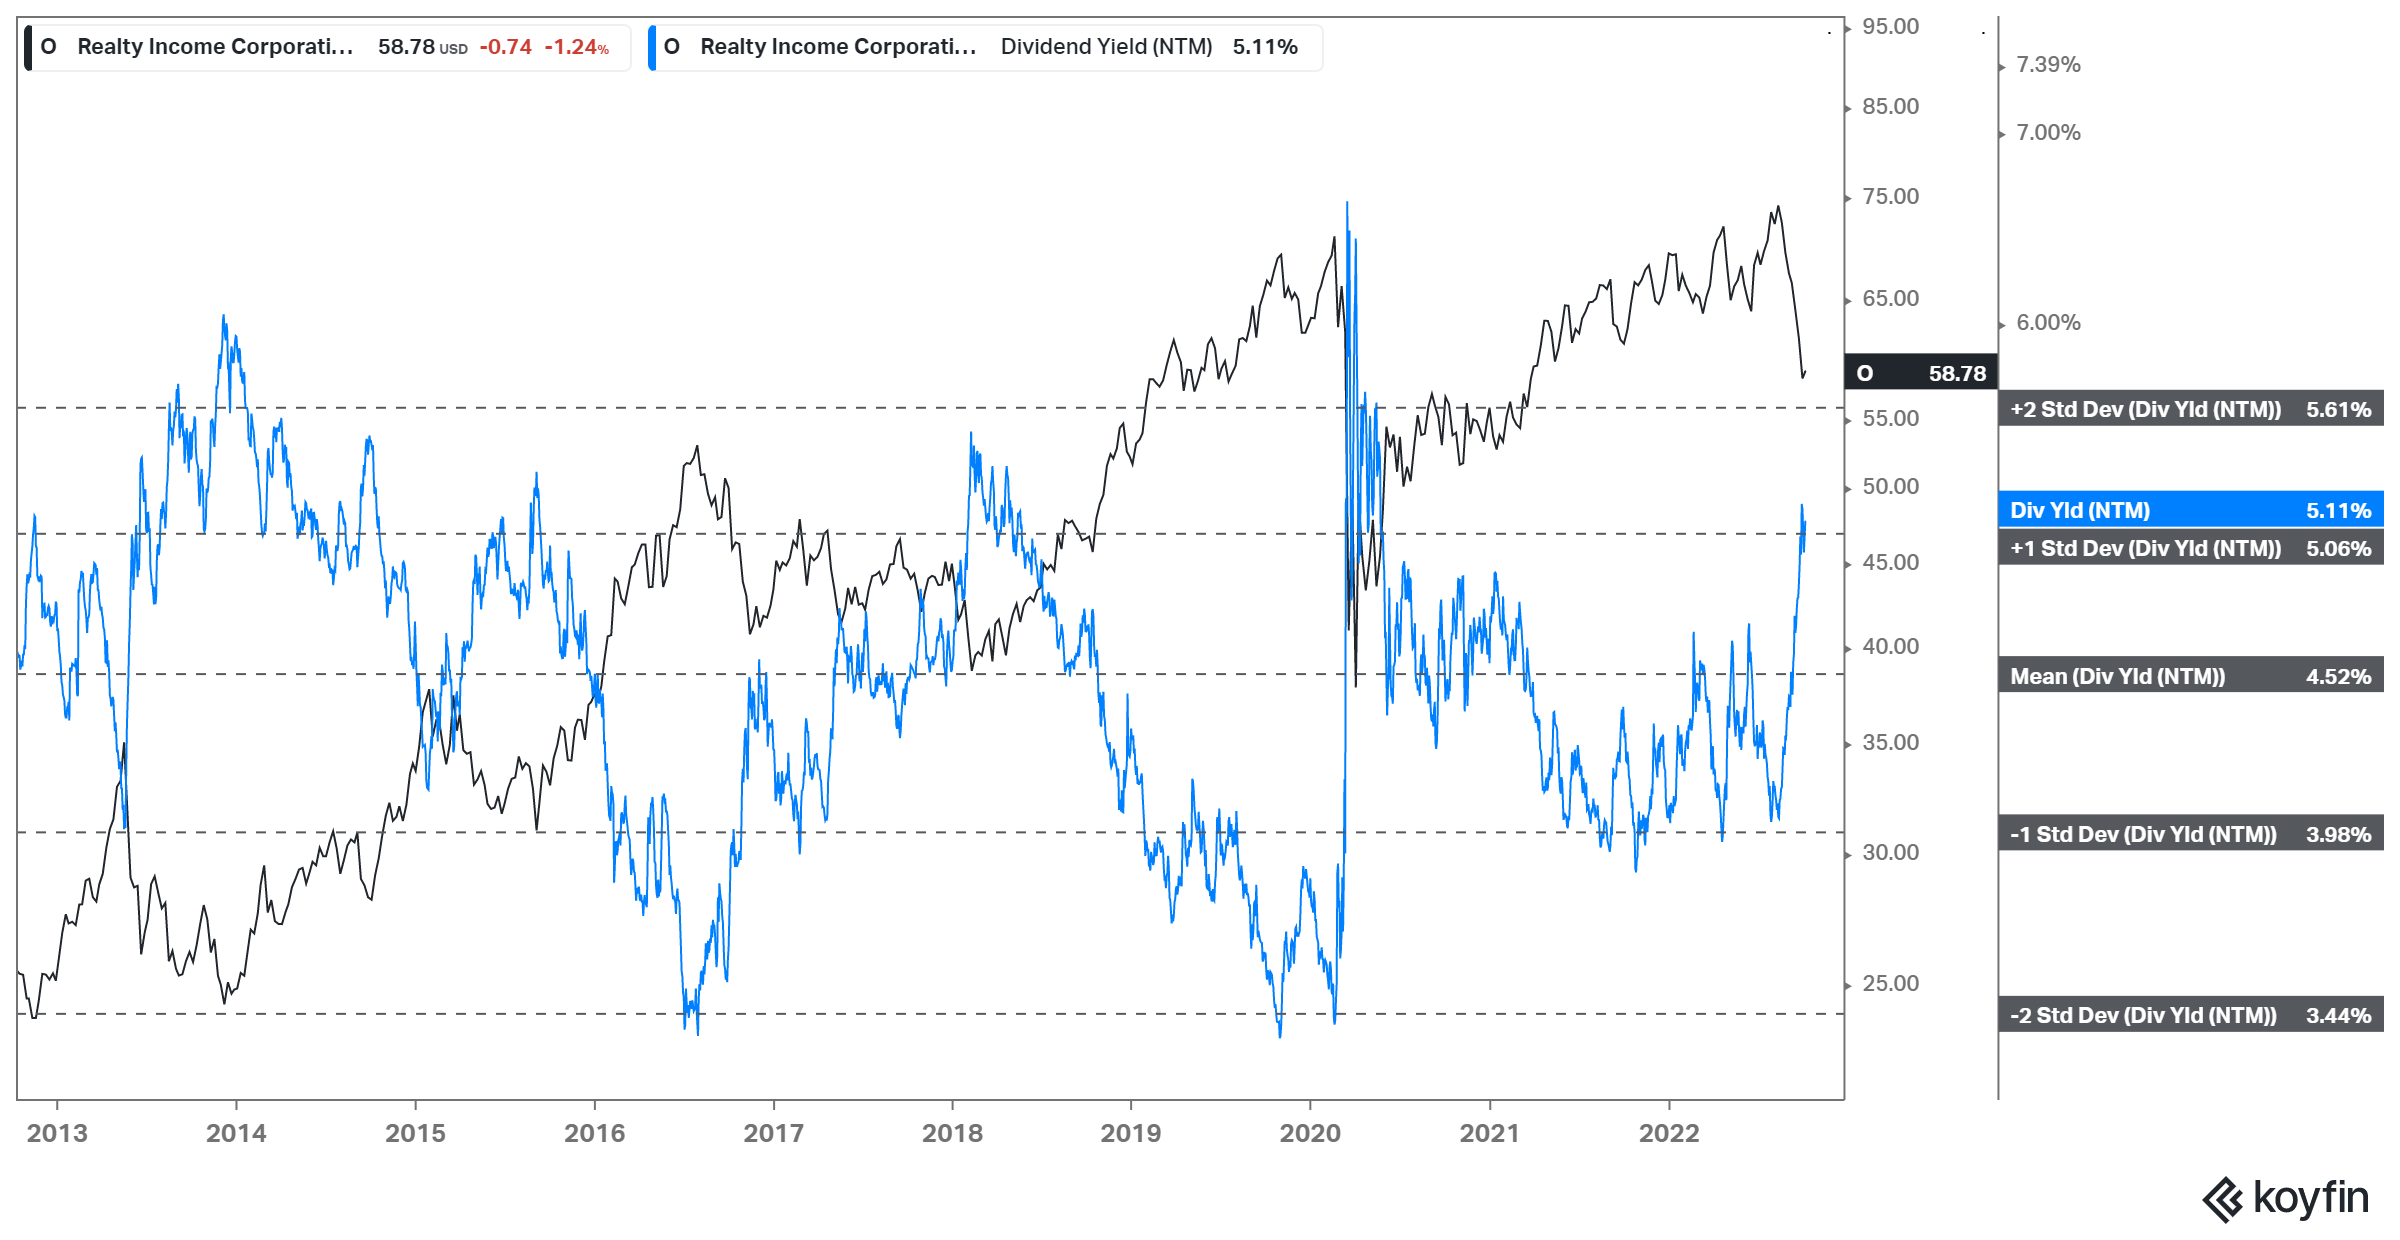
As a result of the recent battering, it sent O’s NTM dividend yields surging toward the one standard deviation zone over its 10Y mean. Therefore, we believe O’s near-term execution risks have been reflected accordingly.
As such, we believe it should help provide O robust valuation support at the current levels, offering investors who waited patiently less aggressive entry levels.
We revise our rating on O from Hold to Buy.
Be the first to comment