

AJ_Watt/E+ via Getty Images
Thesis
REIT stocks typically let investors eat the cake now because they pay out the dominant portion of their income as dividends. And you can see this clearly from the chart below.
As a sector, represented by the Vanguard Real Estate ETF (VNQ), it has delivered a total return of 16.3% in the past five years. And the return is almost all from dividends because the price has changed very little (-3.5% in the past five years). The picture is very similar for Realty Income (NYSE:NYSE:O). As seen, O has delivered a total return of 30.5% in the past five years, far better than the sector. But here, the return is again almost all from dividends because the price change is again very little (4.3% in the past five years). The picture for Simon Property (NYSE:NYSE:SPG) is a bit different due to its large valuation contraction (more on this later) and its negative total loss in the past 5 years. But the fact remains that most of its income was paid out in the form of dividends.
Source: Seeking Alpha data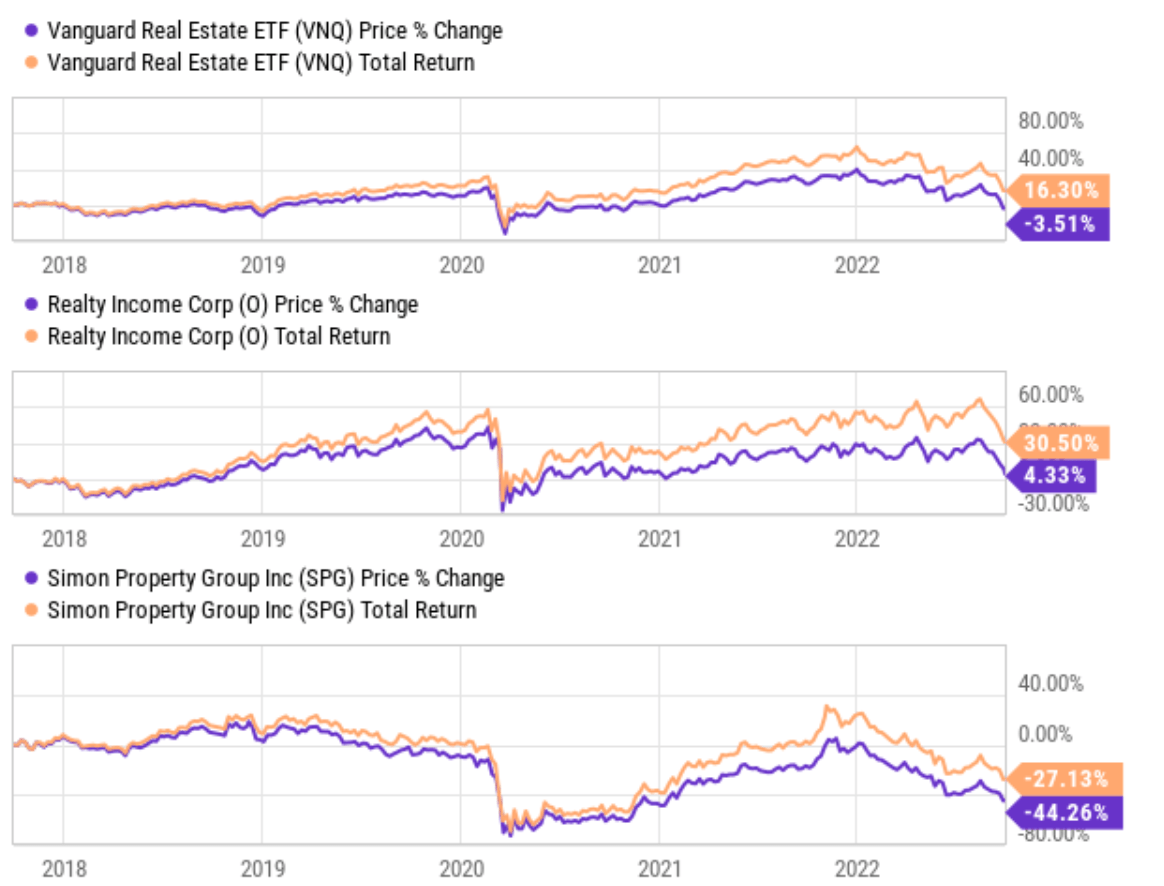
However, recent market corrections have created a situation where REIT investors can eat the cake now and also keep a good part of it at the same time. Both O and SPG provide generous current dividends, as seen from the chart below, especially in the case of SPG. SPG’s dividend of 7.52% is almost higher than O’s 5.07% by a half (48.3% to be exact). And to put things under historical perspective, the dividend yield for O has fluctuated in the past 10 years between 3.4% and 5.5% (with the outlier data points during the 2020 COVID panic excluded) with an average of 4.51%. Therefore, its current dividend yield is above its historical average by 12% and actually quite close to the peak level in a decade. Similarly, SPG’s dividend yield fluctuated in the past 10 years between 2.55% and 8.25% (again excluding the outlier data points during the 2020 COVID panic) with an average of 4.61%. Therefore, its current 7.52% dividend yield is above its historical average by a whopping 63% and also quite close to the peak level in a decade.
And next, you will see why I anticipate such already generous dividends to be only a fraction of their total return in the next few years.
Source: Seeking Alpha data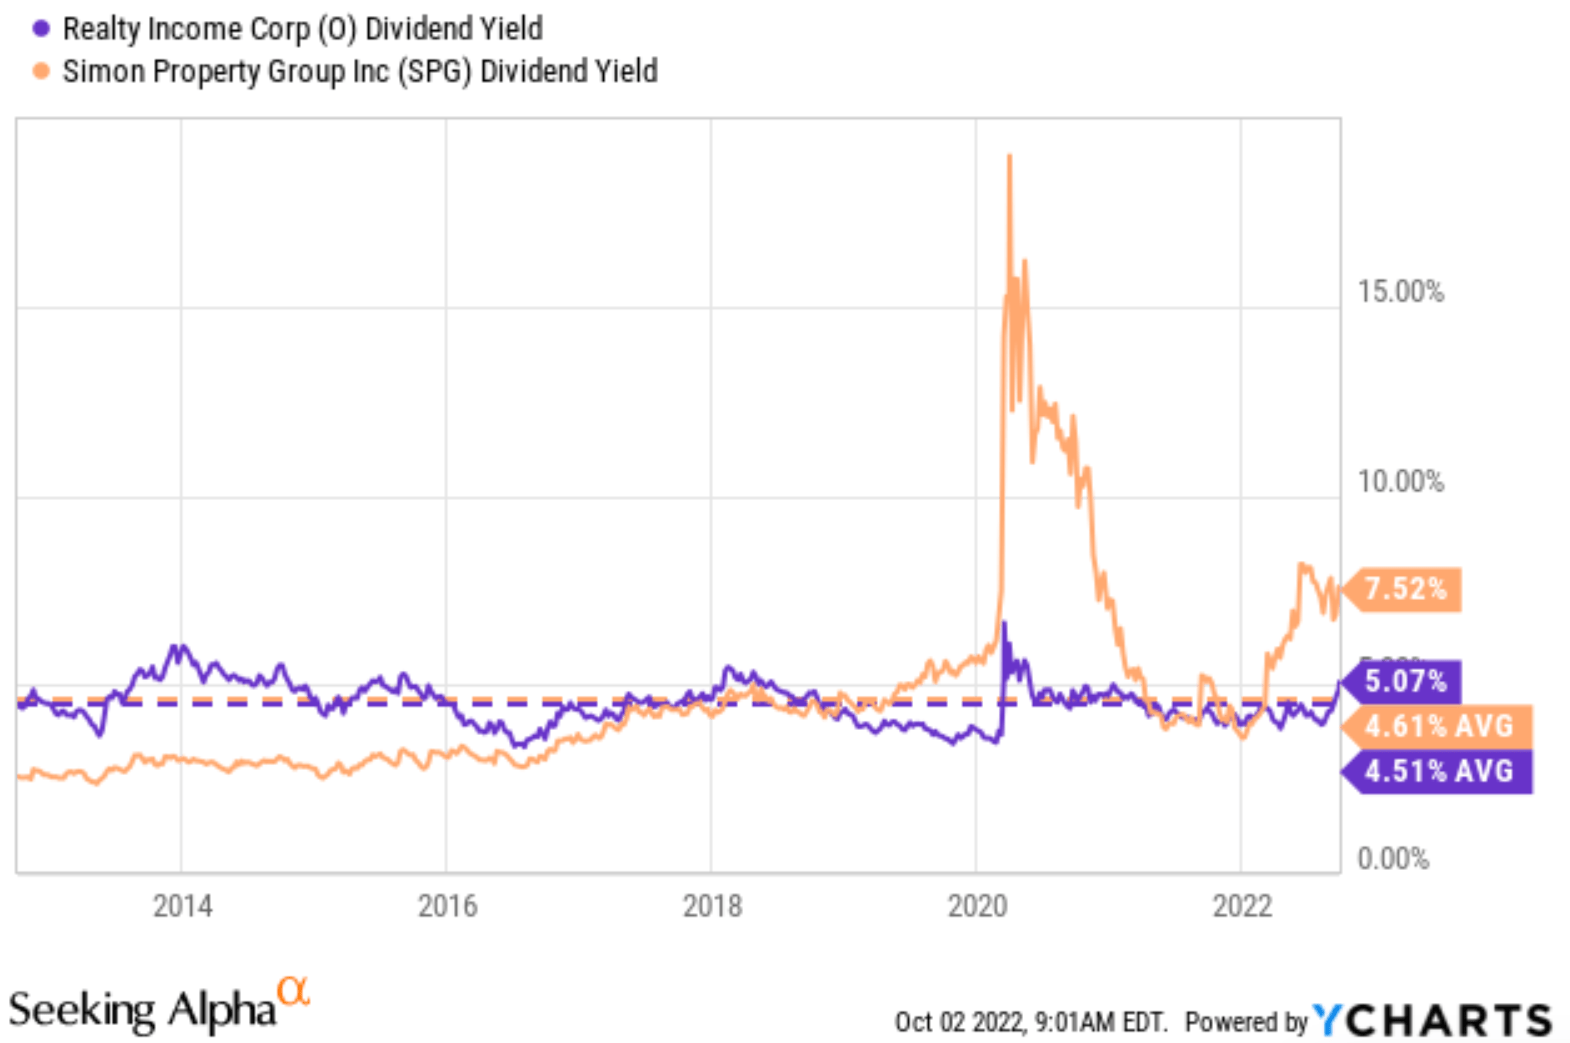
Total shareholder yield
Before we move on further, let’s take a look at the concept of total shareholder yield first. As detailed in my earlier writings,
For investors who do not need current income yet (like myself), I prefer to look at the total shareholder yield instead of the dividend yields as shown in the chart below. The chart compares the net common buyback yield from both SPG and O. For readers new to the concept, the buyback yield is the amount spent on repurchases divided by the market cap of a company (just like dividend yield is the total amount of dividends paid divided by the market cap).
As you may already know, REIT companies tend to dilute their shares over the years and therefore create a negative buyback yield, as can be seen from the chart below. O has been able to keep its buyback yield on average almost neutral over the years (on average 0.01% in the long-term). However, SPG’s buyback yield has been on average -4.42% in the past decade, effectively canceling off a good part of its cash dividends mentioned above.
With this understanding of the total shareholder yield, now let me explain the first reason why I think shareholders can benefit from the current situation in the next few years. Let’s assume both O and SPG are responsible capital allocators, which is a good assumption for me based on their historical track record. Then they tend to dilute their share counts less when the valuations are so depressed (like now) or even consider buying back some of the shares during such times if they have the means. Such moves may be painful in the short term because it further tightens their cash flow. However, in the long run, it would be very extremely beneficial for total shareholder yield because of the net buyback yields.
Source: Seeking Alpha data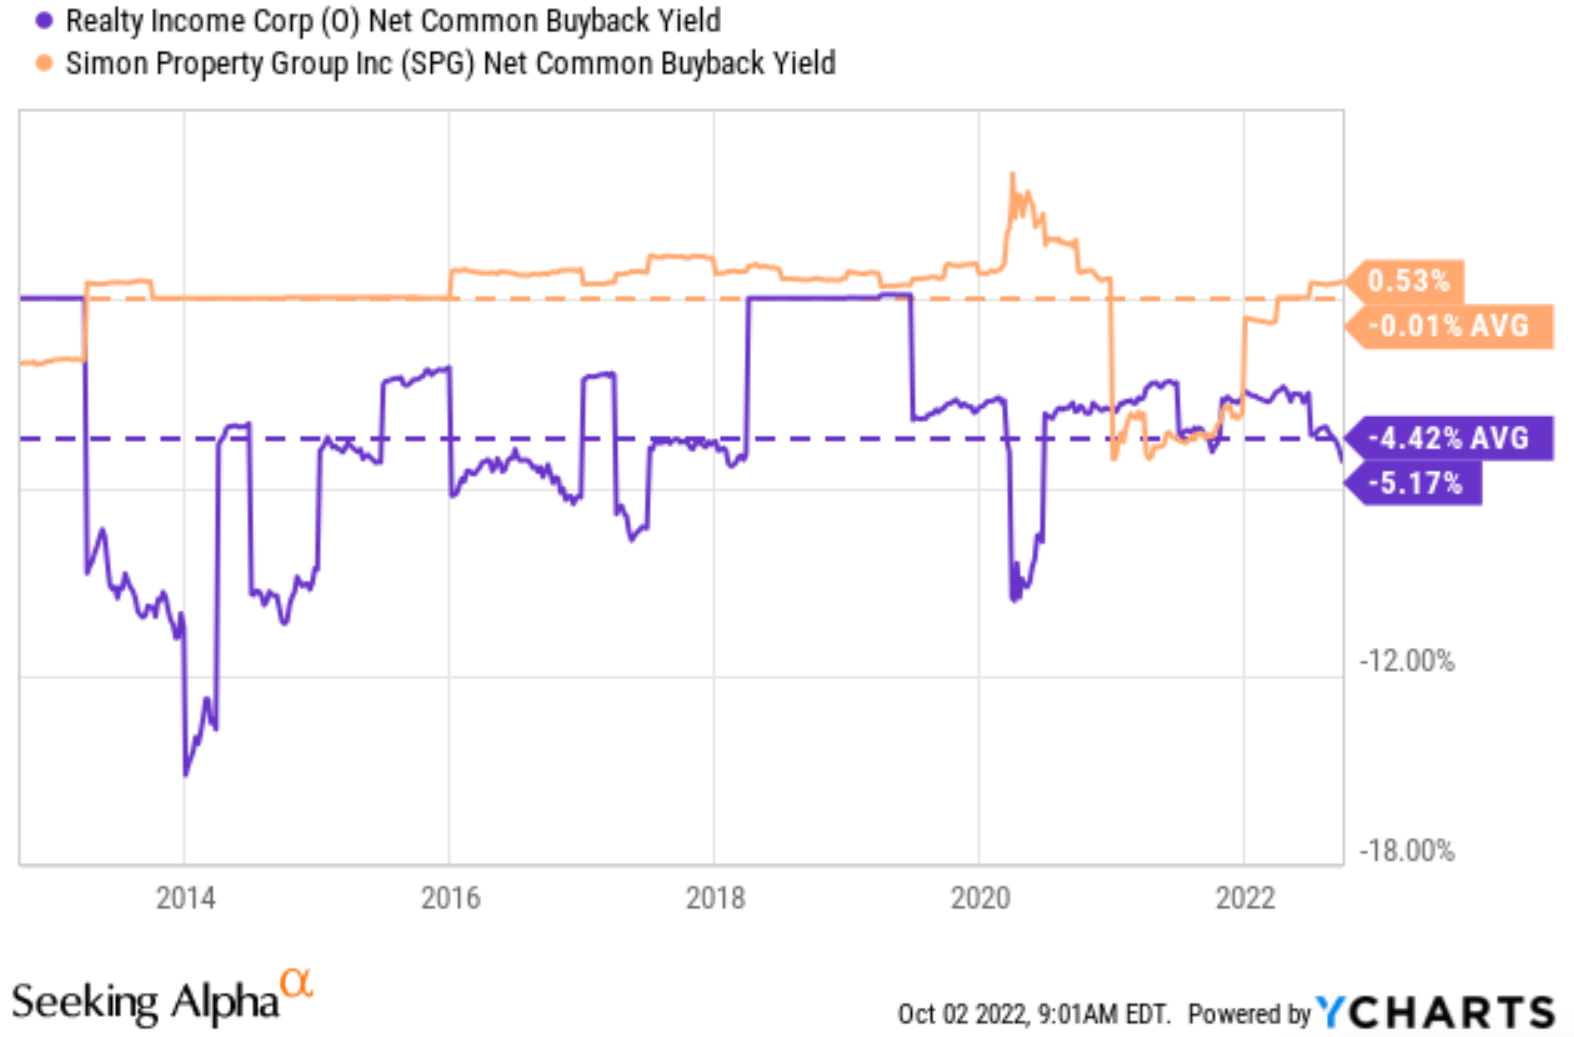
Dividends vs reinvestment
At the same time, bad times are also excellent opportunities for them to reinvest (again at the cost of short-term pain). And both of them have some bandwidth to do so as signaled by their payout ratios shown below.
Currently, the payout ratio for O is 82.3%. The payout ratio for O has been remarkably stable and only fluctuated in a narrow range between 79% and 87% with an average of 82%. Its current payout ratio, although a bit above the historical mean, is totally within the normal range of fluctuation. And indeed, the company is investing in its real estate portfolio actively and consistently. In the first half of 2022, O acquired 423 properties or sites under development for a combined $3.23 billion (compared to the same period a year ago during which it purchased 254 properties for an aggregate of $2.16 billion). It also just completed a sizable acquisition (of industry peer VEREIT) last year.
And the picture of SPG is quite similar as seen from the bottom panel of the chart. Currently, the payout ratio for SPG is only 44.6%. The payout ratio for SPG has been less stable and fluctuated in a wider range (between about 50% and 95%). And its average has been about 84% in the past decade. Its current payout ratio, therefore, is significantly below the historical mean and actually near the lowest point in a decade (despite the high dividend yield). SPG has also been actively reinvesting too. The company has a number of developments in the pipeline. For example, construction was ongoing on two new international projects. Fukaya-Hanazono Premium Outlets in Tokyo will open in the coming weeks (and SPG has a 40% stake in the property). Paris-Giverny Designer Outlet in Normandy is set to open in the first quarter of 2023, and Simon has a 74% interest in the project.
Source: Seeking Alpha data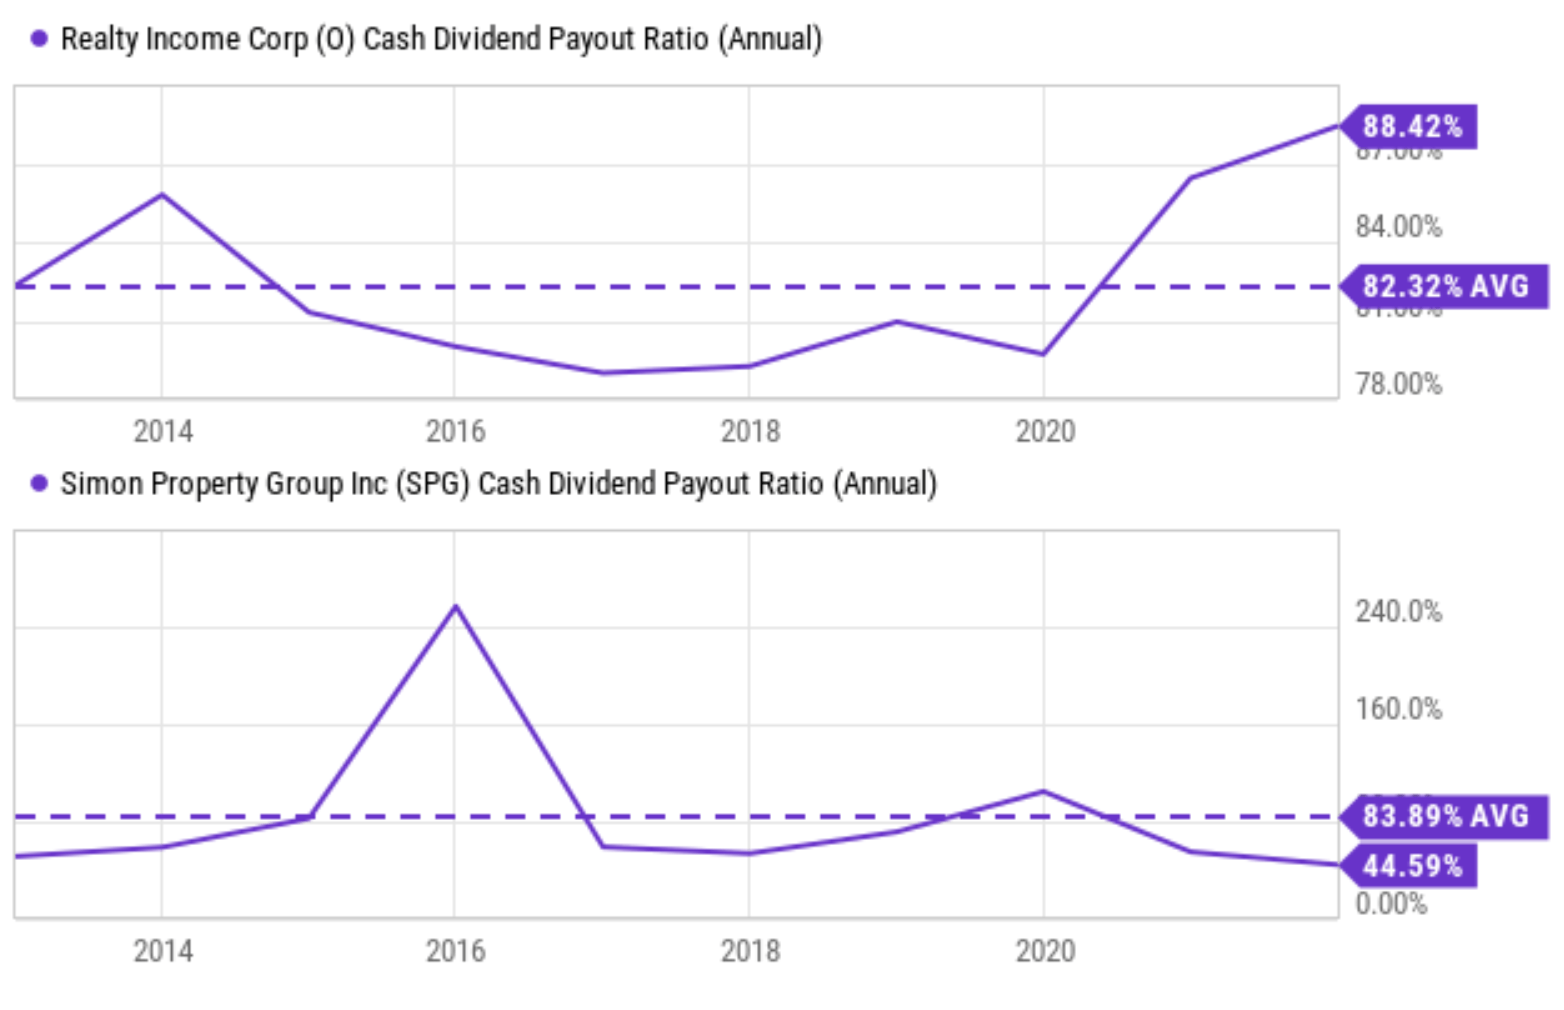
Business outlook and projected returns
On to valuations and projected returns. As the following table shows, SPG is currently heavily discounted. It is discounted by about 25% in terms of dividend yield compared to its historical averages in the past 4 years. Its present FWD P/AFFO ratio is only about 7.7x, almost discounted from its historical average by one-third.
With the above large valuation contraction, a healthy projected return can be expected when a moderate growth rate (say 4%) is assumed. For the next 3~5 years, the total return is projected to be in a range of 46% (the low-end projection) to about 75% (the high-end projection), translating into an annual return of 9.9%to 15.1%. And note here that the dividend yield of 7.52% only makes up about ½ of the total return potential in the bullish case.
Source: Author based on Seeking Alpha data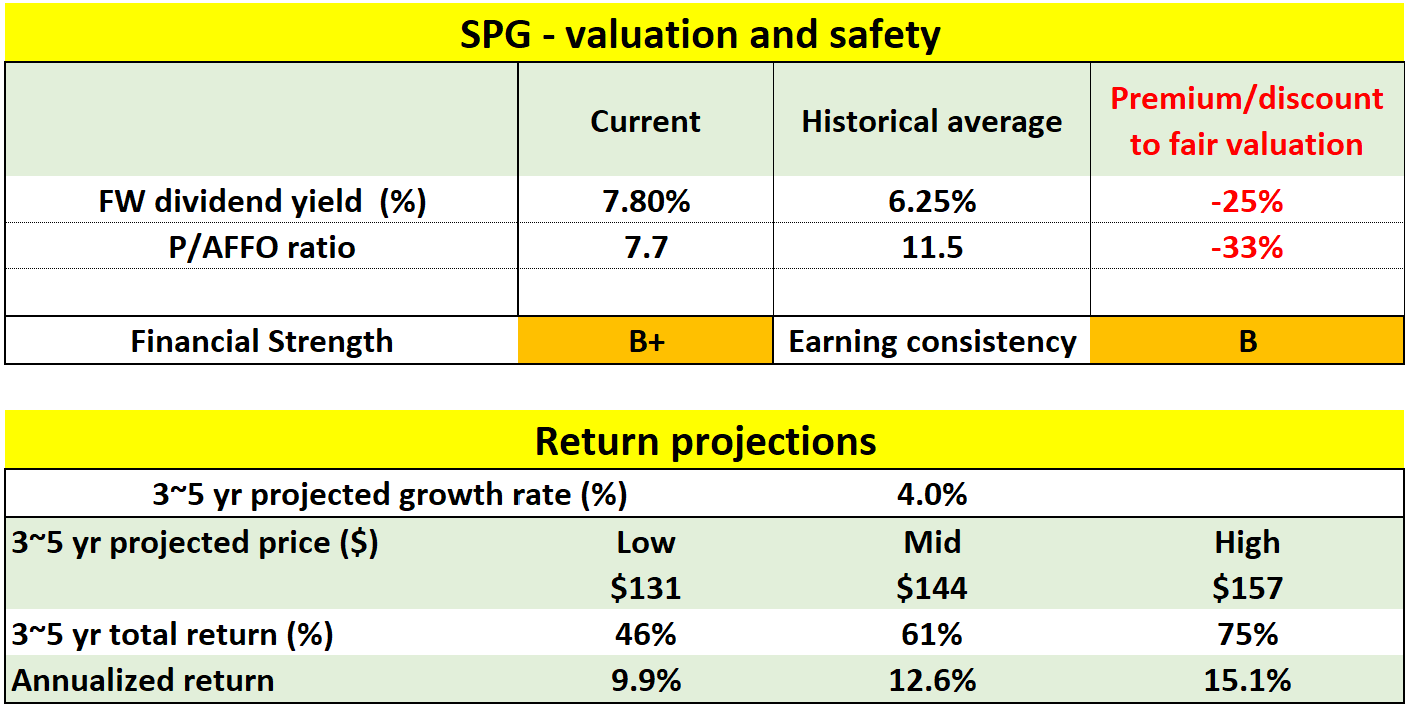
As the next table shows, O is less discounted than SPG. But the discount is still substantial, especially if you take its lower volatility into consideration (more on this later). It is discounted by about 14% in terms of dividend yield compared to its historical averages. Its present FW P/AFFO is about 14.9x, a 19% discount from its historical average of around 18.5x.
The compression of valuation again can lead to a solid return potential, even with a moderate growth rate of 4%. For the next 3~5 years, the total return is projected to be in a range of 33% (the low-end projection) to about 45% (the high-end projection), translating into an annual return of 7.4%to 9.7%. And again, its current dividend yields of 5.07% would only be a part of its total return potential (although a larger part compared to the case of SPG).
Source: Author based on Seeking Alpha data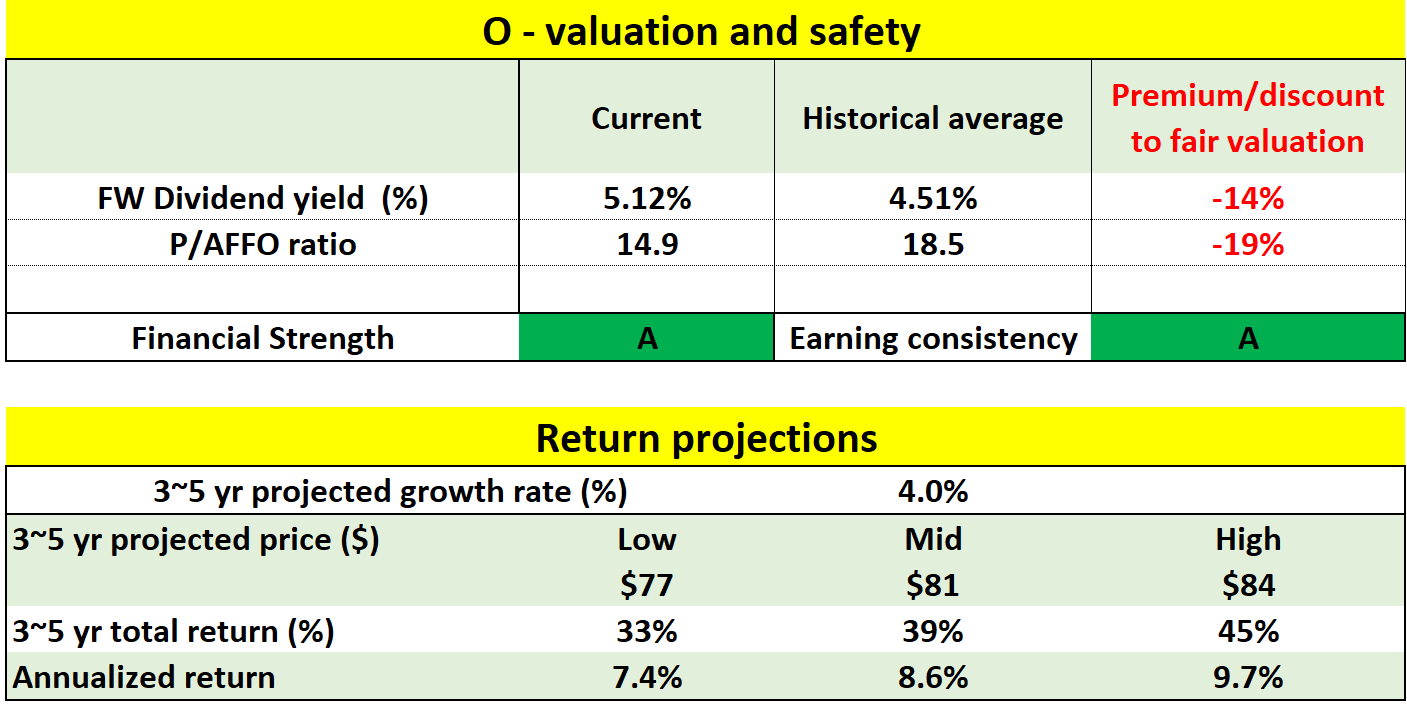
Final thoughts and risks
Both stocks face some risks. First, as aforementioned, SPG suffers more volatility risks than O. As seen in the chart above, SPG’s beta in the past 24 months has been substantially higher than the overall market and also than O. It is above the overall market by about 8% (with a beta of 1.08) and almost 2x high than O (whose beta is only 0.58). The volatility for SPG is even larger in the past 60 months (with a beta of 1.5). The elevated debt load of SPG also bears watching, as reflected in its overall financial B+ compared to O’s A rating. Both O and SPG also face some common macroeconomic risks. The COVID-19 pandemics, especially the possibilities of new variants, keep creating uncertainties for both of them. High inflation and the possibility of an overall recession will also keep pressuring their bottom line.
Source: Seeking Alpha data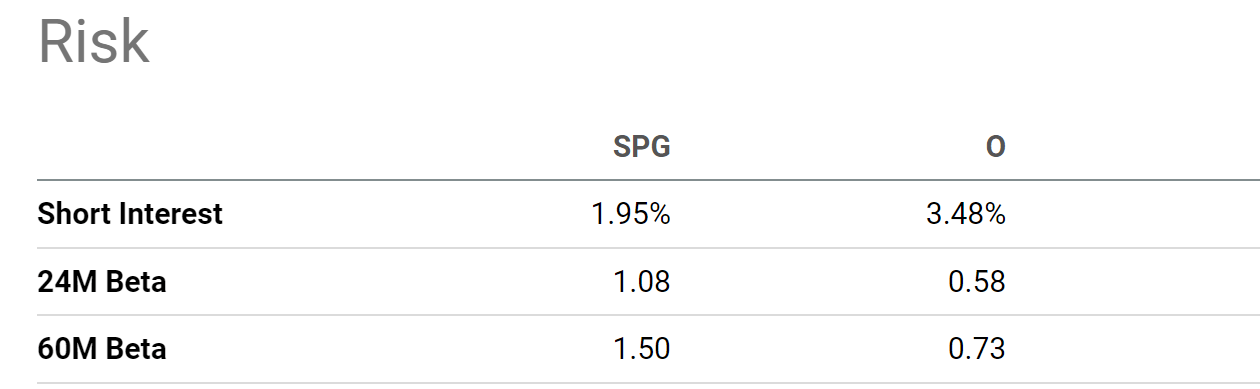
To conclude, recent selloffs have created an attractive situation for both SPG and O. They now provide BOTH generous current dividends (7.52% for SPG and 5.07% for O) AND healthy prospects for price appreciation. So, in a sense, investors can eat the cake now and also keep a good part of it. Their current dividend yields are expected to be only a fraction of their total return potential in the next 5 years. In contrast, their dividend yields have dominated the total return in the past 5 years. Furthermore, bad times are actually good for shrewd capital allocators like O and SPG. They are in a good position to dilute their share counts less or even buy back their shares in my opinion. And they are also in a good position to keep reinvesting. Both moves will create short-term pain but I think will be tremendously additive to total shareholder returns in the long term.
Be the first to comment