

Capuski/E+ via Getty Images
Foreword
This article is based on 100 Most Sustainable (M-S) companies based on Calvert Research and Management’s annual review of more than 230 ESG performance indicators, such as workplace diversity, data security, and greenhouse-gas emissions, as reported in the February 11, 2022 edition of Barron’s weekly.
How Barron’s determined their list
“To build Barron’s fifth annual ranking of the most sustainable companies, Calvert Research and Management started with the 1,000 largest publicly traded companies by market value, then ranked each by how it performed for five key constituencies: shareholders, employees, customers, community, and the planet.
Specifically, Calvert, a unit of Eaton Vance, which is owned by Morgan Stanley, looked at more than 230 ESG performance indicators, such as workplace diversity, data security, and greenhouse-gas emissions.
Based on these indicators, Calvert assigned a score of zero to 100 in each stakeholder category. Then it created a weighted average of the categories for each company, based on how financially material each category was for its industry peer group.
To make the list, a company had to be rated above the bottom quarter in each of the material stakeholder categories. If it performed poorly in any key category that was financially material, it was disqualified.
The top 100, ranked by sustainability, appear in the table at the bottom. Those were the best performers in 2021.”
– Barron’s editors
Any collection of stocks is more clearly understood when subjected to yield-based (dogcatcher) analysis. These 100 publicly traded Most Sustainable list (M-S) dogs are perfect for the dogcatcher process. Here is the April 13 data, focused on 78 dividend payers. The full list of 100 is posted in the Afterword at the tail of this article.
Happily, three of the 78 dividend-paying M-S companies live up to my Dogcatcher ideal of paying annual dividends from a $1K investment exceeding their single share prices. As of 3/14/22, they are Gap Inc (GPS), Regions Financial Corp (RF), and Levi Strauss & Co (LEVI). Many first-time investors regard this condition as a buy signal or, at least, a look-closer invitation.
Actionable Conclusions (1-10): Analysts Estimated 24.04% To 35.15% Net Gains For Ten Top M-S Companies To April 2023
Five of ten top 2022 M-S company stocks by yield were among the top ten gainers for the coming year based on analyst 1-year target prices. (They are tinted gray in the chart below). Thus, the yield-based forecast for these M-S top dogs was graded by Wall St. Wizards as 50% accurate.
Estimated dividends from $1000 invested in each of the highest-yielding stocks plus their aggregated one-year analyst median target prices, as reported by YCharts, supplied the data points. Note: target prices from less than two analysts were not counted. Thus, ten probable profit-generating trades projected to April 13, 2023 were:
Source: YCharts.com
YCharts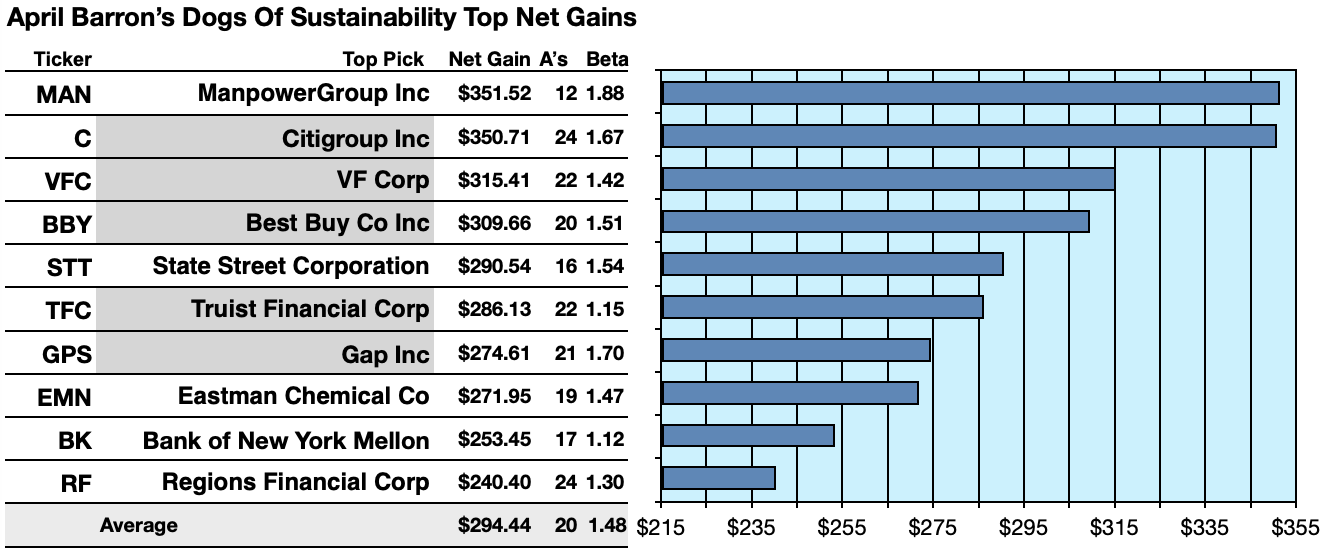
ManpowerGroup Inc (MAN) was projected to net $351.52, based on the median of target estimates from twenty-one analysts, plus dividends, less broker fees. The Beta number showed this estimate subject to risk/volatility 88% greater than the market as a whole.
Citigroup Inc (C) was projected to net $350.71, based on dividends, plus the median of target price estimates from twenty-four analysts, less broker fees. The Beta number showed this estimate subject to risk/volatility 67% greater than the market as a whole.
VF Corp (VFC) was projected to net $315.41, based on the median of target price estimates from twenty-two analysts, plus annual dividend, less broker fees. The Beta number showed this estimate subject to risk/volatility 42% greater than the market as a whole.
Best Buy Co Inc (BBY) was projected to net $309.66 based on dividends, plus the median of target estimates from twenty brokers, less transaction fees. The Beta number showed this estimate subject to risk/volatility 51% greater than the market as a whole.
State Street Corporation (STT) was projected to net $290.54, based on dividends, plus the median of target price estimates from sixteen analysts, less broker fees. The Beta number showed this estimate subject to risk/volatility 53% more than the market as a whole.
Truist Financial Corp (TFC) was projected to net $286.13, from dividends, plus the median of target price estimates from twenty-one analysts, less broker fees. The Beta number showed this estimate subject to risk/volatility 15% greater than the market as a whole.
Gap Inc was projected to net $274.61, based on dividends, plus the median of the target price estimates from twenty-one analysts, less broker fees. The Beta number showed this estimate subject to risk/volatility 70% greater than the market as a whole.
Eastman Chemical Co (EMN) was projected to net $271.95, based on dividends, plus the median of target price estimates from nineteen analysts, less broker fees. The Beta number showed this estimate subject to risk/volatility 47% over the market as a whole.
Bank of New York Mellon Corp (BK) was projected to net $253.45, based on the median of target prices from seventeen analysts, plus annual dividends, less broker fees. The Beta number showed this estimate subject to risk/volatility 12% over the market as a whole.
Regions Financial Corp was projected to net $240.40, based on a median of target price estimates from seventeen analysts, plus dividends, less broker fees. The Beta number showed this estimate subject to risk/volatility 30% greater than the market as a whole.
The average net gain in dividend and price was estimated at 29.44% on $10k invested as $1k in each of these ten stocks. These gain estimates were subject to average risk/volatility 48% greater than the market as a whole.
Source: Open source dog art #1 from dividenddogcatcher.com
Open-source dog art from dividneddogcatcher.com
The Dividend Dogs Rule
Stocks earned the “dog” moniker by exhibiting three traits: (1) paying reliable, repeating dividends, (2) their prices fell to where (3) yield (dividend/price) grew higher than their peers. Thus, the highest yielding stocks in any collection became known as “dogs.” More precisely, these are, in fact, best called, “underdogs”.
50 Barron’s M-S Dogs Showed April Target Gains
Source: YCharts.com
YCharts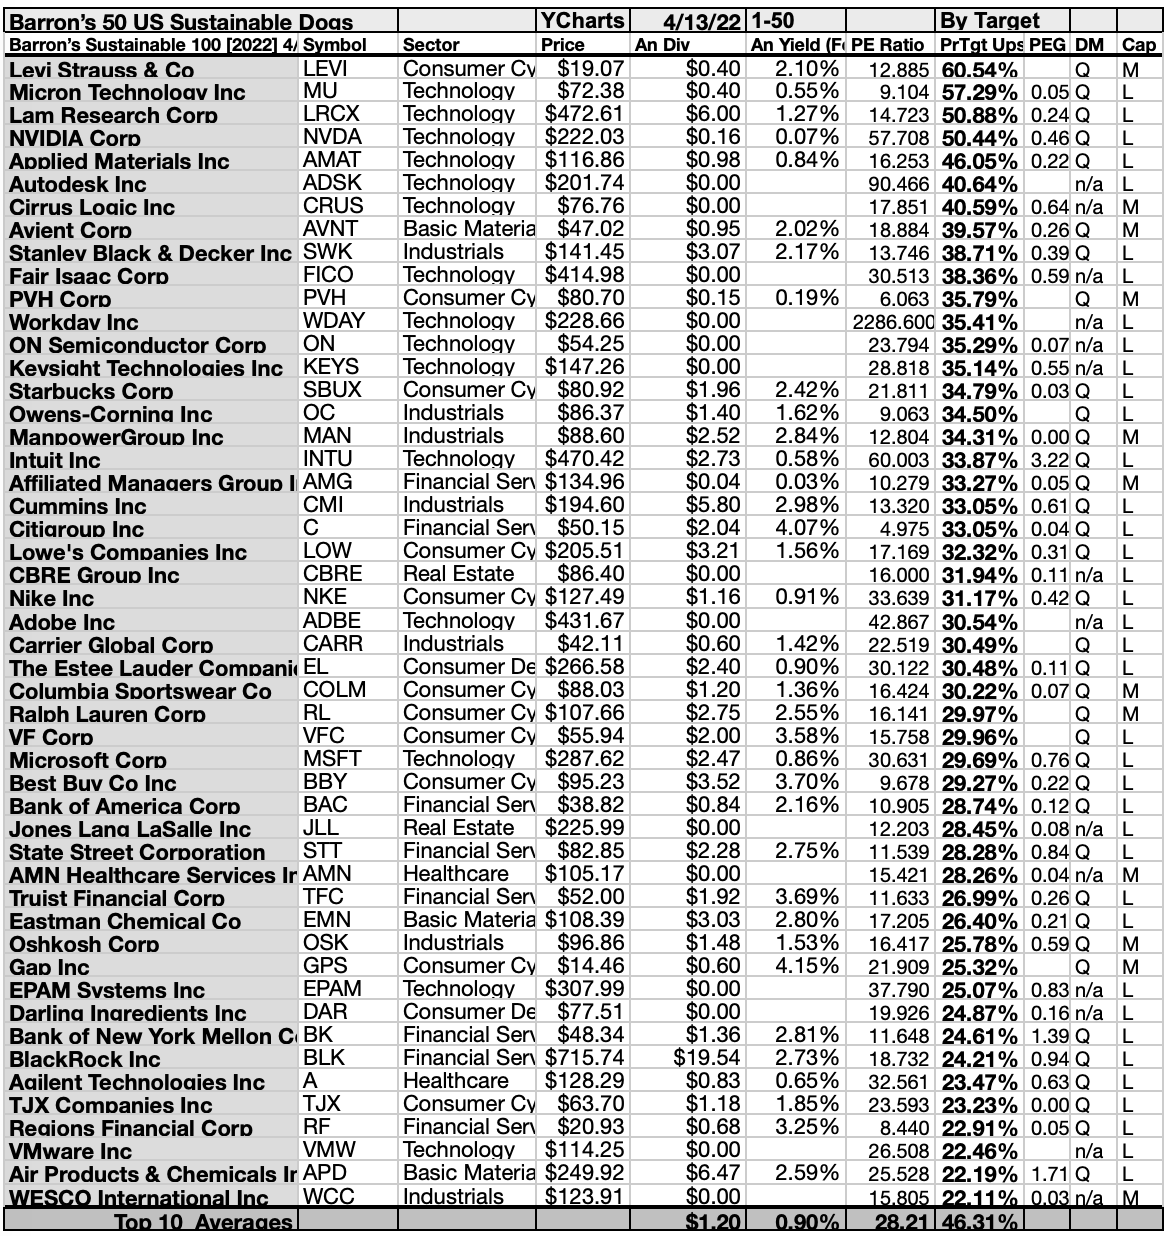
50 Barron’s M-S Dogs Reveal April Yields
Source: YCharts.com
YCharts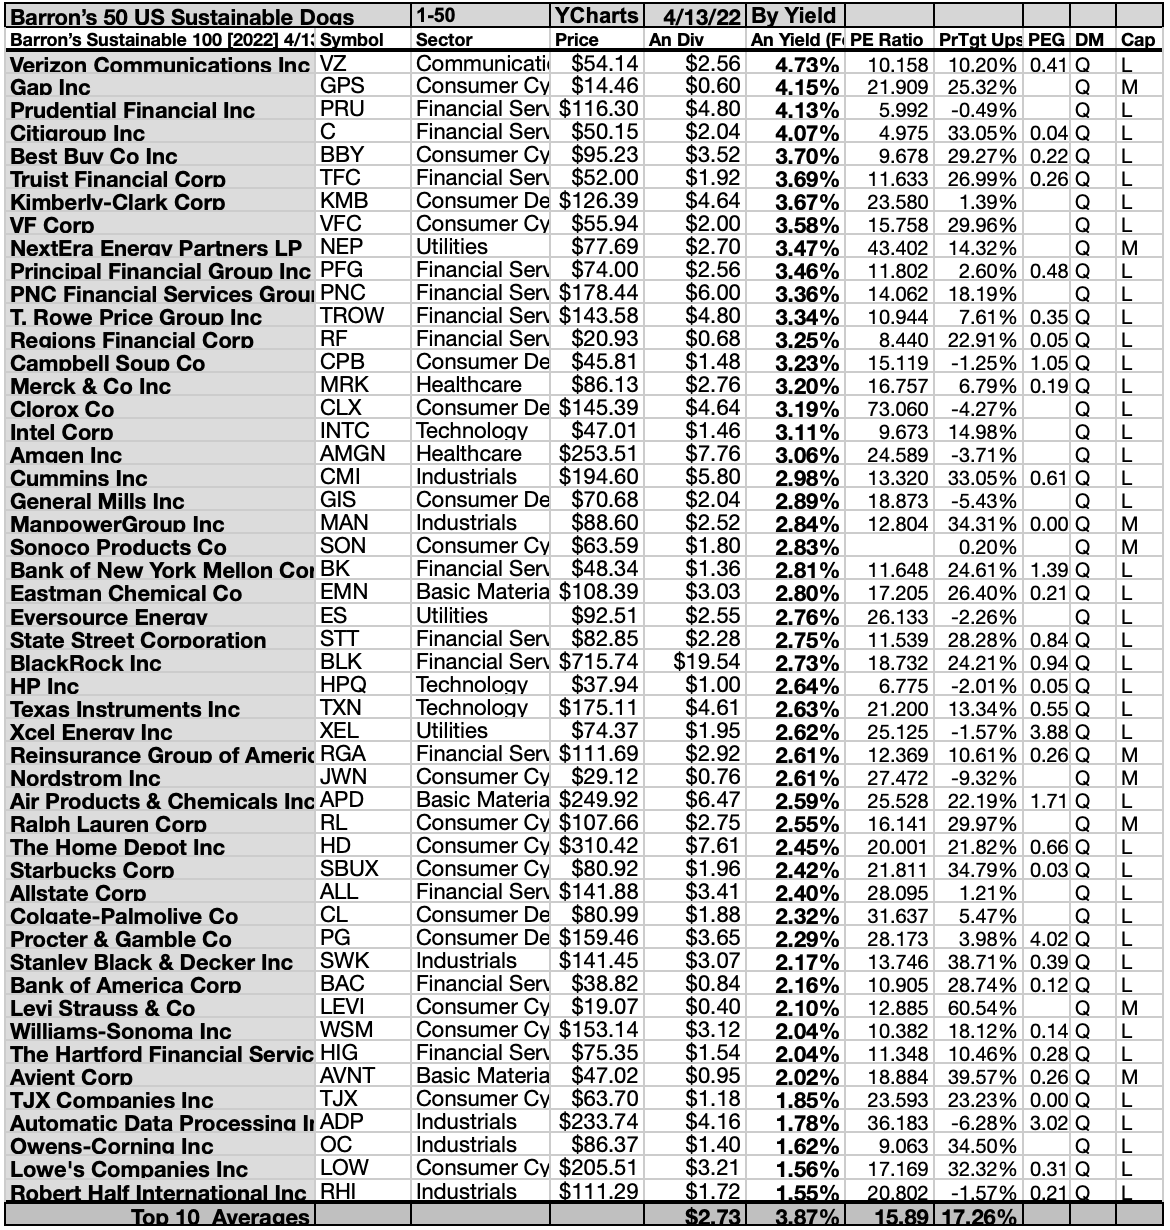
Actionable Conclusions (11-20): 10 Top Barron’s M-S Dogs By Yield For April
Top yield ten April 2022 Barron’s M-S stocks represented five of eleven Morningstar sectors.
A single communication services representative placed first, Verizon Communications Inc (VZ) [1]
Three consumer cyclical representatives placed second, fifth, and eighth: Gap Inc [2], Best Buy Co Inc [5], and VF Corp [8].
The first of three financial services stocks occupied third place: Prudential Financial Inc (PRU) [3]. The other two financial firms placed fourth and tenth, Citigroup In [4], and Principal Financial Group Inc (PFG) [10].
Then the lone consumer defensive stock occupied seventh place, Kimberly-Clark Corp (KMB) [7].
Finally, one utilities firm placed ninth, Next Era Energy Partners LP (NEP) [10], to complete the top ten April 2022 Barron’s Most Sustainable company stocks by yield.
Actionable Conclusions: (21-30) Top Ten Barron’s M-S Dividend Dogs Showed 24.53%-34.31% Upsides While (31) Seven Lowly Down-siders Slumped -0.52%-5.49% For This April Report
Source: YCharts.com
YCharts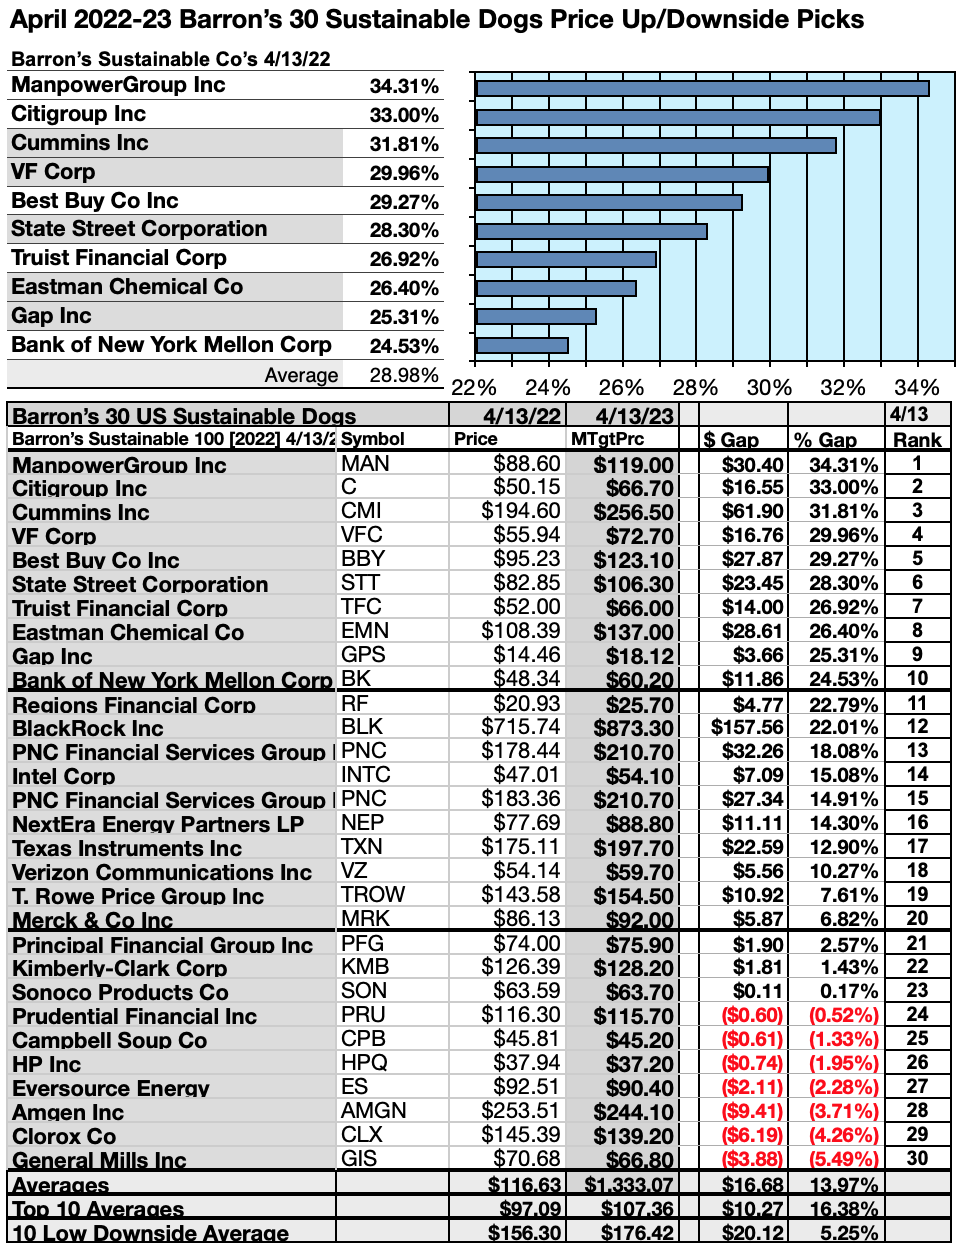
To quantify top dog rankings, analyst median price target estimates provided a “market sentiment” gauge of upside potential. Added to the simple high-yield metrics, analyst median target price estimates became another tool to dig out bargains.
Analysts Forecast A 41.96% Advantage For The 5 Highest Yield, Lowest Priced Of Ten 2022 Barron’s M-S Dividend Stocks Come April, 2023
Yield (dividend / price) results provided by YCharts did the ranking for these ten dividend April Barron’s M-S stocks.
Source: YCharts.com
YCharts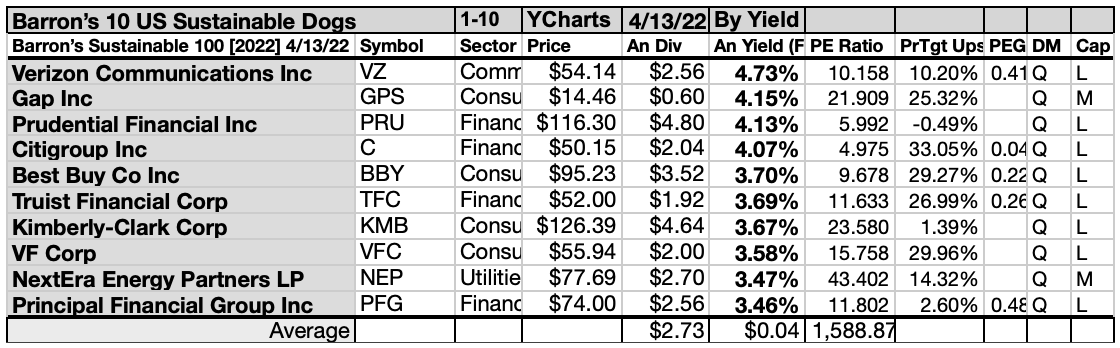
As noted above, top ten dividend Barron’s M-S dogs screened 4/13/22 showing the highest dividend yields represented five of eleven in the Morningstar sector scheme.
Actionable Conclusions: Analysts Predicted 5 Lowest-Priced Of The Top Ten Highest-Yield Barron’s M-S Dividend Dogs (32) Delivering 27.14% Vs. (33) 19.12% Net Gains by All Ten Come April 13, 2023
Source: YCharts.com
YCharts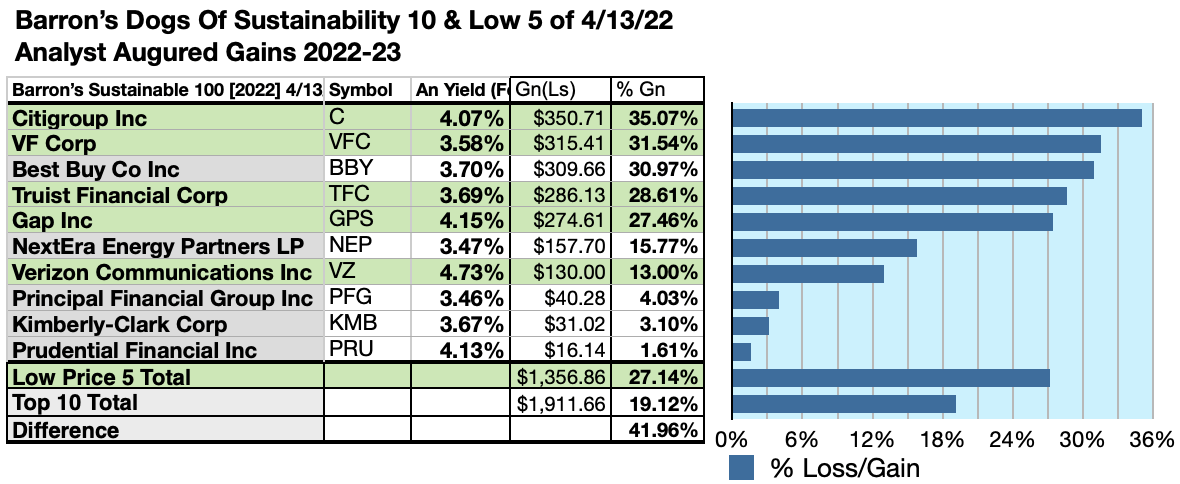
$5000 invested as $1k in each of the five lowest-priced stocks in the top ten dividend Barron’s M-S kennel by yield were predicted by analyst 1-year targets to deliver 41.96% more gain than $5,000 invested as $.5K in all ten. The second lowest-priced selection, Citigroup Inc, was projected to deliver the best net gain of 35.07%
Source: YCharts.com
YCharts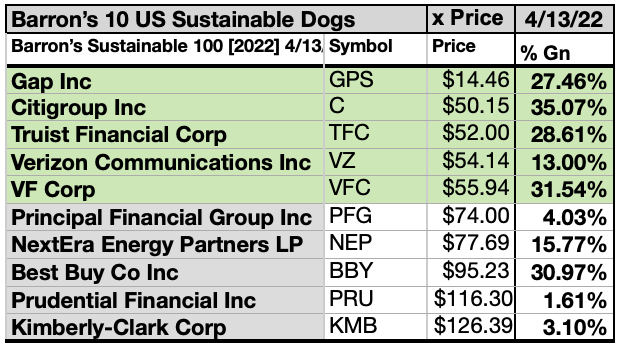
The five lowest-priced top-yield Barron’s M-S dividend dogs as of April 13 were: Gap Inc; Citigroup Inc; Truist Financial Corp; Verizon Communications Inc; VF Corp, with prices ranging from $14.46 to $55.94.
Five higher-priced Barron’s M-S dividend dogs as of March 14 were: Principal Financial Group Inc; NextEra Energy Partners LP; Best Buy Co Inc; Prudential Financial Inc; Kimberly-Clark Corp, whose prices ranged from $74.00 to $126.39.
The distinction between five low-priced dividend dogs and the general field of ten reflected Michael B. O’Higgins’ “basic method” for beating the Dow. The scale of projected gains based on analyst targets added a unique element of “market sentiment” gauging upside potential. It provided a here-and-now equivalent of waiting a year to find out what might happen in the market. Caution is advised, since analysts are historically only 20% to 90% accurate on the direction of change and just 0% to 15% accurate on the degree of change.
The net gain/loss estimates above did not factor in any foreign or domestic tax problems resulting from distributions. Consult your tax advisor regarding the source and consequences of “dividends” from any investment.
Afterword
If somehow you missed the suggestion of the three stocks primed to buy at the start of the article, here is a repeat of the list at the end.
YCharts.com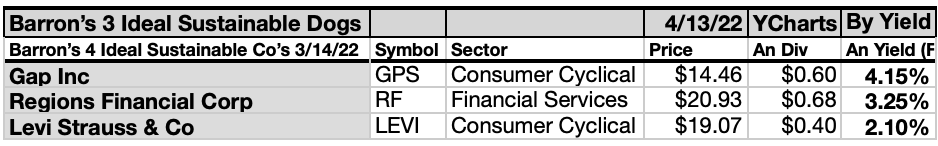
Happily, three of the 78 dividend-paying M-S companies live up to my Dogcatcher ideal of paying annual dividends from a $1K investment exceeding their single share prices. As of 4/13/22, they are Gap Inc, Region’s Financial Corp, and Levi Strauss & Co. Many first-time investors regard this condition as a buy signal or, at least, a look-closer invitation.
Current vs Fair Price Charts
However, only one of the top-ten Barron’s M-S shares is priced less than the annual dividends paid out from a $1K investment. Therefore, the following charts compare that one with all ten at current prices (top chart) with the fair pricing of all ten top dogs conforming to that ideal (middle chart). The dollar and percentage differences between current and fair prices are detailed in the bottom chart.
Source: YCharts.com
YCharts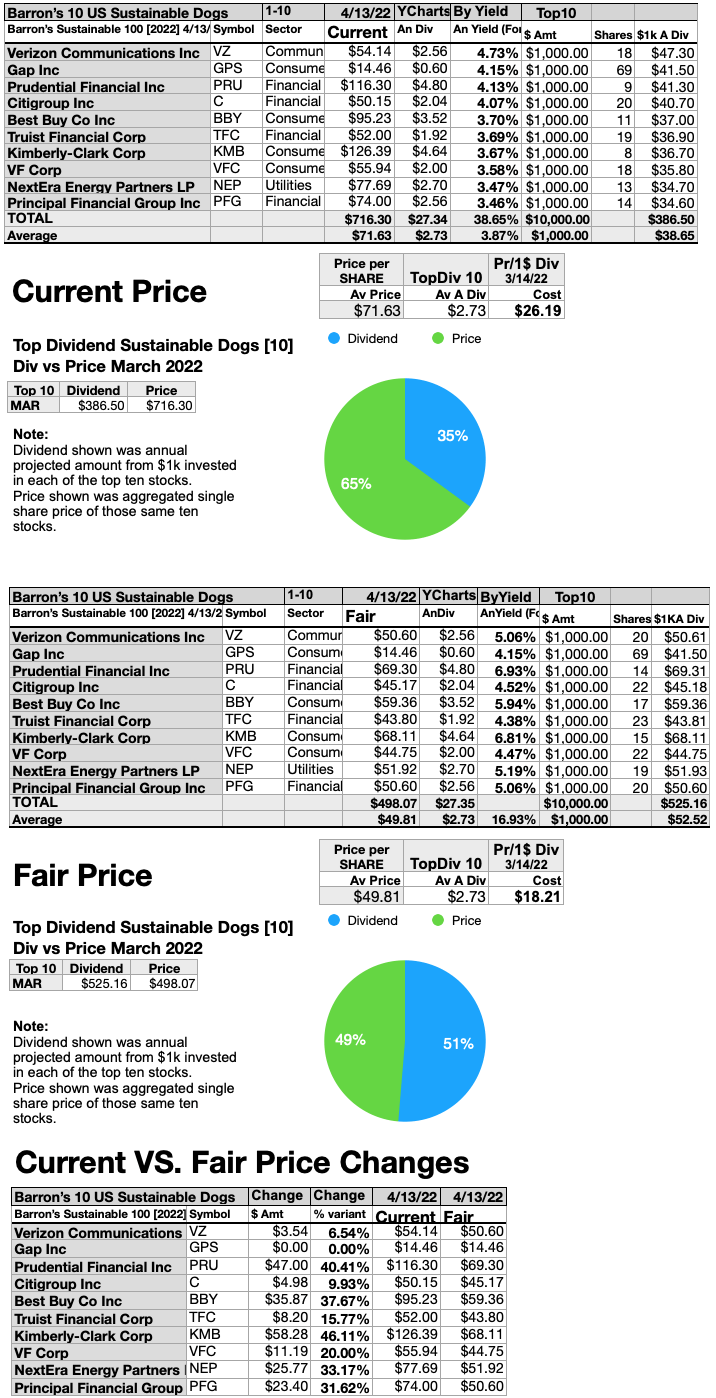
Barron’s Most Sustainable Companies As Ranked For 2022
Source: Barron’s.com
Barrons.com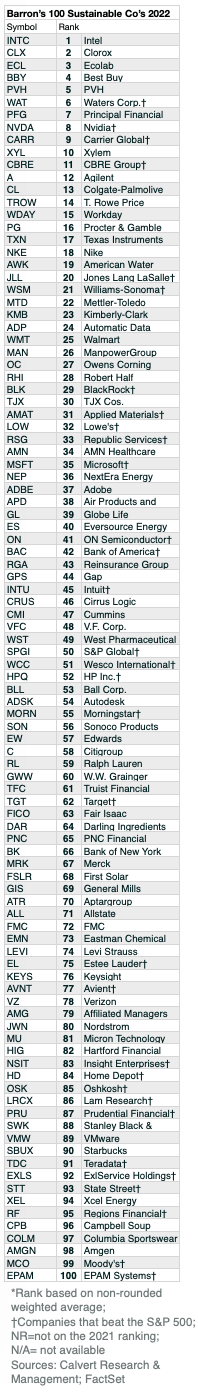
Stocks listed above were suggested only as possible reference points for your Fortune World’s Most Admired stock purchase or sale research process. These were not recommendations.
Be the first to comment