


Elena Perova
It’s a rather funny picture, but it’s the state of the world today. Incomes are simply not keeping up with the rate of inflation and we’ve all been getting sticker shocks on all fronts over the past 1.5 years now.
There has been too much emphasis I believe, on the inflation rate alone and not near enough emphasis on what really matters and that is the difference between inflation and the rate of rise in your weekly paycheck.
Normally, your weekly earnings rise faster than inflation. This is generally due to gains in productivity or aggregate input cost reduction.
Here is a chart showing the rate of change in average weekly earnings minus the rate of inflation going back to 2007:
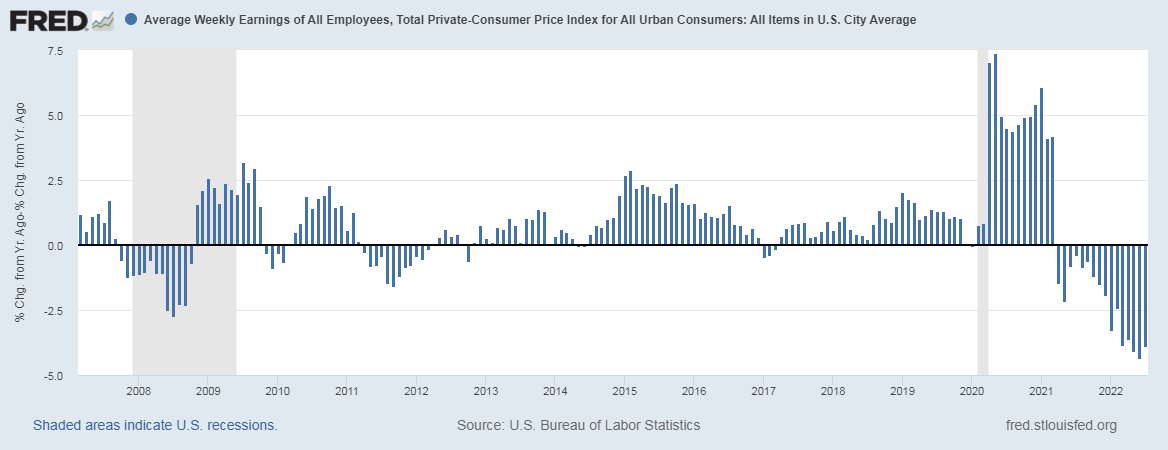
Weekly Earnings – Inflation (St. Louis Fed FRED)
We’re now running on 16 months of negative real weekly earnings. The month of July, the difference between inflation and weekly earnings was -3.87%.
To keep the same level of consumption vs. the previous year, one would have to either dip into savings or go into debt. The other option is to simply forgo the same level of consumption which is the most likely and is the best reason as to why we have now had 2 quarters of negative real GDP growth and will likely continue to have negative real GDP growth in the quarters ahead.
The Fed Raising Rates
I hold the view that the entire point of the Fed raising or lowering rates is to either entice more borrowing to get monetary inflation up or to stifle borrowing to lower the rate of monetary inflation. Of course shooting for their target of 2% inflation.
When you get a raise at work, where do you suppose the money came from to pay for it? Same goes for when same-store sales rise and profits rise. The money that paid for it was the increase in aggregate debt per capita.
This image below showing the rate of change in aggregate debt per capita and wage and salary disbursements gives some justice to this idea.
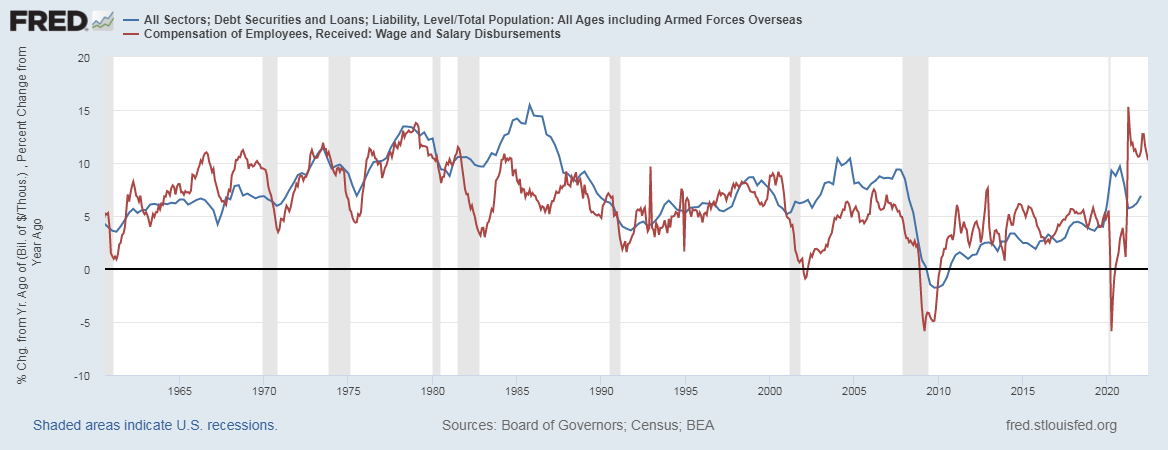
Aggregate Debt Vs Wage And Salary (St. Louis Fed FRED)
There was a large increase in the rate of debt growth per capita in the 1980s and again in the 2000s. This can simply be explained from excessive investment capital. The 1980s it was leveraged buyouts, think junk bonds. Then in the 2000s, it was the real estate bubble, think Mortgage Backed Securities. Otherwise, there is a good relationship between the rate of debt growth to the rate of which wage and salary disbursements are made.
I’m making this point to suggest that one of the more blatant consequences of the Fed tightening and raising rates today will be a slower rate of wage and salary disbursements resulting in both lower wage gains as well as perhaps layoffs or a reduction in the labor force.
Monetary policy can be looked at as to what helps pay for wage gains, rising sales and rising profits.
Inflation And Its Deflationary And Inflationary Forces
With all due respect for Milton Friedman, his quote about inflation being a monetary phenomenon is only half right in my opinion. I got my start in my career in manufacturing and got a very good lesson about both the cost sheet and the concepts of productivity and efficiency. We were expected to always be able to reduce the cost of our product 1% – 2% per year by our customers simply by improving the cost sheet by 4% – 6% per year. With a mix of technology improvements like new machines and or software, new improved methods of operation and new sources of materials and labor from cheaper labor off-shore, we could meet those goals of reducing the cost to produce the product we were producing. All in all, these methods were deflationary forces contributing to growing the economy and improving living standards. This business eventually went bankrupt due to not being able to compete with China as their labor costs were substantially lower and it was impossible to compete. China now making the product the company I once worked for made was also a deflationary force.
To understand inflation, we have to start with the monetary component which is the rate of aggregate debt growth per capita. The chart below compares that to the rate of inflation:
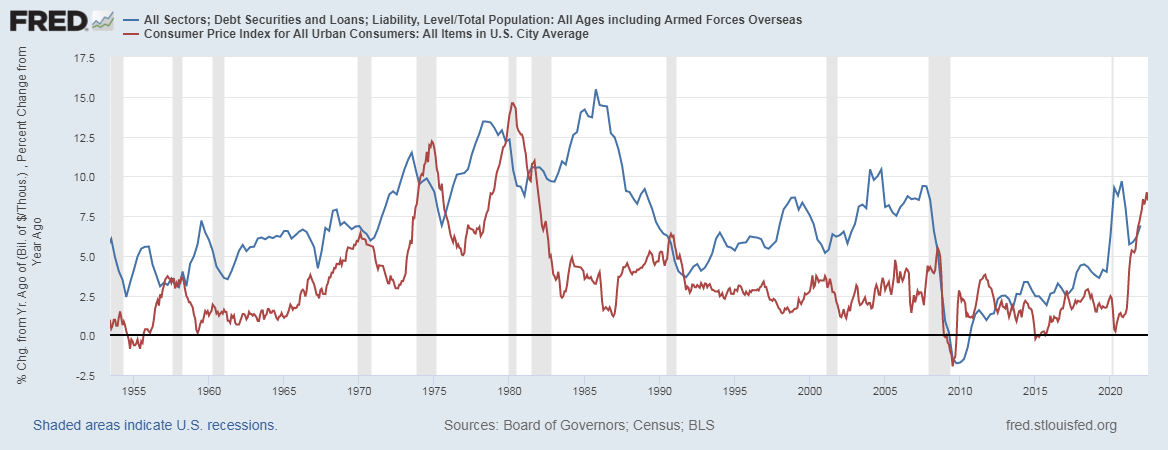
Debt Growth Vs CPI (St. Louis Fed FRED)
The inflation rate is almost always lower than the debt growth per capita or Milton Friedman’s monetary phenomenon. This is because there are what I call deflationary forces that result in reducing costs by improving productivity. One such example are those industrial engineers in manufacturing improving methods and such as one such deflationary force.
If I were to add the rate of productivity or output per hour, to the rate of inflation, the end result will be far closer to the rate of debt growth per capita.
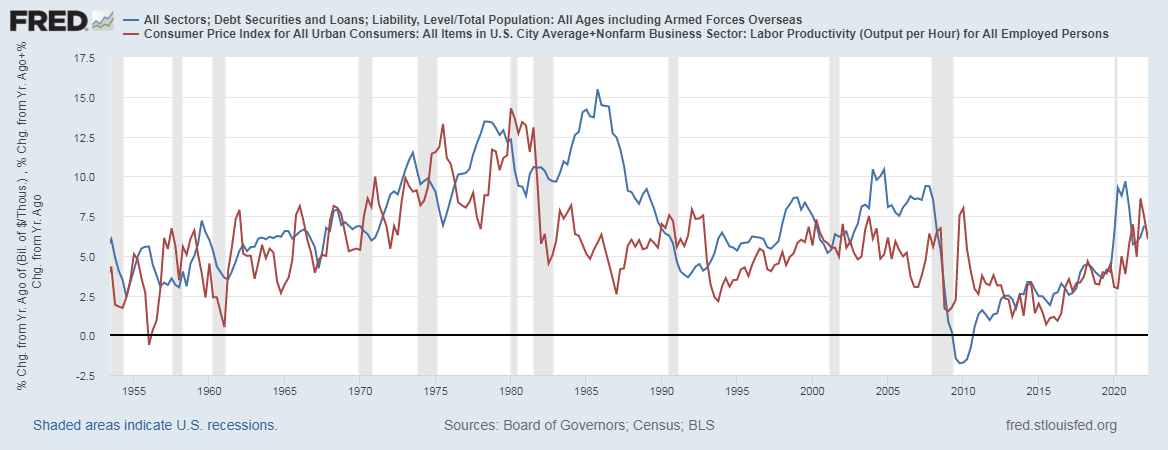
Debt Growth Vs CPI + Productivity (St. Louis Fed FRED)
Again, the exception is the 1980s and again the 2000s. Both have a good reason for this and that is a substantial deflationary force allowing great amounts of new debt to be issued and not be inflationary. In the 1980s, it would be a combination of a very strong dollar coupled with free-market supply side economic policy that helped reduce overall inflation.
In the 2000s, another substantial deflationary force came to play and that was China. China entering the World Trade Organization in 2001 opened the floodgates to lower priced imports decimating US manufacturing for the long term but providing a great deflationary force for the near term giving us a real estate bubble boom that ultimately blew up in 2008. Everything from clothing to new cars got a jolt of deflation.
Productivity or output per hour is a very aggregate figure. It’s a combination of all input costs. This is where if one were to lay out the entire cost sheet to make anything or provide a service for anything, one would recognize all the various costs that go into it.
It comes down to 3 components: Time, Capital and Energy (BTU or Kilowatt Hours).
The premise of investment is to improve productivity, first to invest in someone’s time to figure out the best method of doing something to get proper outcome and then make the necessary capital investments into making it happen. For example, 11 years ago, I bought a riding lawn mower after calculating the amount of hours I would save (about 20 hours a year) Vs using my push mower. I then happily put out the $1700 to buy the mower which I still use.
In the US economy, productivity was down 1.74% in the first half of 2022 Vs a year ago which was the lowest reading post WWII.
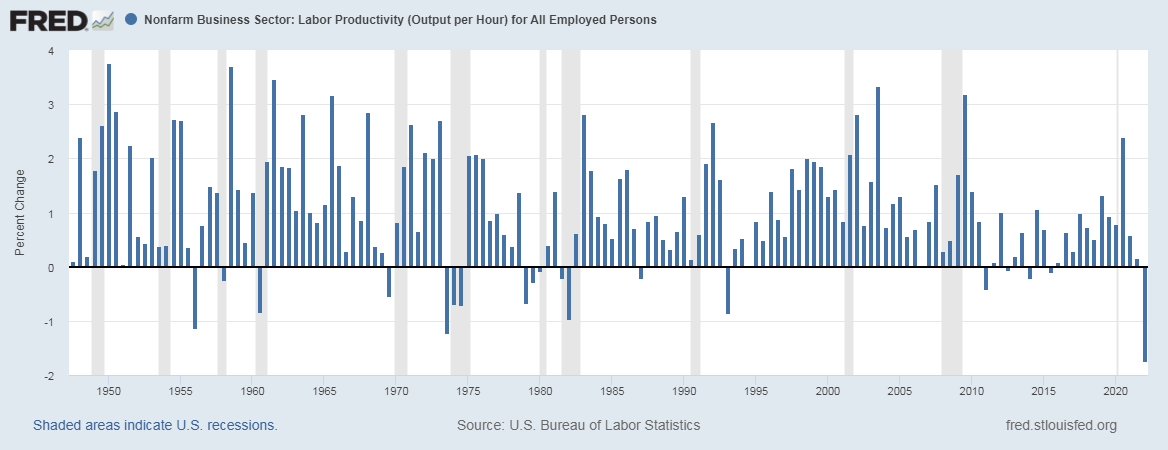
Productivity Growth (ST. Louis Fed FRED)
Simply put, input costs have soared resulting in lower productivity or output per hour.
As I mentioned before about engineers improving methods and or new technology or machines like robots that help improve productivity, that would be the best and most honest way of improving the cost sheet. Other variable factors also play a major role in the cost sheet that will ultimately impact the rate of productivity.
Commodities: Oil, Lumber, Corn, Copper for example. Supply and demand play the major role in the price of these. When they rise, they are an inflationary force and when they fall, they can be a deflationary force to the cost sheet.
Currency: The Strength of the US dollar can be a deflationary force or an inflationary force as it relates to the cost of commodities and imports for example.
Imports: Importing goods from cheaper sources has played a major role in being a deflationary force and improving productivity. This played a bigger role up until around 2012 when imports as a percent of GDP peaked. The value of the dollar is more dominant now. Having to produce more goods domestically could prove to be a very inflationary force.
Commodities
My go to source for the current state of commodities is the CRB Index which is a basket of 19 commodities that is a mix of energy, agriculture and metals.
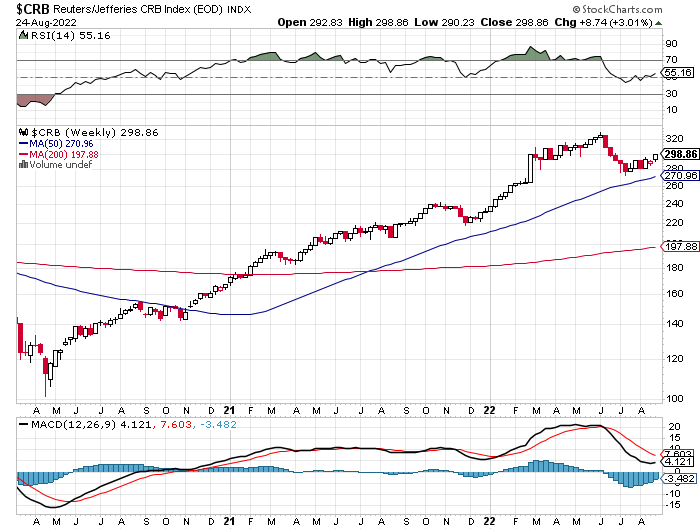
CRB Index (Stockcharts.com)
This index has been up substantially for nearly 3 years now per the chart above. It’s currently at 298 and it was about 220 this time last year, so it’s up nearly 36% year over year. It’s come down a bit in July after peaking in early June but appears to remain in a bull trend for now.
US Dollar
Using simply the US dollar index, the dollar has been very strong for the past 12 months, making this the sole deflationary force that is helping to offset monetary inflation.
Here is a 1 year chart of the Dollar Index:
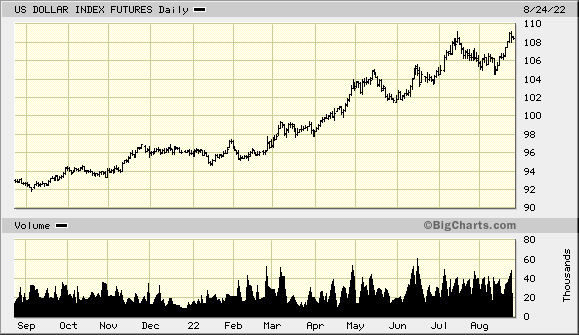
US Dollar Index (bigcharts.com)
This index was about 93 a year ago and is currently 108.40. It’s up nearly 16.5% year over year.
We should stop and pause that commodities are as up as they are in dollars and yet the dollar is very strong relative to most other currencies, meaning commodities are up even more for foreigners.
Conclusion
The Fed is trying to get inflation down by hiking rates which should lower the rate of borrowing and lessen the rate of debt growth per capita. This will help lower the rate of inflation but will absolutely hit wages, both hourly and even aggregate so I expect jobs losses on account of simply not having the money to pay for the workers but also, consumers not having the money to pay for the goods and services.
Inflation may well come down to 3-5%, but weekly earnings may well remain lower making real weekly earnings remain negative for now.
Productivity is out of gas currently as new methods and technology are not there to help. Everybody has LED light bulbs now. Robots taking jobs was a false premise and will continue to be so. The problem lies in the input costs from the commodities which is a major driver of lower productivity and a fierce inflationary force.
Part of the efforts of the Fed to tighten rates to lower inflation should be to also reduce wage and salary disbursements. As a result of that, demand should fall and that should help to reduce the price of commodities on falling demand, so that’s a possibility there.
The strong US dollar is a major deflationary force that is helping more than most people realize. When the time comes when the dollar starts to decline relative to our trading partners, this will turn into an inflationary force.
A return to normal will be when weekly earnings are rising faster than the rate of inflation and I don’t see that happening just yet or anytime soon.
Ideally, we’d want to see no job losses coupled with lower inflation and strong gains in wages and weekly earnings. We may well end up with job losses, but an inflation rate far closer to the rate of weekly earnings for those who still have a job over the coming 12 months.
Consider these thoughts relative to what the market expects in the months ahead.
Be the first to comment