


marchmeena29/iStock via Getty Images
Investment Thesis
The Invesco S&P Ultra Dividend Revenue ETF (NYSEARCA:RDIV) is one of the easiest ways dividend investors can secure a consistently high yield by investing in large- and mid-cap stocks likely to be profitable. Its Index selects the top 60 dividend-yielding stocks in the S&P 900 Index and weights them by revenue, rinsing and repeating each quarter. This process makes RDIV almost like an actively-managed ETF; long-term investors need to trust the strategy because keeping up with its substantial changes at each reconstitution is a challenge in and of itself.
My assessment of RDIV is that it’s not worth the effort, but that doesn’t mean short-term opportunities won’t arise. Since my bullish article in August, RDIV outperformed the SPDR S&P 500 ETF (SPY) by over 10% but performed in line with other ETFs in its category. I’ve reviewed the latest holdings in detail again, and I don’t think a compelling opportunity exists anymore. Take your profits and invest them with a more stable ETF, and I hope I can convince you why with this article.
RDIV ETF Overview
Strategy & Past Performance
RDIV tracks the S&P 900 Dividend Revenue-Weighted Index, selecting the top 60 dividend-yielding stocks in the S&P 900 Index. It reconstitutes every January, April, July, and October, and since the distribution of yields among a large universe of stocks is tight, investors can expect substantial portfolio turnover. The Index avoids the most obvious yield traps by excluding the top 5 percent of dividend-yielding stocks, as measured by average yields over the previous four quarters. It’s a screen I agree with, but my research shows excluding the top 10-20% would be better. Before we look into the fund’s current composition, here’s a summary of key metrics you can use for easy reference later.
- Current Price: $44.72
- Assets Under Management: $798 million
- Expense Ratio: 0.39%
- Launch Date: September 30, 2013
- Trailing Dividend Yield: 3.07%
- Three-Year Dividend CAGR: -0.33%
- Five-Year Dividend CAGR: 5.15%
- Five-Year Beta: 1.04
- Number of Securities: 60
- Portfolio Turnover: 97% (81%, 74%, 122%, and 98% From 2017-2020)
- Assets in Top Ten: 45.36%
- 30-Day Median Bid-Ask Spread: 0.05%
- Tracked Index: S&P 900 Dividend Revenue-Weighted Index
- Annual Report Link: Here
You can see that the turnover is routinely near the 100% mark, so many moving parts make past performance analysis difficult. Fees are above-average at 0.39%, and dividend growth rates are meager. RDIV’s results since its inception are below, and I’ve compared it to others in the high-yield category like the:
- Invesco High Yield Equity Dividend Achievers ETF (PEY)
- Schwab U.S. Dividend Equity ETF (SCHD)
- iShares Core High Dividend ETF (HDV)
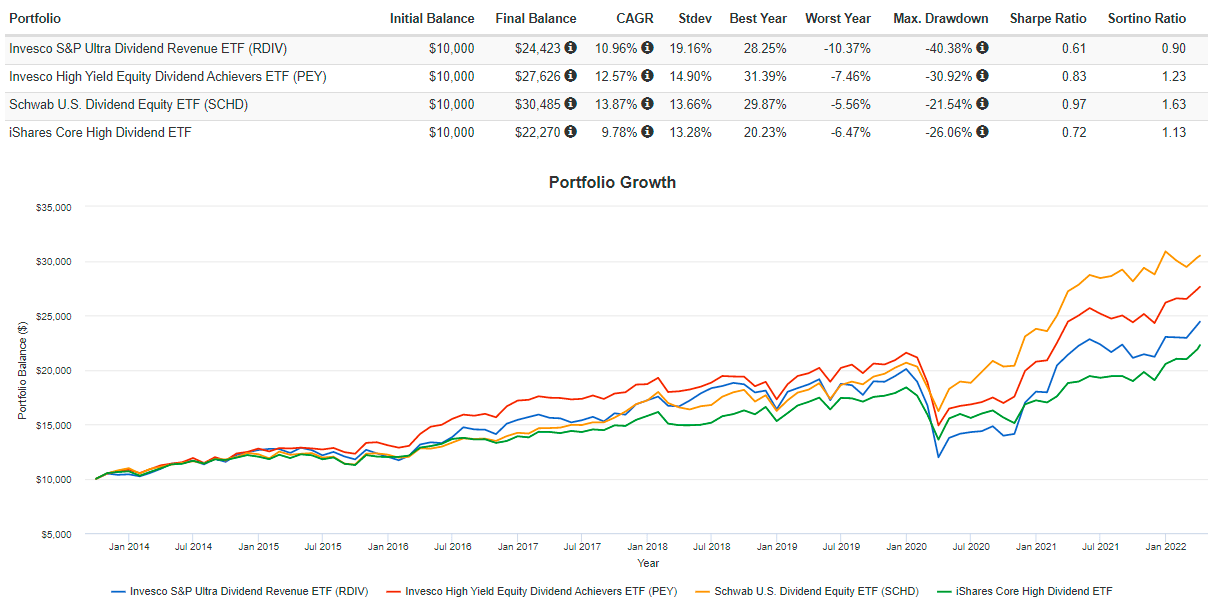
Portfolio Visualizer
RDIV’s annualized growth rate of 10.96% is well behind that of PEY and SCHD and about a percentage higher than HDV’s. However, it’s the volatility that stands out to me. RDIV’s annualized standard deviation of 19.16% was substantially more than its peers, so something unique happened with RDIV. Let’s take a closer look at its current constituents.
Sector Exposures and Top Ten Holdings
I’ve listed RDIV’s sector exposures below and compared them with the three peers noted earlier and the SPDR S&P 500 ETF.
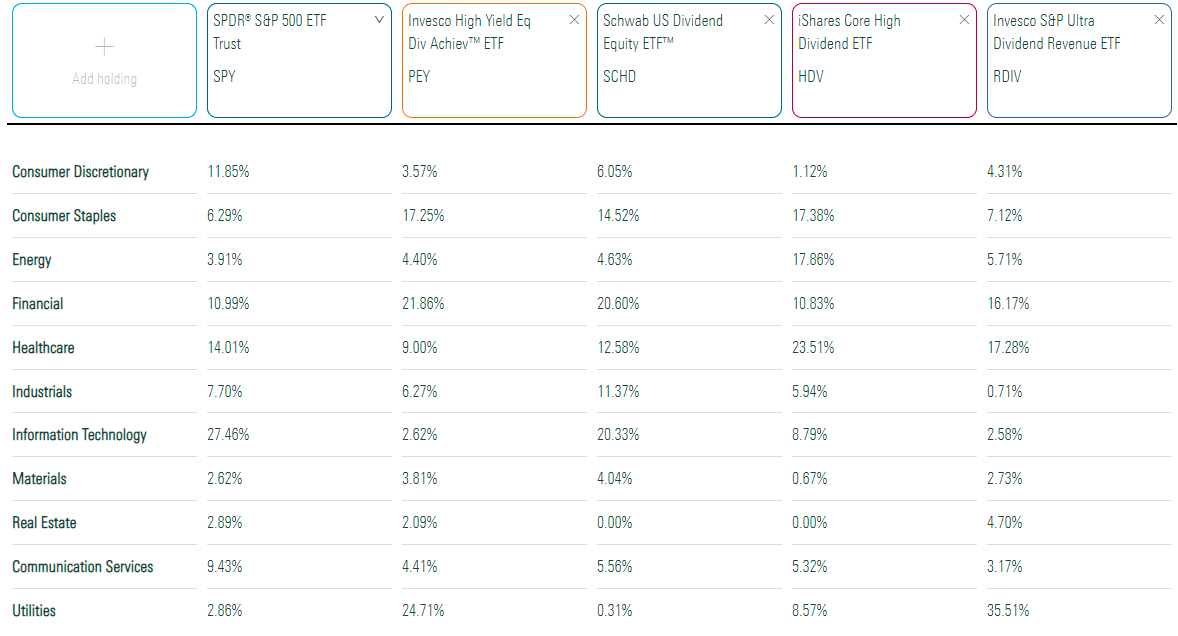
Morningstar
It’s remarkable how defensive RDIV has become since my last review in August. Today, the Utilities sector accounts for 35.51%, 15% more than before. RDIV also overweights Financials and Health Care stocks but underweights nearly every other sector. SPY is probably the most balanced and diversified of the five funds shown, but that’s not necessarily preferred as the market rotates in favor of value stocks. Here are the top ten holdings, including many names you’ll likely recognize.
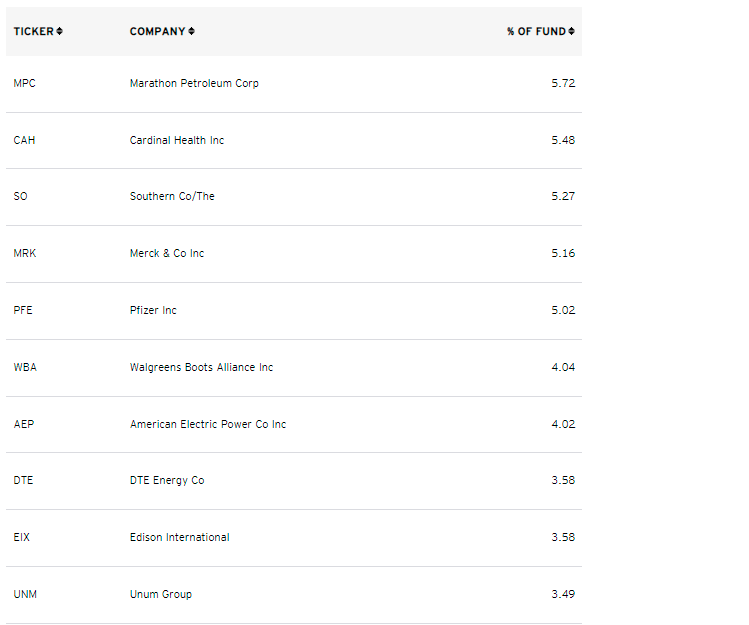
Invesco
Invesco considers nearly half of RDIV to be mid-cap value stocks, but practically all of these top ten holdings are popular large-cap names, including Marathon Petroleum Group (MPC), Walgreens Boots Alliance (WBA), and Pfizer (PFE). It’s because the Index is revenue-weighted, but obviously, there must be numerous mid-cap stocks with high yields that qualify. This top ten list is substantial, totaling 45.36%, but I don’t think it’s representative of the ETF.
Fundamental Analysis
Industry Snapshot
I’ve highlighted selected fundamental metrics for RDIV’s top 20 industries in the table below. Have a look through, and I’ll offer my comments after.
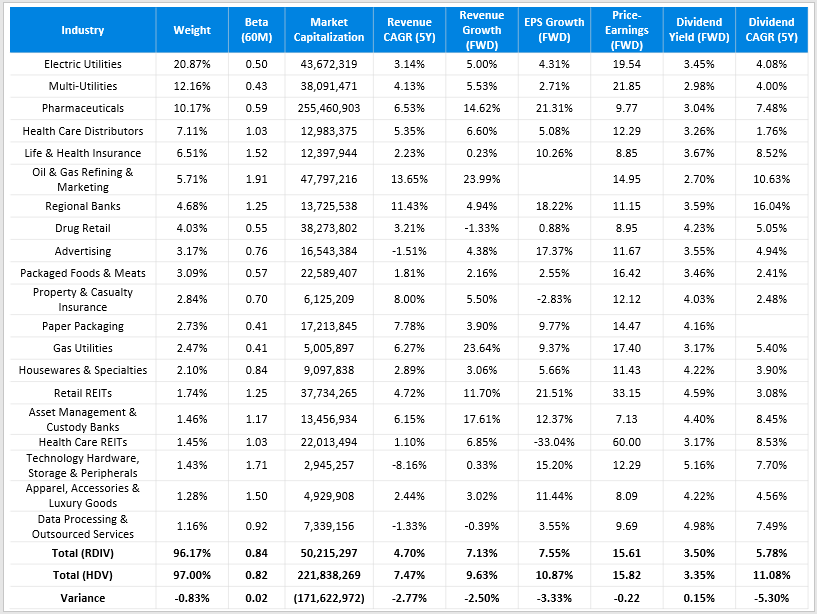
Author
I chose HDV as a comparator since they reconstitute quarterly to deliver a high yield and have a similar concentration level. Also, both have similar five-year betas (0.84 vs. 0.82). Note how this is materially different than what the ETF has experienced over the last five years (1.04). I attribute this mainly to the increasing exposure to Utility stocks. The table above shows how Electric, Multi, and Gas Utilities have betas of 0.50, 0.43, and 0.41, respectively.
As described in my recent article on the Utilities Select Sector SPDR ETF (XLU), I favor the sector. Contrary to popular opinion at the time, Utilities aren’t necessarily unattractive due to rising ten-year treasury yields. XLU has outperformed SPY by over 7% since publication just a few weeks ago, and yields have increased from 2.13% to 2.70% during the same period. Therefore, I don’t think the high exposure to this sector is a big issue, but investors probably want more diversification.
In terms of growth, RDIV is lacking. On the sales side, its constituents only grew at an annualized rate of 4.70% in the last five years compared to 7.47% for HDV. RDIV also lags on forward revenue and sales growth, making it vulnerable should growth stocks reverse course. There’s no advantage in terms of valuation or dividend yield, either. I’ve estimated RDIV’s gross yield to be 3.50%, but fund fees of 0.39% will reduce that.
Company Snapshot
The following table provides a company-level snapshot of RDIV. I’ve selected metrics that will provide insights into the dividend’s safety and sustainability since yield traps are common with high-dividend ETFs.
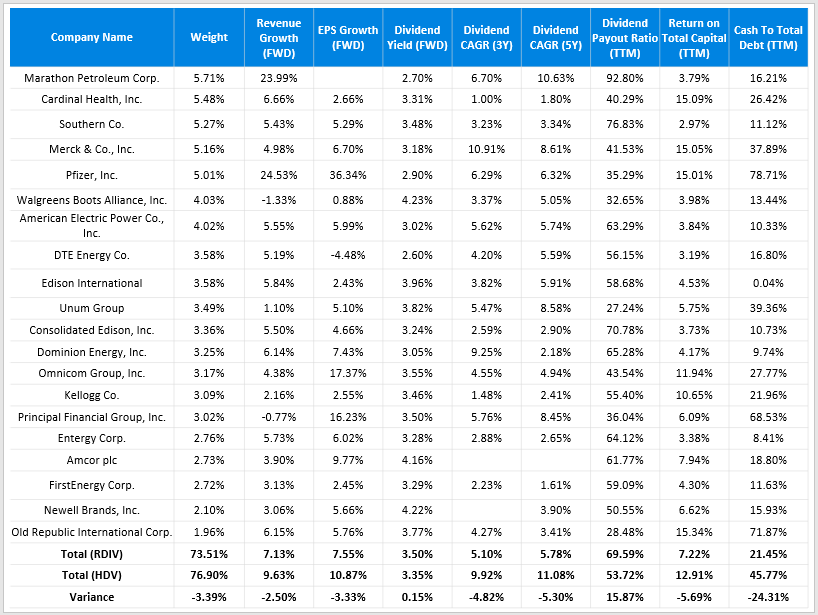
Author
It’s worth noting how only two companies in RDIV’s top 20 have a double-digit estimated revenue growth rate: Marathon Petroleum and Pfizer. You can include Principal Financial Group (PFG) on estimated EPS growth, but that’s it. Dividend growth also looks limited since yields are stretched. Payout ratios are about 70%, return on total capital is only 7.22%, and constituents’ cash to total debt ratio is meager at 21.45%. It’s an evident weakness even after accounting for the high exposure to capital-intensive utility stocks.
Backtested Portfolio
I mentioned earlier how analyzing the past performance of high turnover ETFs like RDIV is often challenging. To illustrate, I’ve simulated the current portfolio back three years (assuming quarterly rebalances) and compared it with RDIV’s actual results during this period. The graph below shows that the current portfolio would have performed slightly better, but it’s the lower volatility that stands out.
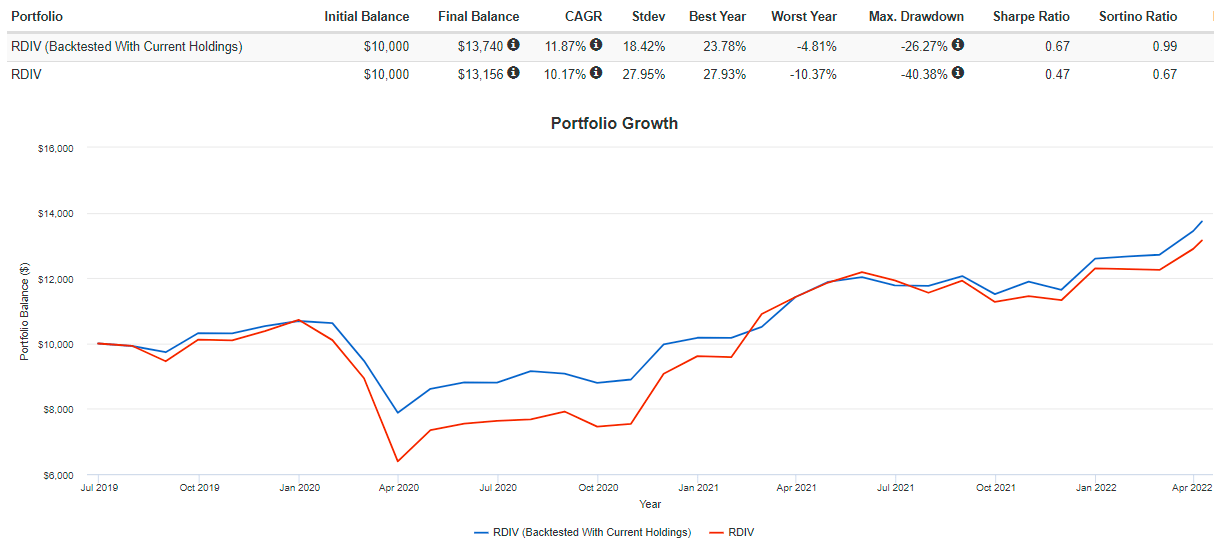
Portfolio Visualizer
Today’s portfolio is much safer, with an annualized standard deviation of 9% less and a maximum drawdown of 14% less. These results are consistent with my tracking of RDIV’s beta in the last year. It was 1.11 in May, 1.02 in August, and 0.84 today. Expect RDIV to do well should the market experience a correction or recession but underperform otherwise.
Alternatives
Finally, I want to offer some alternatives for the benefit of current RDIV shareholders. In the table below are 20 high-dividend ETFs and their returns through March, and despite the solid six-month period RDIV had, five ETFs managed to outperform. On a one-year basis, 12 ETFs outperformed, and in the last five years, RDIV placed 10th out of 16 funds with sufficient history. So while recent performance is encouraging, I think many of these ETFs are better long-term holds.
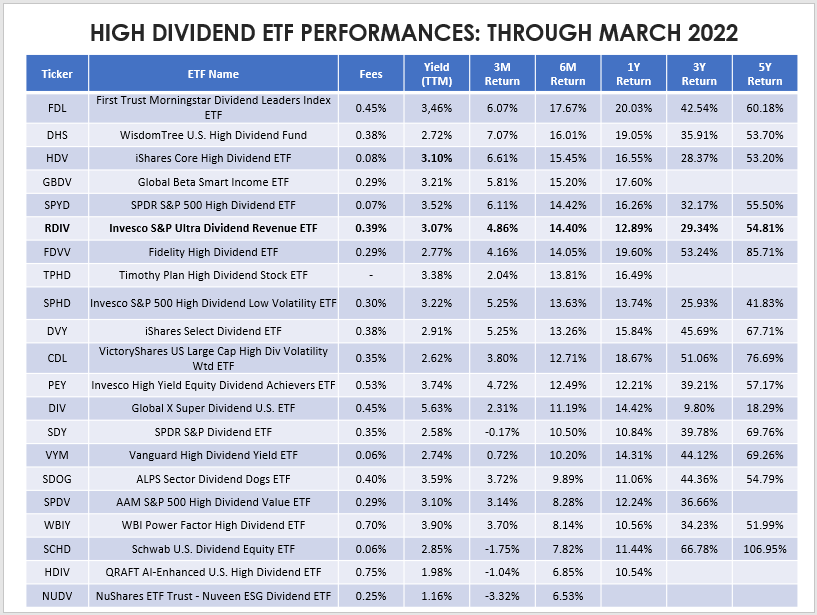
Author
Investment Recommendation
RDIV isn’t a great long-term investment because of its unpredictability and relatively high fees. High turnover isn’t always a bad thing but often is for ETFs rotating into stocks based on dividends and price but not quality. In addition, investors seeking yield should seek to keep expenses to a minimum since they come directly off distributions. It’s a key reason why RDIV’s underlying holdings should generate a yield of around 3.50%, but instead, RDIV will distribute closer to 3%. Given how ten-year treasuries yield 2.70%, it doesn’t stand out.
RDIV has done well over the last six months, but it likely won’t last. Sales and earnings growth is much too slow, and dividends growth potential is low, as suggested by its poor payout, return on total capital, and cash to total debt ratios. If it does succeed, it will be because of strength in the Utilities sector. However, you can buy XLU and end up with around the same yield, then supplement it with a higher-growth ETF like HDV. In summary, don’t buy RDIV, and if you already own it, consider taking some profits. Thank you for reading, and I’m happy to answer any questions in the comments section below.
Be the first to comment