

marcoventuriniautieri/iStock via Getty Images
Investment Thesis
Since my last review, The Invesco S&P Ultra Dividend Revenue ETF (NYSEARCA:RDIV) surpassed my expectations, delivering a 0.39% total return in a primarily downward market. On reflection, I underestimated how much turnover there would be in just eight short months. RDIV’s five-year beta increased from 0.84 in April to 1.09 today and eliminated nearly more than half of its defensive Utilities holdings. Most importantly, its lack of predictability is an investor’s most considerable risk. While the strategy guarantees a high dividend, I strongly suggest using it only as a tactical addition to your portfolio, as the quarterly changes are too difficult to adjust to regularly.
ETF Overview
Strategy Discussion
RDIV tracks the S&P 900 Dividend Revenue-Weighted Index, selecting the top 60 dividend-yielding stocks in the S&P 900 Index. The Index, which includes large- and mid-cap companies, reconstitutes each January, April, July, and October, resulting in portfolio turnover routinely exceeding 100%. I’ve discussed this previously, but I stress that RDIV is an ETF the average investor will find extremely difficult to keep tabs on. You need to trust the strategy that weights these high-yielders by their trailing twelve-month revenues. The only thing guaranteed is a high dividend yield and a low valuation, which go hand in hand. You’re unlikely to find much consistency in the portfolio’s volatility, growth, and even profitability, so if managing those factors is part of your investment strategy, RDIV is inappropriate. Before looking at RDIV’s current composition, here is a list of statistics you might find helpful.
- Current Price: $44.25
- Assets Under Management: $958 million
- Expense Ratio: 0.39%
- Launch Date: September 30, 2013
- Trailing Dividend Yield: 3.17%
- Three-Year Dividend CAGR: 1.03%
- Five-Year Dividend CAGR: -0.61%
- Number of Securities: 60
- Portfolio Turnover: 110% (74%, 122%, 98%, and 97% From 2018-2021)
- Assets in Top Ten: 48.11%
- 30-Day Median Bid-Ask Spread: 0.04%
- Tracked Index: S&P 900 Dividend Revenue-Weighted Index
Sector Exposures and Top Ten Holdings
RDIV looks much different now than it did in April. The last two quarterly reconstitutions slashed exposure to the well-performing Utilities sector from 35.51% to 13.70%. In exchange, Energy went from 5.71% to 18.50%, and Consumer Discretionary increased from 4.31% to 14.58%. These changes explain the significant increase in the portfolio’s five-year beta and have turned a once-defensive ETF into an aggressive one.
Invesco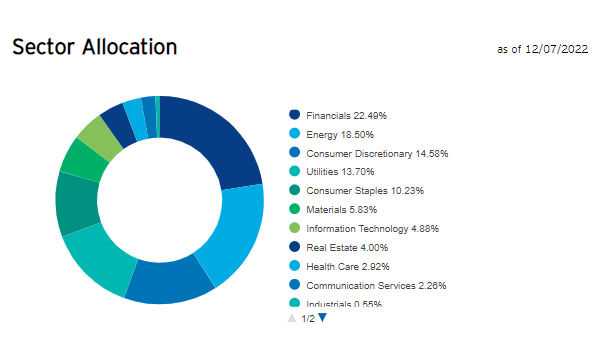
RDIV’s top ten holdings total 48.11%, led by Best Buy (BBY), Walgreens Boots Alliance (WBA), and Intel (INTC). Chevron (CVX), Exxon Mobil (XOM), and Valero Energy (VLO) are the key Energy holdings, while Duke Energy (DUK) leads the Utilities sector.
Invesco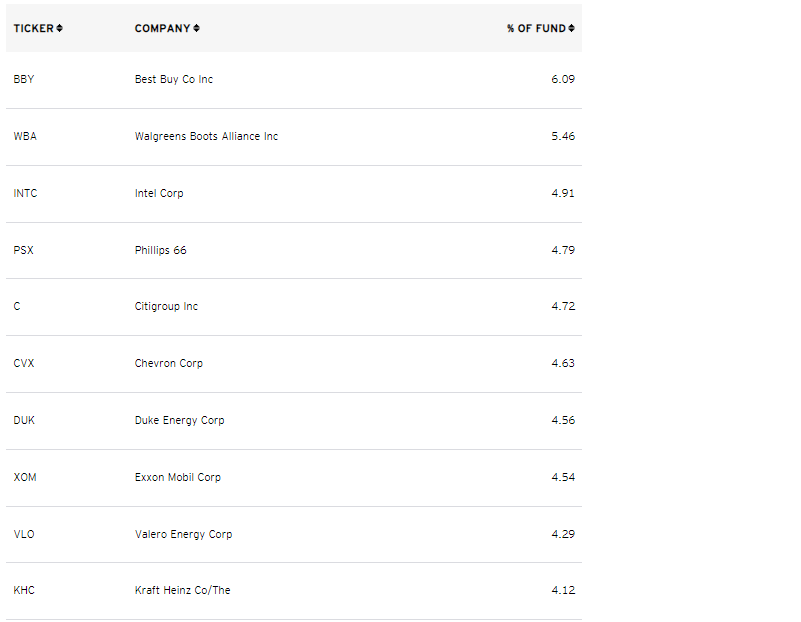
Compared to April, here are the ten most significant changes.
- Best Buy (BBY): +6.09%
- Marathon Petroleum (MPC): -5.71%
- Cardinal Health (CAH): -5.48%
- Merck & Co. (MRK): -5.16%
- Pfizer (PFE): -5.01%
- Intel (INTC): +4.91%
- Phillips 66 (PSX): +4.79%
- Citigroup (C): +4.73%
- Chevron (CVX): +4.64%
- Duke Energy (DUK): +4.56%
Performance Analysis
The following graph highlights RDIV’s performance against a 50/50 portfolio consisting of the Invesco S&P 500 Revenue ETF (RWL) and the Invesco S&P MidCap 400 Revenue ETF (RWK). The approach isolates the high-dividend factor, and the strategy generally increases volatility and potentially runs counter to how you may view dividend-paying stocks.
Portfolio Visualizer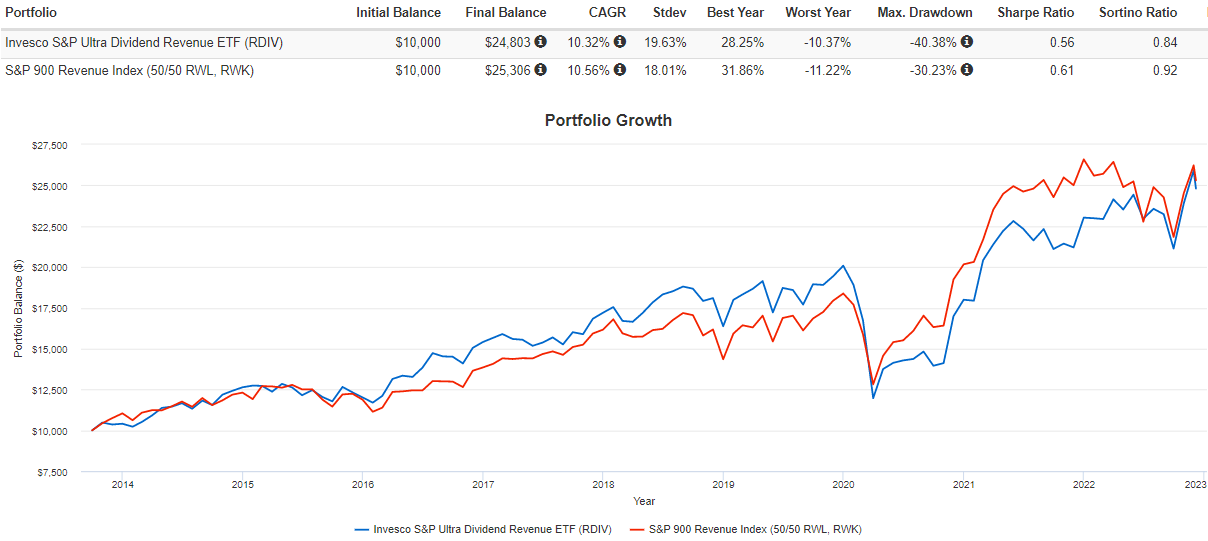
This graph shows how RDIV has slightly lagged the benchmark portfolio by 0.24% per year with slightly higher volatility, leading to lower risk-adjusted returns (Sharpe and Sortino Ratio). RDIV’s 40.38% drawdown in Q1 2020 was about 10% worse than the benchmark, though it fully recovered within 11 months, according to Portfolio Visualizer. While I consider added volatility as a negative for dividend investors, some may see it as an opportunity. My April suggestion that investors take some profits initially didn’t seem like too bad of a call. However, the October reconstitution that increased RDIV’s beta was timely, and you can see the impact in the graph below against some other popular high-dividend funds. RDIV (the orange line) has since broken even on total returns, with the most outperformance occurring in November.
Seeking Alpha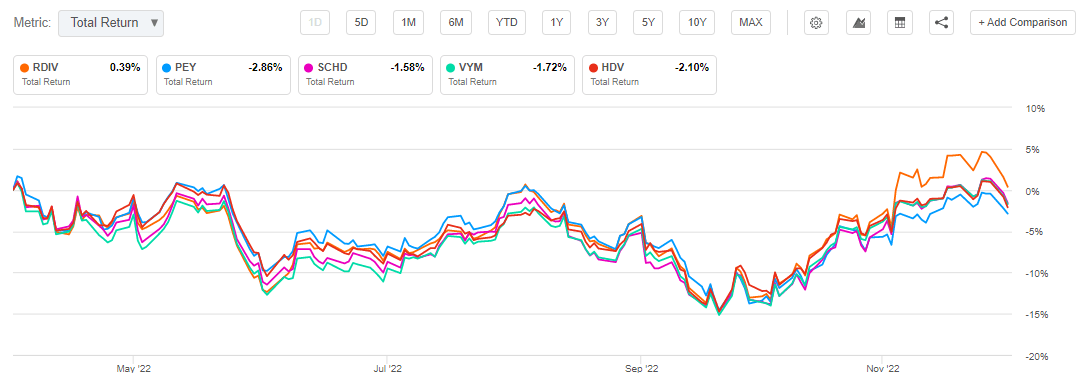
RDIV isn’t a good dividend growth ETF, even though its starting yield is solid. The graph below summarizes the annual portfolio income on a $10,000 investment in September 2013. RDIV still has one distribution remaining this year, so I estimate 2022 income to be $785. However, that’s small compared to what the Schwab U.S. Dividend Equity ETF (SCHD) should achieve ($955) and exemplifies why investors should focus on dividend growth rather than yield.
Portfolio Visualizer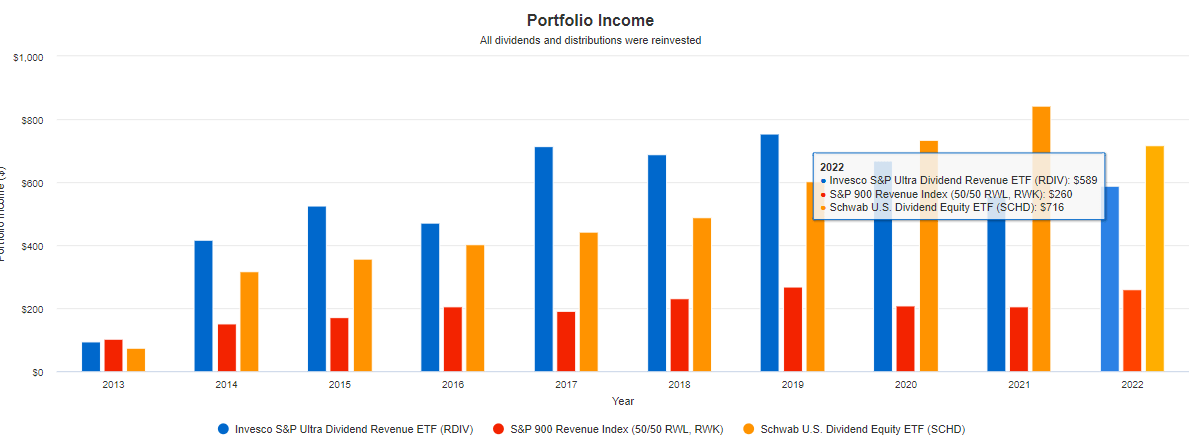
ETF Analysis
The following table highlights selected metrics for RDIV’s top 25 holdings. To showcase recent changes, I’ve also included the metrics for RDIV’s April portfolio and SCHD, which I feel is the better choice.
The Sunday Investor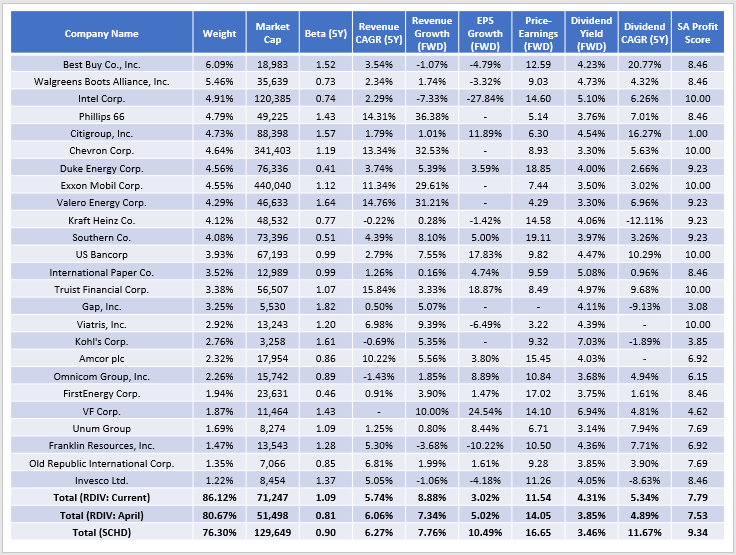
Compared to April, RDIV is much more of a deep-value ETF today. Trading at just 11.54x forward earnings, its constituents have a weighted-average dividend yield of 4.31%. RDIV shareholders can expect to net just under 4% after accounting for fees, which is an attractive feature. However, its constituents also have a weak 5.34% five-year dividend growth rate, which will continue as a problem for long-term holders. Furthermore, RDIV’s 7.79/10 Profitability Score, calculated by normalizing Seeking Alpha’s Profitability Grades for each holding, is below RWL’s 9.32/10 score despite the portfolio holding 76.55% large-cap stocks. Most investors expect a drop in quality when buying deep-value stocks, but it’s a big sacrifice.
As an alternative, SCHD’s 0.90 five-year beta is steady year over year, even though its reconstitutions sometimes result in high turnover. Sales growth is about the same as RDIV, but its expected earnings growth is over 7% better, profitability is higher, and the 11.67% five-year dividend growth rate will quickly make up for SCHD’s lower 3.46% yield (3.40% after fees).
Investment Recommendation
When evaluating an ETF, it’s essential to look at how well a strategy is executed and the quality of its current holdings. My issue with RDIV is more than just because of its high portfolio turnover. It’s primarily that its features constantly change, making it challenging to implement. Instead, the only guarantees are a high dividend yield and a low valuation, and an ETF should be able to do more.
Some positives came out of the latest reconstitutions, and dividend investors will like that RDIV’s expected yield, at least in the short term, should be close to 4%. However, as you extend your planned holding period, dividend growth ETFs look more attractive, and there will come a point in investors’ lives when predictability is appreciated. Since that’s not the case here, I’m merely maintaining my neutral rating on RDIV. However, I can commit to reviewing this ETF quarterly for current owners, and I hope you’ll keep checking back for those updates. Thank you for reading, and I look forward to further discussing this and other dividend ETFs in the comments below.
Be the first to comment