

Funtap/iStock via Getty Images
(This article was co-produced with Hoya Capital Real Estate)
Introduction
After recently publishing QQQX Vs. QYLD: 2 Covered Call Funds On The NASDAQ 100, several readers said that the Nasdaq 100 Covered Call & Growth ETF (NASDAQ:QYLG) was a better fund to compare against the Nuveen Nasdaq 100 Dynamic Overwrite Fund (NASDAQ:QQQX) as both target writing Calls against about half their portfolio, whereas the Global X NASDAQ 100 Covered Call ETF (QYLD) covers 100%.
Sometimes a “apples-to-oranges” comparison has more value, especially if the two “apples” are literally the same. Despite QYLG’s limited history, enough interest was shown within the prior article’s comments, that such an article was warranted. What makes QYLG and QQQX “apples” is their similarities of holdings Nasdaq 100 stocks and targeted 50% CC writing. The “orange” is how the options writing is applied: passive versus active. So far, that has favored QYLG.
Exploring the Nasdaq 100 Covered Call & Growth ETF
Seeking Alpha describes this ETF as:
Global X Nasdaq 100 Covered Call & Growth ETF invests directly and through derivatives in stocks of companies operating across diversified sectors. It uses derivatives such as options to create its portfolio. It invests in growth and value stocks of large-cap companies. It seeks to track the performance of the Cboe Nasdaq 100 Half BuyWrite V2 Index. QYLG was formed on September 18, 2020.
Source: seekingalpha.com QYLG
QYLG has $57m in assets with a current yield of 6.3%. The managers charge 60bps in fees. They list three reason in the fund’s Factsheet why investors would to own their ETF:
- High Income Potential: QYLG seeks to generate income by writing covered calls on the underlying index.
- Upside Potential: By writing calls on 50% of the portfolio, the strategy allows investors to capture half the upside potential of the underlying index.
- Monthly Distributions: QYLG expects to make distributions on a monthly basis.
QYLG Holdings review
globalxetfs.com QYLG Factsheet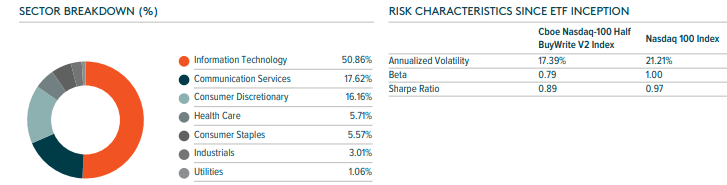
As expected, the sector allocations mirror the leading NASDAQ 100 fund, the Invesco QQQ ETF (QQQ). Also, as desired if not expected, QYLG has lower risk statistics (Beta, StdDev) than the uncovered choice, but that more sedate strategy resulted in a lower Sharpe ratio, meaning QQQ investor received better returns for the risk taken.
The asset allocation is:
- Common Stocks: 102 holdings with a weight of 101.22%
- Call options: 2 holdings with a weight of -1.35%
- Cash: 1 holding with a weight of .13%
Top holdings
globalxetfs.com; compiled by Author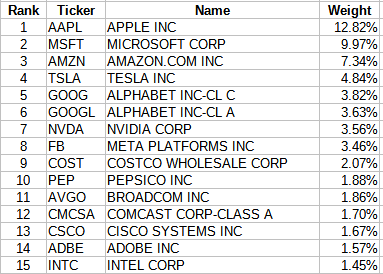
Some of the weighting difference readers will see between QYLG and QQQX is the date of the data as QQQX is from the end of February; QYLG data is current. Currently, QYLG holds options on two indices:
- Short 8 contracts on the NQX Index (5/20/22 with a 2810 strike)
- Short 20 contracts on the NDX Index (5/20/22 with a 37305 strike)
The NQX Index is the Nasdaq-100 Reduced-Value Index and equates to 1/5 the full value of the Nasdaq-100 Index, which is the NDX. Using the “mini” version allows for more precise coverage of the common stocks owned.
QYLG Option Strategy
The Global X Nasdaq 100 Covered Call & Growth ETF (QYLG) follows a “covered call” or “buy-write” strategy, in which the Fund buys the stocks in the Nasdaq 100 Index and “writes” or “sells” corresponding call options on approximately 50% of the value of the portfolio of stocks in the same index.
Source: globalxetfs.com QYLG
Since they benchmark against the , their option strategy follows that of the Cboe Nasdaq 100 Half BuyWrite V2 Index , which describes that strategy as:
The Cboe NASDAQ-100 Half BuyWrite V2 Index (BXNH) measures the total rate of return of a NASDAQ-100 covered call strategy. This strategy (“BXNH covered call strategy”) consists of holding a portfolio indexed to the NASDAQ-100 and selling a succession of one-month at-the-money NASDAQ-100 (NDX) call options listed on the PHLX exchange.
Source: indexes.nasdaqomx.com BXNH
This differs from the Global X NASDAQ 100 Covered Call ETF (QYLD), which covers 100% of their portfolio. Later, I will show how this effects their results versus the two funds covered in this article.
QYLG Distribution review
seekingalpha.com QYLG DVDs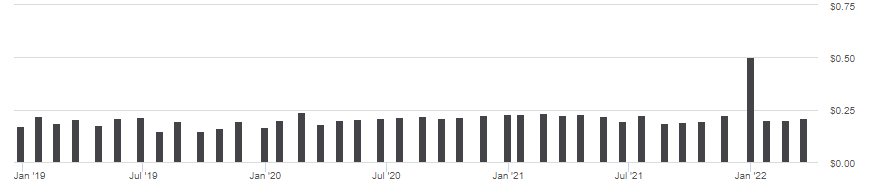
Higher interest rates and volatility are two variables that help push up option premiums, which could help increase future monthly distributions. As with most option-strategy funds, much of the distributions are not from Net Investment Income (NII), but Capital Gains and/or ROC. The next table shows the makeup for the prior fiscal year:
globalxetfs.com QYLG 19-a PDF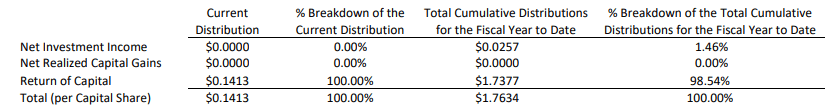
Quick Review of the Nuveen Nasdaq 100 Dynamic Overwrite Fund
This will be a summary of what I wrote in my recent article when I compared QQQX to QYLD. A link to that article is at the beginning of this one.
Seeking Alpha describes this CEF as:
Nuveen Nasdaq 100 Dynamic Overwrite Fund is a closed-end fund designed to offer regular distributions through a strategy that seeks attractive total return with less volatility than the Nasdaq 100 Index by investing in an equity portfolio that seeks to substantially replicate the price movements of the Nasdaq 100 Index, as well as selling call options on 35%-75% of the notional value of the Fund’s equity portfolio. QQQX uses the NASDAQ 100 TR USD Index as its benchmark and launched in 2007.
Source: seekingalpha.com QQQX
QQQX has amassed $1.11b in assets and currently yields 7.46%, with the managers charging 90bps in fees; reasonable for an option writing CEF. Unlike many CEFs, QQQX employs no leverage. Currently, QQQX is at a .95% premium; whereas for most of the first quarter, it sold for a discount.
QQQX Holdings review
Since QQQX invests based on the NASDAQ 100 Index, naturally it is a very Technology-oriented ETF, with 51% of the stocks spread across six Tech-focused industries. The Top holdings reflect that concentration. nuveen.com QQQX At the end of March, QQQX held 151 assets, of which there were 131 US equities, 3 Foreign equities, 2 ETFs, and 9 options, all of which expire in April’22.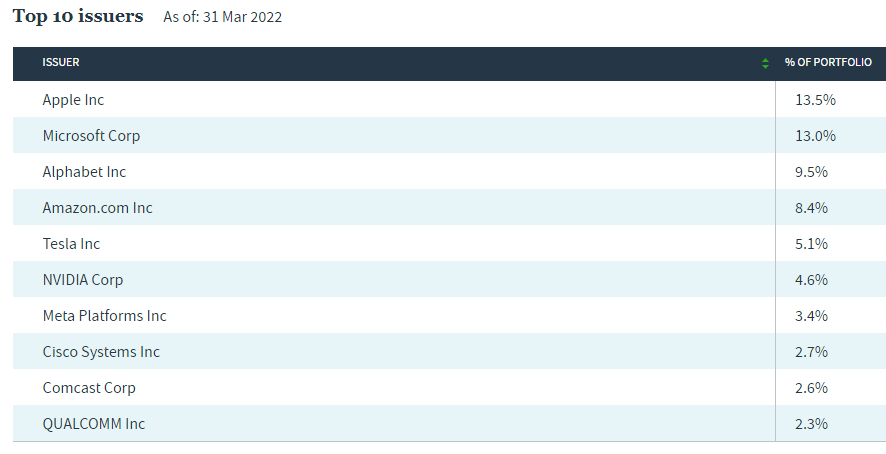
QQQX Option Strategy
Nuveen provides these details on the strategy.
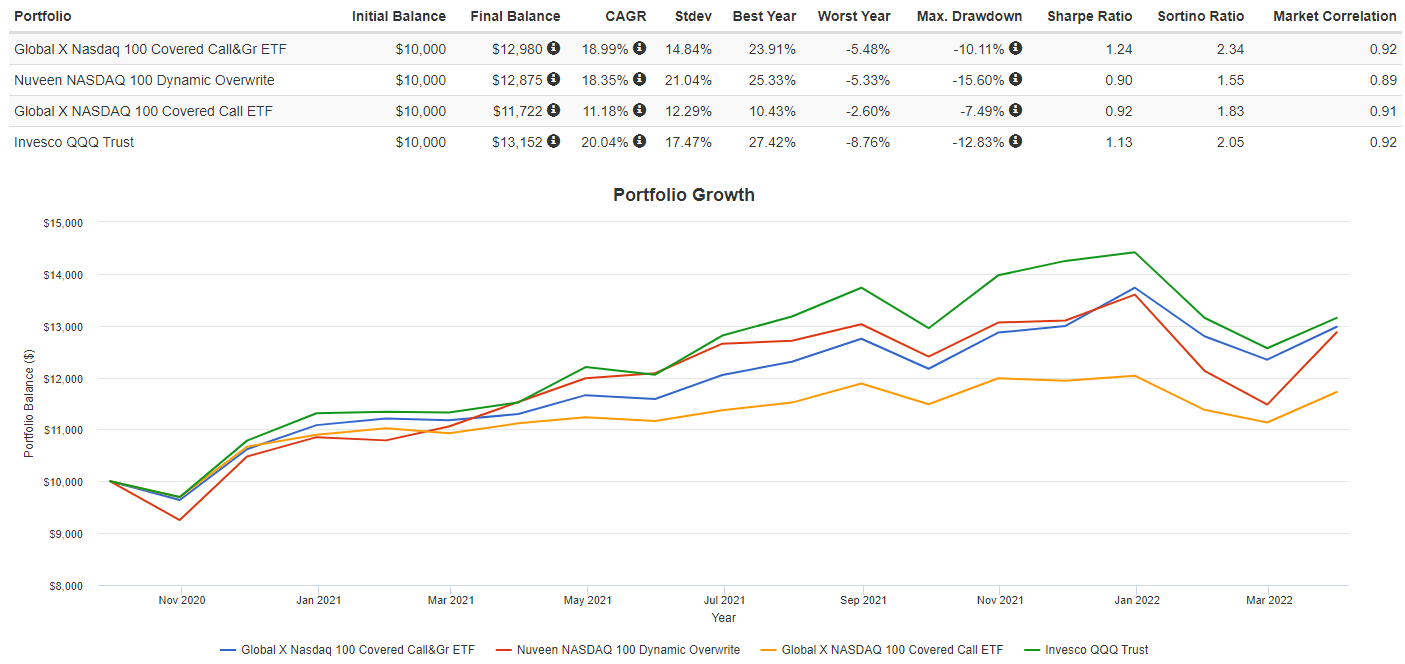
nuveen.com QQQX Definitions for each statistic can be read using this link. At the end of February, QQQX was near the target weight of 55% as coverage was 51%. What I failed to find is any policy related to time or ITM/OTM targets when writing options. The above data refers to the holdings date, not execution values. PortfolioVisualizer.com Looking at the prior chart, notice that QQQX, with its dynamic option strategy, had a big dip earlier this year that QYLG’s index-based strategy avoided. That deviation shows in the Sharpe and Sortino ratio differences, which greatly favor QYLG. With QYLG using a “passive option strategy” and QQQX using, their term, a “dynamic option strategy, that provides a distinct difference to help investors decide between these two funds. With QQQX, you are “betting on” the managers and models used by this fund to be better than using the set 1-month out, ATM option strategy employed by QYLG. Which each investor prefers would seem to depend on the level of risk they want to take on. Real conservative investor might accept the risk/reward trade-off and go with QYLD.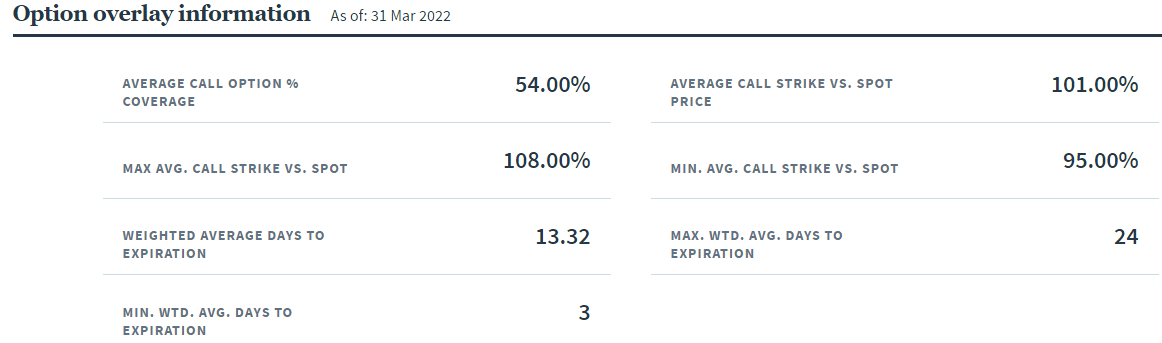
Four Funds with three different approaches to for Nasdaq 100 investors
Final Thoughts
As an investor in any of these funds, are you taking or reinvesting the dividends? Using dividendchannel.com/drip-returns-calculator, it makes a difference in the final CAGR. Using this source, includes the partial months my PV subscription does not include.
| Ticker | Starting Price | Ending Price | Reinvested | Taken |
| QYLG | $26.24 | $28.28 | 17.74% | 18.20% |
| QQQX | $23.64 | $26.46 | 14.41% | 14.38% |
| QQQ | $264.16 | $338.43 | 17.85% | 17.86% |
The website did not say what dividends taken earned but cannot be much over the last 18 months. QYLG investors were better off taking the dividends whereas there wasn’t much difference for the other two funds.
Since the above chart cut off April, I will include this one.
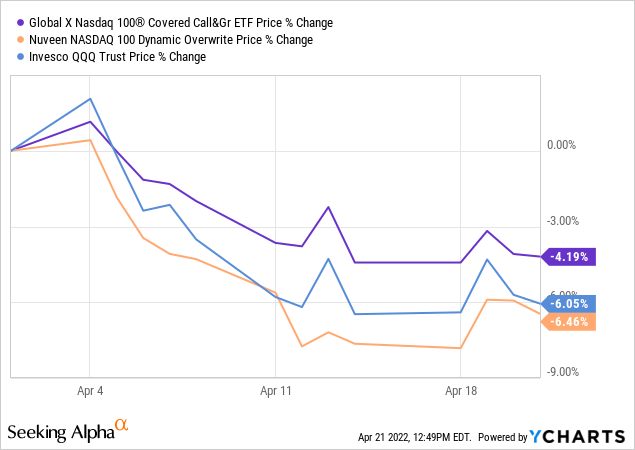
The poorer April performance for QQQX widened the ‘since inception” CAGR with QYLG from 161bps at the start of the month to 333bps by mid-April. The point?: dates matter.
Be the first to comment