


Diego Thomazini
Overview
The present demise of big technology has been sometime in the making. Some 2 years ago, the world was rocked by a global pandemic that confined consumers to their living rooms.
Resolutely, central banks throughout the world took evasive action by pumping cash into an economy on life support. Rock bottom interest rates progressively found their way into risky assets, and we witnessed a capital market boom. Things were great. For a period.
In fact, the bull market of the last decade could be considered vestiges of the Great Financial crisis which rocked capital markets a decade ago. From then onwards, ultra loose monetary policy fired up the world economy once more.
In hand, this created a boom for equities, specifically growth technology plays ever present on the NASDAQ. In fact, technology did so well that it outperformed the broader market by some margin. With hunger for big growth risk capital came a broad range of investment products such as exotic ETFs.
However, economic tides have now turned. A geopolitical crisis sparked by the invasion of Ukraine has generated red-hot inflation, which is now seeping its way into every part of the economy.
To counter this, most sovereign banks have aggressively tightened monetary policy to stem the bleeding. Consequently, as interest rates have risen, so too have discount rates at which onerous tech stocks are valued. Technology is a space you presently don’t want to be.
Source: Spreadsheet developed by author with inputs from Koyfin | ETF.com
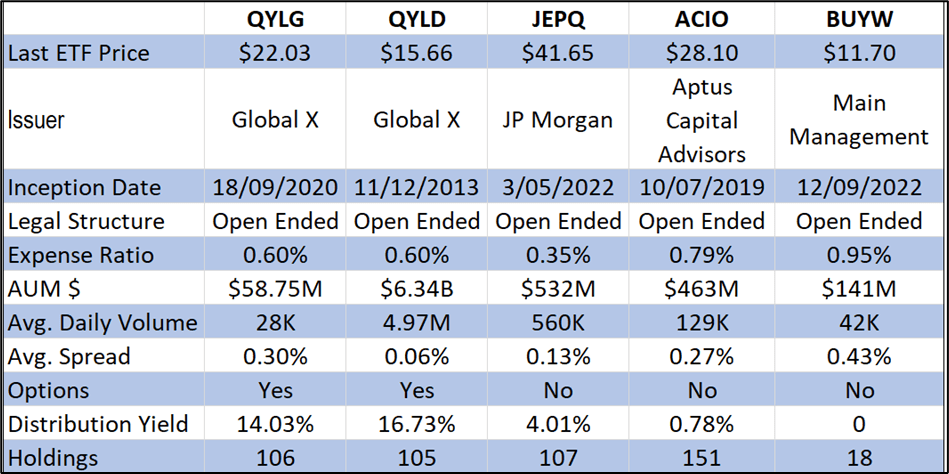
Comparative analysis (NASDAQ:QYLG) v (QYLD) v (JEPQ) v (ACIO) v (BUYW)
(QYLG) Global X’s passively managed ETF provides investors long exposure to Nasdaq’s big growth equities while adding slight improvements in directional risk via call options.
It endeavors to give investors the best of both worlds – growth via the basket of underlying assets and yield via the sale of derivatives. It sells one month at the money call options on half the portfolio with premiums passed onto investors net of fees.
That’s great, but arguably any savvy investor can replicate the same payoffs simply by selling covered calls on a tech portfolio without the added expense ratio.
Launching about 2 years ago, the fund has done little to garner much investor attention, posting a measly $60M in assets under management. Korean fund player, Mirae Asset Management has ostensibly pitched this one at investors who want passive risk management chucked into their ETF without having to do the work themselves. Info on its distant cousin, (XYLD) can be found here.
Source: SEC | EdgPayoff Diagram
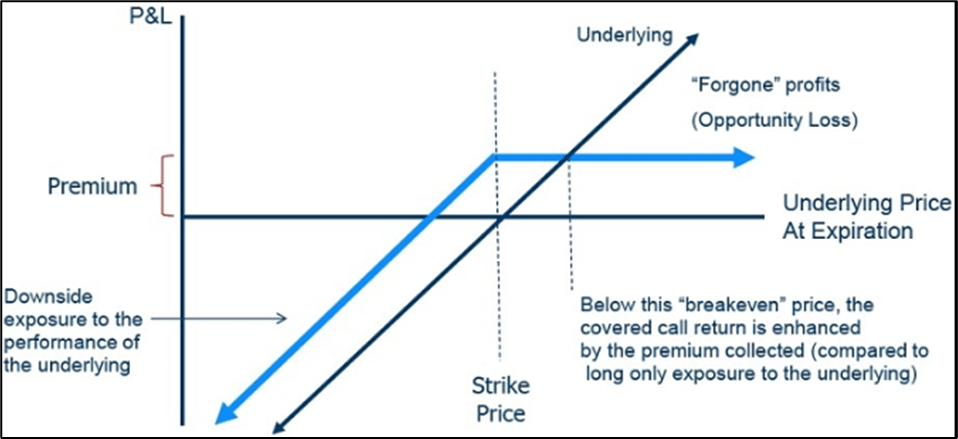
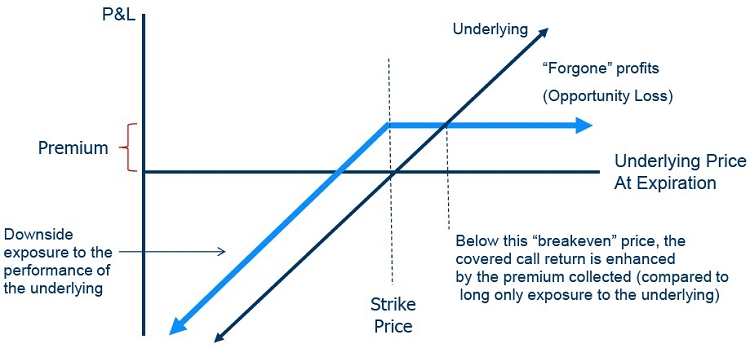
Payoff Diagram – Covered Call
Source: SEC | Edgar
Covered Call
For the derivative newbies, a covered call is a neutral-to-mildly bearish strategy that uses 2 types of security – a call option that is sold in return for premium and the underlying, in this case 106 stocks presently making up the NASDAQ 100.
A (short) call option changes the directional risk bias of the portfolio as the option gains value should the underlying move to the downside. In exchange for this, the seller also caps potential gains, limited to premium made by selling the option and the difference between the strike price and the original cost of the equity.
In this instance, the ETF sells monthly at the money call options, providing negative delta and improved risk exposure in bearish markets. Simplistically said, if an ETF has a delta of 100, then selling an at the money call option will have a delta of -50. That means for every one dollar move in the underlying, the value of the option will change by $0.50.
Delta, which measures directional risk in an option, is dynamic and will converge to either 1 (acting like 100 shares of the underlying) or 0 (not moving at all) as the contract comes to expiry. It is also noteworthy to mention that short options benefit from the passing of time (theta) but are exposed to spikes in volatility (vega).
So, to exemplify the risk exposure differences between simply holding an ETF which is a proxy of the NASDAQ, you would have directional risk exposure of 100 shares.
If you sold call options at the money, that risk exposure would be modified to 100 (equity) – 50 (option) = 50. Lowering directional risk exposure using options is perfect when risk-off sentiment abounds.
But the real question any investor needs to ask is why do you want to be in the tech space during a global downturn in the first place?
Source: Koyfin
Year-to-date total returns QYLG
Product Synopsis
The underlying driver of returns in the ETF, beyond the premium generated by selling options, is the stocks in the NASDAQ 100. These are characterized by mega cap technology plays, some consumer discretionary and communication services.
The biggest weighting is Apple Inc (AAPL) at 13.56% with Microsoft (MSFT) – 10.49%, Amazon (AMZN) – 6.93% and Tesla (TSLA) following not too far behind.
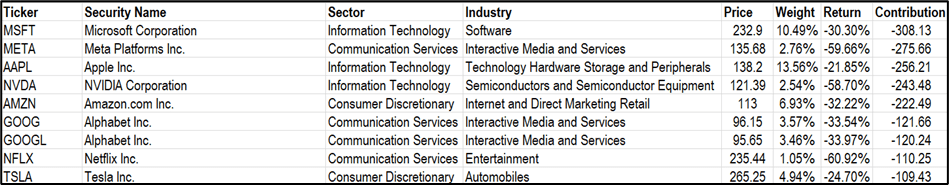
Source: Spreadsheet developed by author via data from Koyfin
Biggest losing components of ETF YTD
Year-to-date, information technology has contributed the most to the fund’s losses, posting returns of -37.21%. Arguably, communications services (-29.35%) and consumer discretionary (-25.96%) have not done much better, but their weighting is smaller.
In fact, there has not been much green on the screen with the NASDAQ 100, with only a handful of tickers posting positive risk-adjusted returns year to date.
The standout is Vertex Pharmaceuticals (VRTX) +31.85% but with a weighting of just 74 basis points, the contribution has hardly been a standout. (+0.12% contribution YTD)
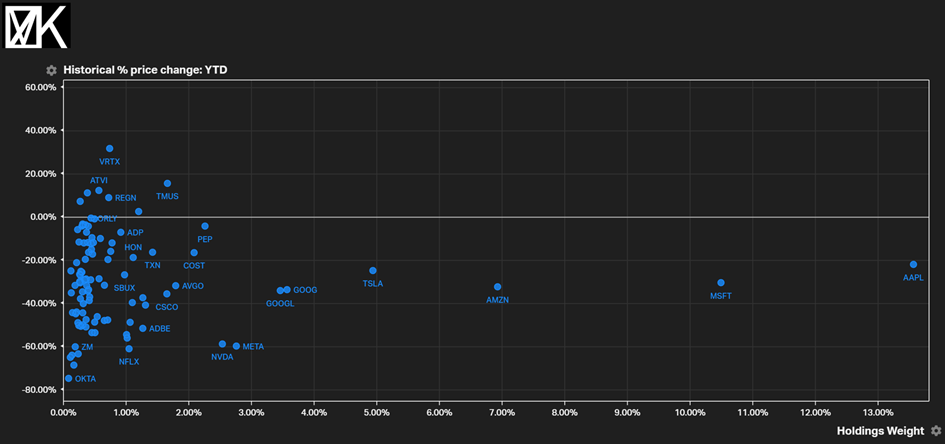
Source: Koyfin
Scatter diagram – individual total % price change v holdings weight (QYLG)
Another sizable problem with this fund is liquidity – at solely $60M in AUM, dried up liquidity makes (QYLG) an expensive trade. Daily, only ~$28K of stock changes hands – literally nothing in capital market terms.
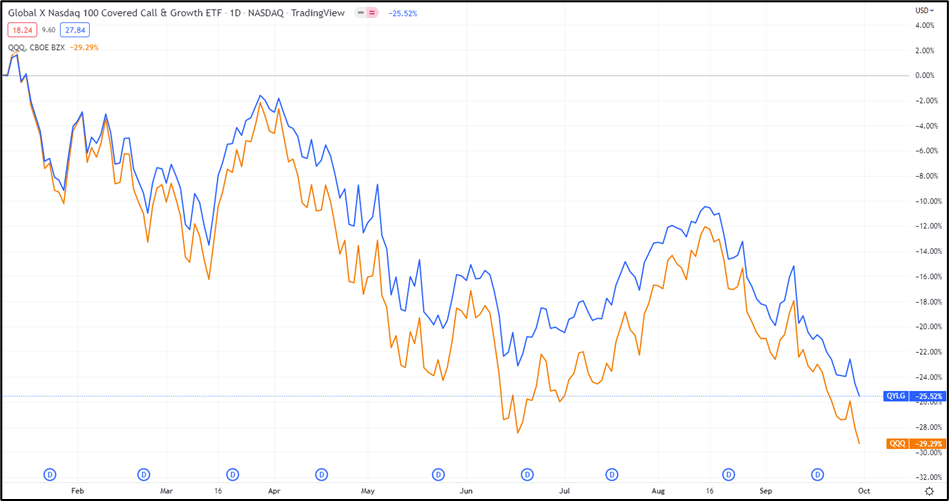
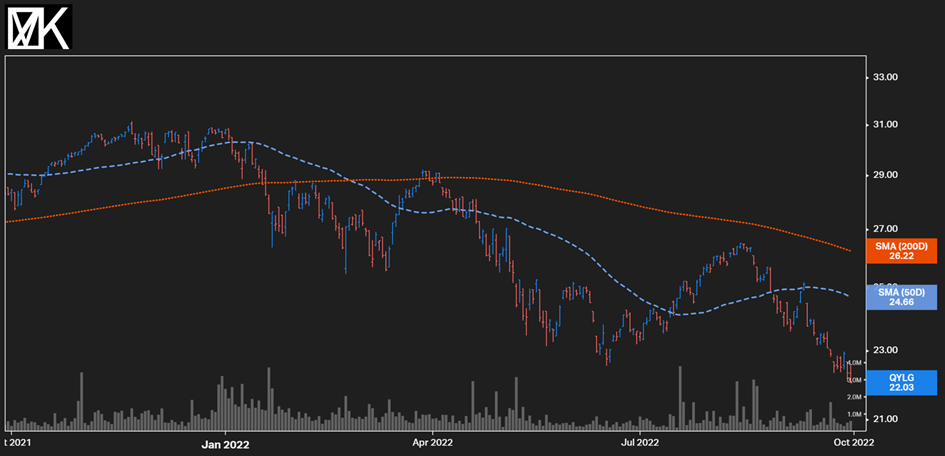
Source: Tradingview
Juxtaposed against year-to-date total returns, the hedging nature of call options can be witnessed, with (QYLG) only giving up -25.52% v (QQQ) -29.29%.
Key Takeaways
- QYLG provides investors hedged risk exposure to the Nasdaq 100.
- It achieves this by selling at-the-money call options and by doing so, changing the directional risk exposure of the basket of risky assets.
- Covered calls are options strategies suited to bearish or neutral markets, benefiting from time decay (theta) but being exposed to spikes in volatility (vega).
- The premium generated by the selling of call options contributes towards the hefty distribution yield (14.03%)
- The ETF is part of a more exotic bunch of funds promoted by Global X. Expenses ratios are on the high side and liquidity is an issue.
- The bigger question before taking a stake in an exotic derivatives-focused ETF linked to returns on the Nasdaq is why be in the market right now anyway?
Be the first to comment