


Umnat Seebuaphan/iStock via Getty Images
Two ETFs Offering Startlingly High Dividends – Where’s The Catch?
Often when I write about dividend ETFs readers will suggest that I look into one of the covered call ETFs: the Global X Funds – Global X NASDAQ 100 Covered Call ETF (NASDAQ:QYLD) and the Global X Funds – Global X Russell 2000 Covered Call ETF (BATS:RYLD). Both of these ETFs pay far higher dividends than do any of the popular High dividend ETFs, none of which are paying particularly high dividends right now. Some retirees find these dividends particularly appealing as they are distributed monthly.
According to Seeking Alpha, QYLD’s 2021 end of year dividend yield was 12.85%. Its forward yield is listed as 12.07%. RYLD’s 2021 year-end yield was 12.35%. Seeking Alpha gives RYLD’s forward yield as 12.86%.
Yields that high should be setting off alarm bells in the minds of any investor who had learned, possibly the hard way, that if it looks to good to be true, it probably is. Nevertheless, only one Seeking Alpha author is bearish about these ETFs. Most of the articles written about them suggest they provide a fine income stream and some say they are likely to outperform going forward.
All this intrigued me enough to get me to dive into these ETFs’ prospectuses to see what I could learn about what these funds do, what kinds of distributions they distribute, and what investors should expect them to do under differing future market scenarios.
Finally, I wondered how similar they were to each other and whether one was a better investment than the other.
QYLD And RYLD Share Many Common Traits
Both these ETFs are products of the same Korean company, Mirae Asset. An American Brokerage, SEI Investments Distribution Co. distributes these funds in the United States.
QYLD originally was a different fund, the Horizons NASDAQ 100® Covered Call ETF, which started trading in 2013. Mirae bought it in 2018 and changed it. QYLD’s prospectus warns that its performance data before 2018 is for the older fund and should not be used to evaluate QYLD. Nevertheless the product page that SEI Investments Distribution Co. provides for QYLD gives the 2013 date as QYLD’s inception date and provides performance and distribution data which includes its performance as the earlier fund under different management. Seeking Alpha only provides data going back to the end of 2018 when Mirae Asset took over QYLD.
RYLD is a younger fund. Mirae started it quite recently on 04/18/2019.
Both currently have a 0.60% expense ratio, though RYLD’s is actually 0.70% but is mitigated by concessions that expire on March 1, 2023.
QYLD is much larger than RYLD. QYLD has $7.01 Billion in assets. RYLD only has $1.28 Billion.
Morningstar shows us how these ETF’s fund flows have changed over the years. As you can see, both ETFs experienced very little in the way of fund inflow until just last year.
QYLD’s Fund Flows
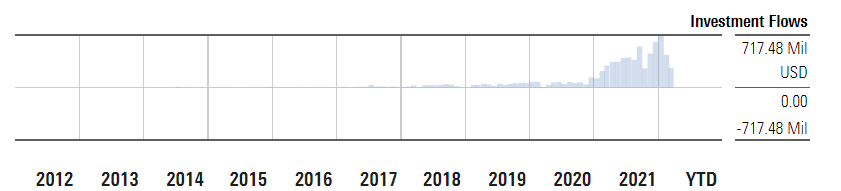
Morningstar
RYLD’s Fund Flows
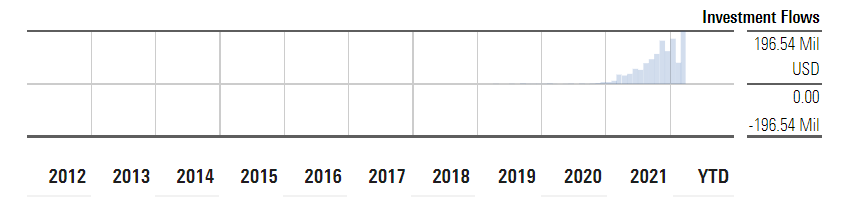
Morningstar
Both QYLD And RYLD Are Passive ETFs That Track Indexes
As their titles suggest, both ETFs make money for investors by writing covered calls against an index. The prospectuses for both funds are very clear that these are passive ETFs. Their strategy is implemented automatically as they each track a different CBOE Buy Write index. These indexes automate call buying and selling and make no attempt to maximize the value of the options they buy.
Their prospectuses state,
The Index Provider determines the relative weightings of the securities in the Underlying Index and publishes information regarding the market value of the Underlying Index.
The Adviser uses a “passive” or indexing approach to try to achieve the Fund’s investment objective. Unlike many investment companies, the fund does not try to “outperform” the Underlying Index and does not seek temporary defensive positions when markets decline or appear overvalued.
According to its prospectus, QYLD invests at least 80% of its total assets in holdings that track the CBOE Nasdaq 100 Buy Write V2 index (BXNT). This index holds the stocks in the Nasdaq 100 index and sells a succession of one-month at-the-money NASDAQ-100 (NDX) call options and then redeems them the day before they expire.
The NASDAQ 100 index from which the Buy Write index derives holds the 100 largest cap stocks listed on the NASDAQ stock exchange. It is the index tracked by the Invesco QQQ ETF (QQQ).
According to its prospectus, RYLD invests at least 80% of its total assets in component securities of the CBOE Russell 2000 BuyWrite Index or in investments that have “economic characteristics that are substantially identical to the economic characteristics of such component securities.” The latter phrase appears to be fancy wording that means RYLD can invest in an ETF that tracks the Russell 2000 index rather than having to own shares of all the 2000 stocks in the index. This index sells “a succession of one-month at-the-money covered call options on the Reference Index.” These are RUT options and are held until expiration.
The Russell 2000 index is a small cap index. Its fact sheet tells us it currently holds stock in 2,018 stocks whose median market capitalization is $1.051 Billion.
Note that both ETFs’ prospectuses state, “The Fund’s 80% investment policy is non-fundamental and requires 60 days prior written notice to shareholders before it can be changed.” So if market conditions were to change significantly, the amount of stock held could change.
There Are Big Differences Between The Indexes These ETFs Track
The biggest difference for investors who are considering buying one or the other of these covered call ETFs is that the Nasdaq 100 is a mega cap index whose price action is dominated by the movements of its five largest stocks, which include Apple (AAPL), Microsoft (MSFT) Amazon (AMZN), Tesla (TSLA) and Alphabet (GOOG) (GOOGL). Together the top 10 stocks in the Nasdaq 100make up 54.83% of the value of the stock holdings in QYLD. Nine of them currently are what most of us think of as Tech stocks. The 10th is Costco (COST). However, there are many companies listed in the Nasdaq 100 that aren’t Tech companies, since the only qualification for being listed is that a company’s stock have been listed on the Nasdaq exchange.
In contrast, the Russell 2000 index is a market cap weighted index that holds shares in over 2,000 small cap stocks, the majority of which most investors have probably never heard of. Few of those stocks ever are blessed with coverage in the mainstream financial media.
Its top 10 holdings by weight as of March 31, 2022 were Ovintiv Inc. (OVV), AMC Entertainment Holdings Inc. Class A (AMC), Avis Budget Group Inc. (CAR), BJ’s Wholesale Club Holdings Inc. (BJ), and Chesapeake Energy Corp. (CHK), but its top holdings can change quickly, as unlike the situation with the Nasdaq 100, where a single stock, Apple, makes up 12.50% of the total value of the index, none of the most heavily weighted stocks in the Russell 2000 make up more than 0.5% of the total value of that index. Indeed, together its Top 10 stocks make up only 3.5% of its value.
With its far greater number of more equally weighted holdings the Russell 2000’s price is affected more strongly by the price movements of far more stocks than affect the Nasdaq 100. Over time, its stocks overall have not reached the kinds of dramatic highs that the tech mega stocks have in the Nasdaq 100 index, especially since the COVID-19 pandemic began and the price of the Russell 2000 index isn’t as prone to respond to news that affects a single stock as is the Nasdaq 100.
However, when there is economic uncertainty, the small caps stocks in the Russell 2000 typically decline more steeply than do the multinational Nasdaq 100 tech super stocks.
Neither QYLD or RYLD has been trading long enough to give investors a way of determining how either ETF would perform in a downturn that lasted more than a few months, or for that matter in a market that stayed flat for a prolonged period.
Because Of The Difference In The Size Of Their Indexes, These ETFs Differ In How They Hold The Underlying Stocks For Their Calls
To track its index, QYLD buys and sells shares of each of the 100 or so stocks that make up the Nasdaq 100. Sales of these stocks provide the cash needed to settle exercised calls at the end of each month.
RYLD does not hold any shares in the many individual stocks that make up the Russell 2000 index. Instead it buys and sells shares of the Vanguard Russell 2000 Index ETF (VTWO). Note that VTWO does not exactly mirror the Russell 2000. For example, as of March 31, 2022 it held shares in 2032 stocks while the Russell 2000’s fact sheet dated the same day lists only 2018. But it is “substantially identical” to that index for investment purposes and with only a 0.10% expense ratio, VTWO is far easier to buy and sell than 2018 individual stocks would be. Indeed, its holding of VTWO is the only stock holding in RYLD.
The Index Calls These ETFs Write Work Differently From The Calls Most Stockholders Write Against Their Stock Holdings
When an investor buys an ordinary call against a stock they hold, two things may happen. The price of the stock may not rise above the call strike price, in which case the call seller pockets the premium, or the price may rise above the strike price at some time during the life of the option. When it does, it can be exercised at a time of the call buyer’s choice and the call writer has to hand them their shares in the security on which they wrote the call.
The index options that QYLD and RYLD trade work slightly differently from those that retail investors are familiar with. They are European style options, not American style. As CBOE explains,
“With European-style exercise, there is no risk of early assignment such as for dividends and cash settlement means there is no unwanted delivery or assignment of shares.”
Since these options are written on indexes rather than on actual shares of stock, if the price of the index rises at the end of the option’s life the seller of the call must deliver cash, not shares.
The two covered call ETFs generate this cash by selling shares of their stock in the case of QYLD or shares of the VTWO ETF in the case of RYLD.
The options that these ETFs trade also differ in another way from the ones you might use if you were writing options against your own holding of QQQ or VTWO. That’s because they are jumbo sized options. CBOE tells us that the RUT options that RYLD buys,
… have a large notional size with $100 multiplier; approximately ten times larger than iShares Russell 2000 Index Fund (IWM) options. [emphasis mine] This may permit commissions cost savings based upon the number of contracts needed to attain the same notional exposure
The NDX options that QYLD buys also involve huge sums as Nasdaq tells us that they are written on the full value of the Nasdaq 100 Index. Nasdaq also offers two other Nasdaq 100 options, NQX and XND that let investors trade much smaller amounts as those options cover respectively, 1/5th of the total value of the full Nasdaq 100 and 1% of its value.
This tells you that these options are the ones traded by investment houses and billionaires looking to hedge very large holdings.
How Have These ETFs Performed?
Below you see a chart depicting the Total Return of both QYLD and RYLD along with the performance of the straightforward ETFs that track the indexes used for the stock portion of the covered call ETF’s underlying Buy Write indexes, QQQ and VTWO.
QYLD, QQQ, RYLD, VTWO 3 Year Total Return

Seeking Alpha
All in all, QYLD and RYLD haven’t done too poorly when we look at them with a Total Return perspective. They both lost less than the indexes they wrote options on did during the COVID-19 swoon. But as would be expected of call writing ETFs, neither QYLD or RYLD recovered anywhere near as well as did the basic indexes.
Of the two ETFs the Global X Russell 2000 Covered Call ETF (RYLD) has slightly outperformed the Global X Nasdaq 100 Covered Call ETF (QYLD) from a total return perspective.
Both ETFs NAVs Are Still Underwater for Buyers Who Bought And Held
The picture is quite different when we only look at price action.
QYLD, QQQ, RYLD, VTWO 3-Year Price Return
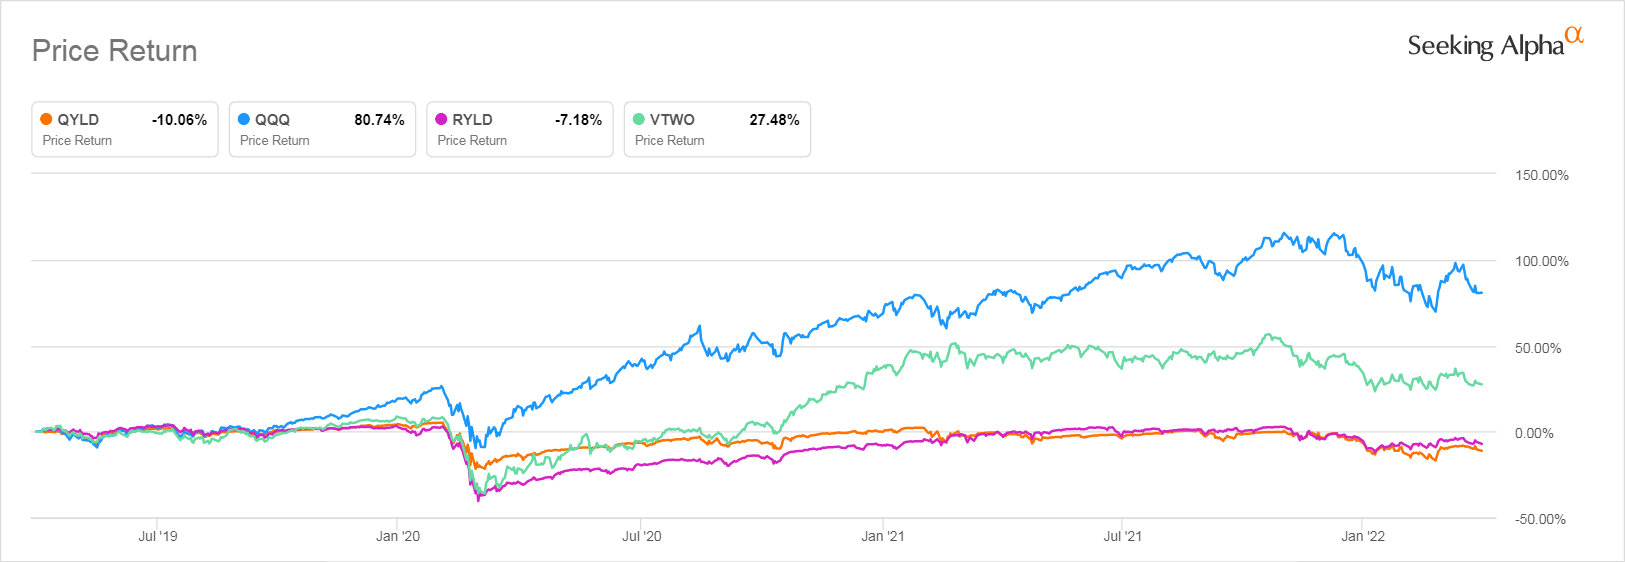
Seeking Alpha
Investors who bought into either of these two ETFs and spent their juicy double digit dividends now have less money to invest. They may be perfectly happy because they expect to continue getting those double digit dividends, even if their capital investment declines. But their actual gain over three years was only 16.96%, once their share price loss was deducted from their total return.
Contrast this with the return received by investors in a conventional dividend ETF, the Schwab U.S. Dividend Equity ETF (SCHD) over the same three-year period. Their price return over the same three years was 46.52%. Their total return was 61.88%. The gains they got during the market’s good years more than compensated for their declines in both 2020 and 2022.
That should make us ask how good a choice the “juicy” 12% dividends really were. Especially since there is no guarantee that either ETF will continue to pay those double digit dividends, or for that matter, any dividend at all.
A Deeper Look At QYLD And RYLD’s Dividends
Common Metrics Are Misleading
Seeking Alpha’s pages for these two ETFs treat their dividends the way they do those of all other ETFs. QYLD’s and RYLD’s dividends are given a Quant Score of A+ but this is very misleading.
That’s because the Quant scoring system rates dividends by comparing an ETFs dividends against those of other ETFs in the same asset class. Since the Quant system puts these two ETFs into the “Alternative” asset class, QYLD and RYLD’s dividends are being compared to long/short ETFs that don’t generally pay dividends and other oddball ETFs that may invest in who knows what.
Similarly, because of the way that QYLD and RYLD’s distributions are determined, it is meaningless to talk about dividend growth. These ETF’s distributions will fluctuate every month based on market conditions at the time, especially and whether the call option strategy is profitable or not and whether the ETF suffers losses on the sale of the securities it holds to cover those calls.
Forward yield, another metric that Seeking Alpha provides is also misleading, as there is no way of predicting the future yield of these ETFs.
What These ETFs Actually Distribute Each Month
The “dividends” distributed by these ETFs aren’t really dividends. Nor are they purely the proceeds from the covered calls written against the respective indexes. They are a mix of long and short term capital gains and return of capital.
A document titled, Global X Covered Call Tax Primer is helpful for understanding the unusual nature of these dividends. Buried in the document is an important statement that makes it clear that your distribution is not necessarily what you would get if you were to write call options on one of the indexes these ETFs write calls on. The document explains,
Return of capital arises because a fund’s distribution policy differs from the mix straddle approach. For example, for QYLD, the fund expects to distribute on a monthly basis one-half of the premiums received by writing calls on the Nasdaq 100, capped at 1% of the Fund’s net asset value (NAV). This distribution policy is designed to provide recurring income to investors based on the income generated by writing call options.
Most of the distributions investors will receive are expected to be a mixture of long- and short-term capital gains. The Tax Primer document lays out six different scenarios which would change how much of the dividend was long- or short-term gains.
Investors should pay close attention to these scenarios as they also tell you a lot about how you should expect both these ETFs to perform under different market conditions and the size of the distributions they may make under those different market conditions.
- During a market selloff where stocks lose value and the written call options modestly gain you would have a large short-term loss which would be balanced by a smaller gain from selling options. Overall effect: MILDER SHORT-TERM LOSS.
- In a market rally where stocks appreciate in value and the written call options modestly lose value, your gains from stock sales would be reduced losses from options being exercised. Overall effect: LESSER SHORT-TERM GAINS.
- In a gently downward market, where stocks settle lower and the written call options gain value, your options gains would be reduced by your stock losses and any remaining profits from the sales of options would be considered 60% long term and 40% short term. MILDER LT/ST LOSS
- In a slightly upward market, where stocks settle slightly higher and the written call options lose value, potentially with volatility increasing, your losses from options being exercised might not be completely erased from stock gains and your excess losses from options being exercised would be 60% long term and 40% short term. MILDER LT/ST LOSS
- In a modest market rally where volatility falls, causing both stocks and written call options to modestly gain value you would have mostly short term capital gains. LARGE SHORT-TERM GAINS
- In a modest market selloff where stocks lose value, and volatility increases, causing written call options to also lose value you would have some short-term capital gains but mostly long term capital gains. LARGE LONG-TERM GAINS
The tax document also tells us that dividends received by the covered call ETFs are not treated as qualified dividend income (QDI). They also tell us that though the distributions paid are a mix of capital gains and return of capital, they are reported on a 1099, not a K-1.
All this suggests if you are going to buy one of these ETFs you probably want to hold it in an IRA or other tax advantaged account.
How Will They Perform Going Forward?
The six scenarios laid out above give you a general idea of what kinds of net gains and losses you might experience with both these ETFs. Now we come to the question of which one you would expect to perform best if you were to invest in one of them now.
The answer depends on what kind of market you expect to see in the future. Reread the six scenarios above to see what the possibilities are for your returns.
We Can Learn From Past Performance That We Can’t Learn Much From Past Performance
The charts you saw earlier in this article show you how these ETFs have performed through the whole of the last three years, which represents almost all of their lifespan.
Now lets look at how these two ETFs performed in stressful periods.
The COVID-19 Swoon
The chart below shows you the total return during the period surrounding the COVID-19 lock downs of both QYLD and RYLD and ETFs that track the indexes they write covered calls on. That return includes the dividends paid.
QYLD, RYLD, QQQ, And VTWO Total Return Jan-June 2020
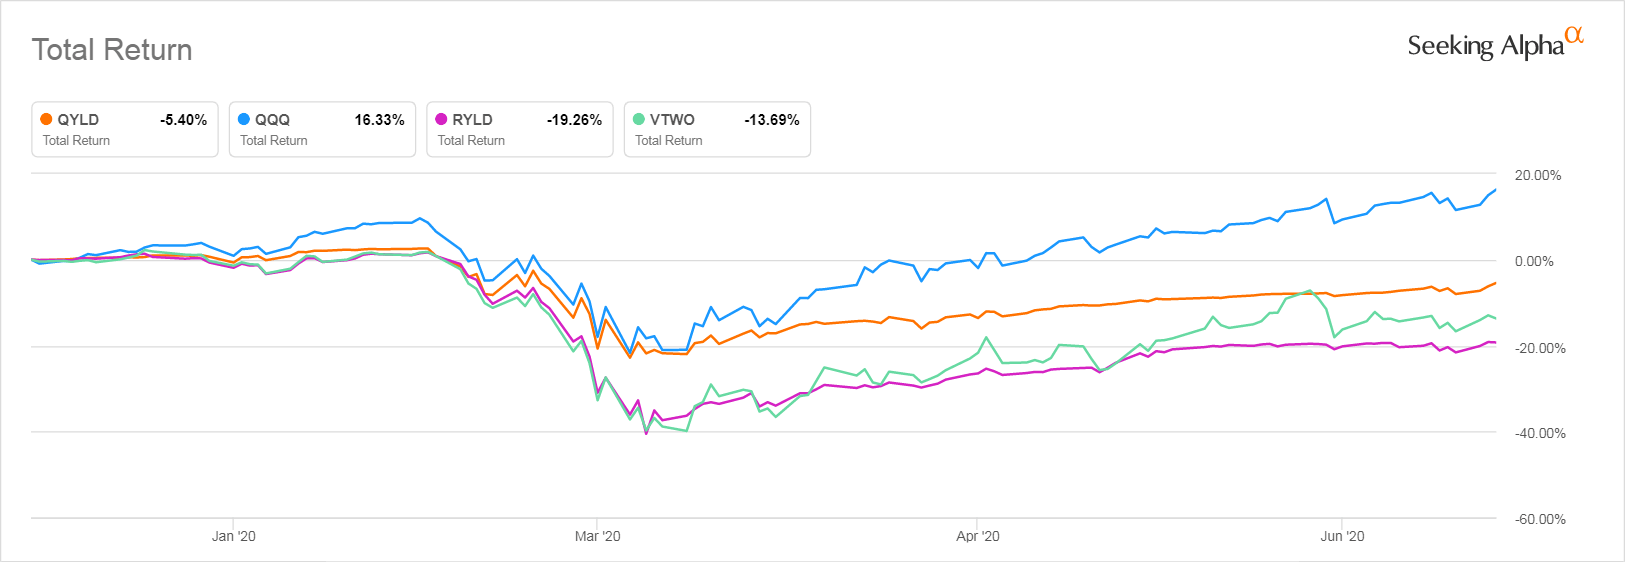
Seeking Alpha
As you can see, the Russell 2000 dropped much more dramatically in March of 2020 than did the mega cap Nasdaq 100. Writing Calls did not do much to cushion the loss in either index. What they did do was deprive investors of the gains that occurred when the underlying indexes began to recover.
Because the Nasdaq 100 recovered far more quickly than the Russell 2000, QYLD outperformed RYLD during this period, even with dividends included.
But both covered call ETFs would have left investors with painful losses had the market after June of 2020 not experienced the near-miraculous gains that followed the COVID-19 lockdown. And note that because of the relentless way that the market rose during the recovery in 2020, calls worked against investors. Their losses persisted even with dividends included as their calls tended to be exercised.
That was how these two ETFs compare under one set of stressors that can be described as a classic Black Swan
The Rising Interest Rate Correction Of 2022
But before you conclude that QYLD is a slightly better investment than RYLD, because its underlying index is more likely to hold up under difficult market conditions, take a look at how these two ETFs performed from January through February of this year, when interest rate fears caused the market as a whole to correct. That correction occurred much more gradually than did the one in March of 2020.
QYLD And RYLD Price Performance 1/1 – 2/28 2022 Correction
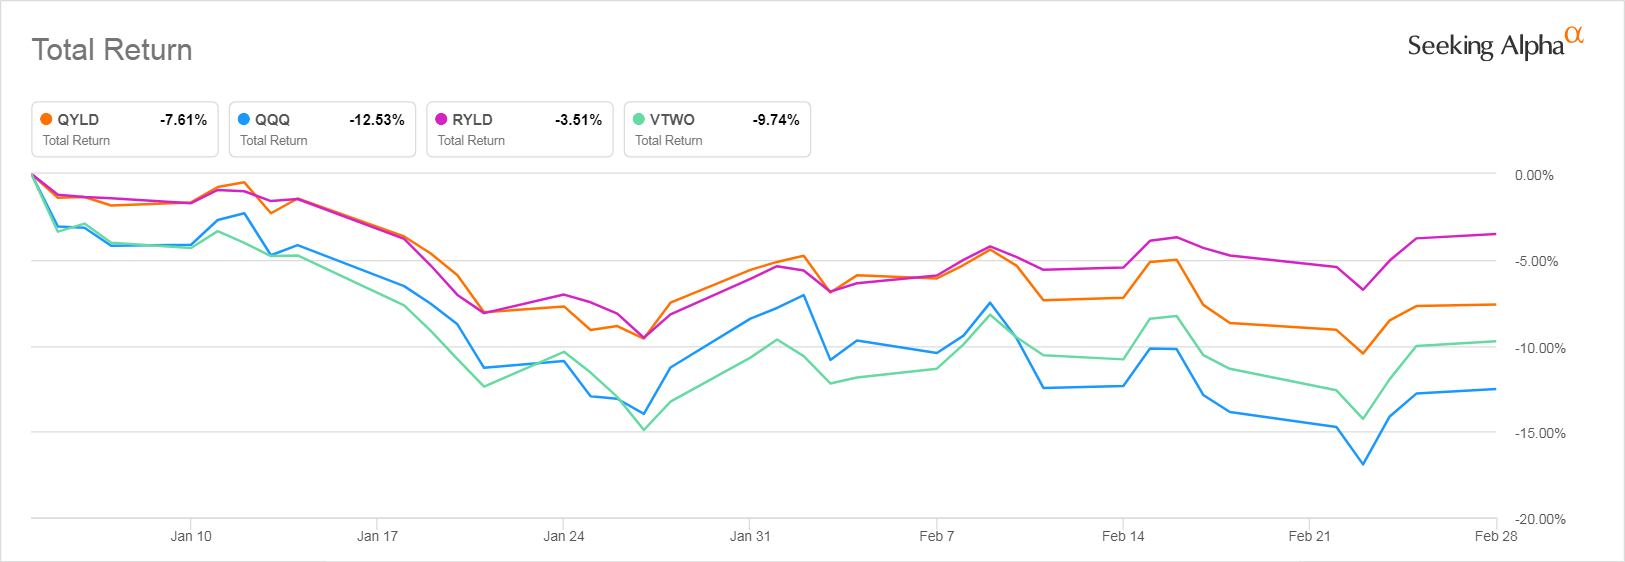
Seeking Alpha
Here we see that the Nasdaq 100, represented by QQQ, fell further than did the Russell 2000, represented by VTWO. This was partly due to investors taking profits from the QQQ stocks that had surged so much higher than did the Russell 2000’s small cap stocks during lockdown. Those QQQ investors then fled to cash, or to stocks that they perceived as having more value. The low P/E ratio of the Russell 2000 attracted investors who thought it signified better value. As a result, RYLD has outperformed QYLD in 2022.
The lesson to take from this review is that the performance of these ETFs is linked very tightly to that of their underlying indexes. To decide which one would be the better investment, you must think deeply about how you think those underlying indexes will perform going forward. But you also have to accept that there is no sure way to determine that.
Looking at how the Russell 2000 and the Nasdaq 100 performed over longer stretches of time may be misleading. The Nasdaq 100 of 20 years ago held shares in far younger, far smaller companies than it does now, when Apple, Alphabet, and Amazon have become dominant multinational companies with trillion dollar market caps. It is a brave investor who bets against its long term prospects. Meanwhile, the Russell 2000 has also changed.
Vanguard gives us some metrics for its Russell 2000 ETF that tell us that as of March 31, 2022, it had a composite P/E ratio of only 14.3. That looks like a very good value, until you notice that its low P/E ratio is partially explained by a very low Return on Equity of 6.9%.
When I have screened small cap stocks in the past I have seen a lot of stagnant companies, many with earnings decreasing. In the hot market of the past decade, appealing small cap companies have either been taken private or been acquired by bigger companies. The companies that remain small cap companies often have done so because they aren’t going anywhere any time soon.
RYLD’s small cap stocks might end up having more volatility than those of the Nasdaq 100. That can be good for investors who play options very wisely. But that volatility probably won’t do you much good in an ETF that buys and sells call options in an automated fashion the way both of these ETFs do.
If the economy goes into recession, even if the calls are profitable, the potential loss in RYLD’s underlying holding — shares of VTWO — could be severe. And once investor start to believe that the market is declining, they may be less prone to buy call options and that will make those options cheaper and far less profitable.
RYLD’s small AUM is another factor working against it. Its very recent popularity could easily reverse if market conditions don’t favor the Russell 2000 going forward. When small ETFs lose investors, they are often terminated. This can generate unpleasant taxable events if you hold the ETF in a taxable account.
Bottom Line
Don’t let the high distributions fool you. Both QYLD and RYLD give dividend investors less return in the good times and can deliver stinging losses in bad. They are both young ETFs that have done decently over a short time stretch but can’t guarantee safe returns for income investors if the bull market stalls or ends.
The apparently high income these ETFs generate does not make up for their ability to damage the capital you invest in them. If the market goes into one of the scenarios described above that result in losses both in call writing and in the value of the underlying indexes these ETFs invest in, you could end up seeing those dividends shrink dramatically, just as the NAV of the ETF experiences a painful drop.
When you invest in a more typical income ETF like SCHD, the upside you get when the market rises protects you to a large extent from the downturns that inevitably occur.
If you do want to invest in one of these covered call ETFs, QYLD is probably safer given the resilience of the Nasdaq 100 and the high quality of many of the companies that dominate its price action. But I’m not investing in either any time soon.
Be the first to comment