


Marc Dufresne/iStock Unreleased via Getty Images
It seems surprisingly persistent U.S. inflation has derailed the tentative revival of bullish sentiment. Cracks have become evident after the Jackson Hole symposium already, and when the August CPI data was published on September 13, the last signs of optimism evaporated completely. Bets on smaller interest rate hikes were dialed back, and the growth-heavy (hence, rate-sensitive and more exposed to the growth premia issue) S&P 500 bore the brunt.
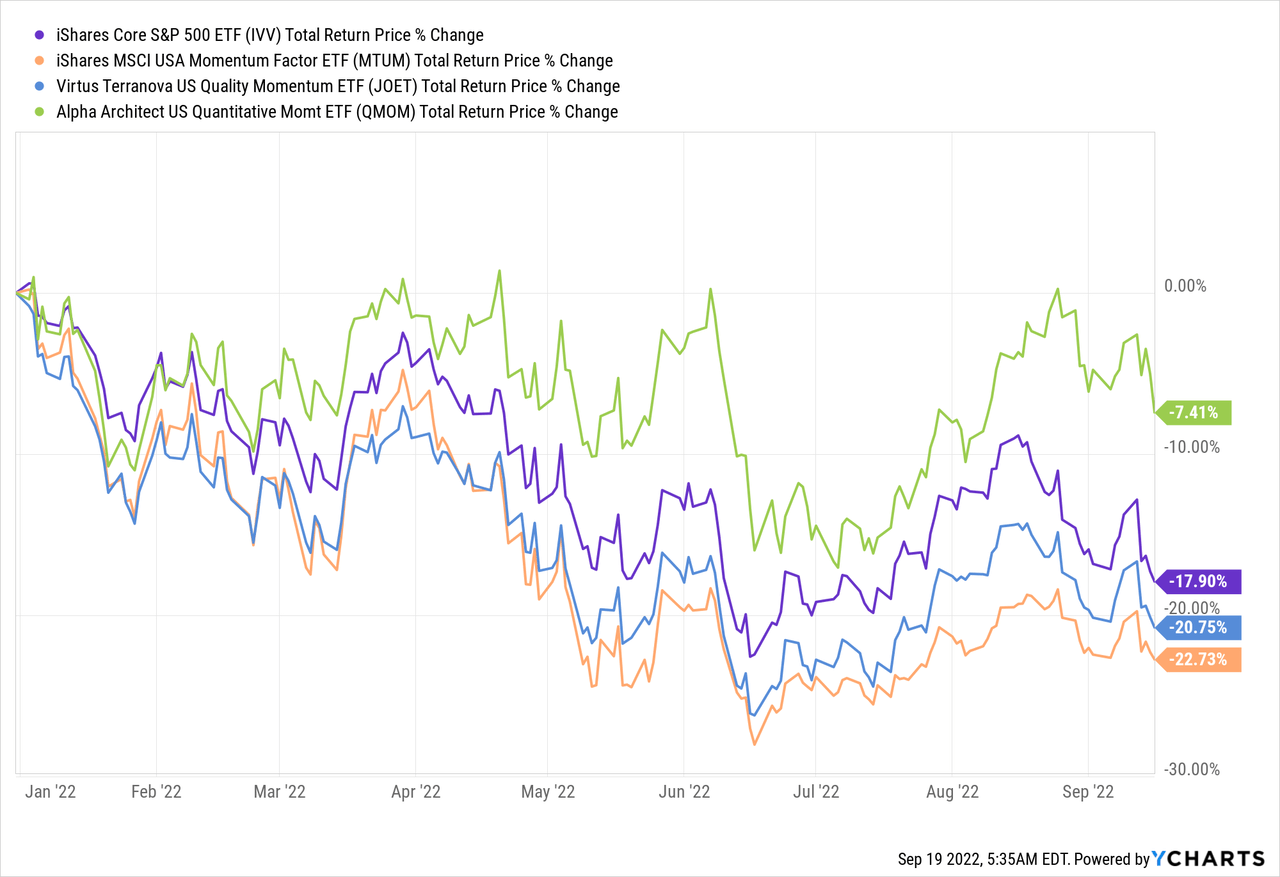
Though it seems an unresolvable task to find a corner of the market that survived tempestuous 2022 to date with omnipresent pressing issues comparatively unscathed, there are certain exchange-traded funds that fared much better than the iShares Core S&P 500 ETF (IVV). And not only those making opportunistic bearish bets.
An example worth mentioning is the Alpha Architect U.S. Quantitative Momentum ETF (BATS:QMOM), an actively managed investment vehicle providing exposure to a concentrated portfolio of between 50 and 100 U.S. equities carefully selected using the proprietary momentum factor. Incepted on 1 December 2015, the fund has attracted just around $97.3 million, though recent asset flows trends look overall encouraging.
QMOM has fared excellently this year (by the bear market standards, of course), declining by only ~7.4%. Meanwhile, its less picky but better diversified momentum-focused peer the iShares Edge MSCI USA Momentum Factor ETF (MTUM) is down by almost 21%, a dismal result even compared to IVV. Rather surprisingly, the passively-managed Virtus Terranova U.S. Quality Momentum ETF (JOET), a fund targeting momentum stocks without compromising on the balance sheet quality and capital efficiency, has also underperformed IVV.
So what is special about QMOM’s strategy except for the active approach? How did it manage to outperform IVV amid a broad investor retreat from equities (and even bonds)? And has it always been that successful?
First, as explained in the prospectus, QMOM begins with the universe of liquid U.S. exchange quoted stocks with market caps typically exceeding $1 billion.
As of September 19, QMOM had exposure to companies with market values in the $1.6 billion – $388.5 billion range, with the weighted average at ~$35.4 billion according to my estimates.
REITs, as well as ADRs, are shown the red light. It is unknown how exactly a stock’s exposure to the momentum factor is measured; it is briefly mentioned in the prospectus that 6-month and 9-month periods are assessed and that higher beta is perceived as a negative. The group that proceeded to step two is screened for “the highest cumulative return for the past 12 months, excluding the most recent month.” After that, “an ensemble of momentum quality screens” is used to assess the consistency of positive returns. The cohort of 50 to 100 stocks that met all the criteria are selected for the portfolio; it is said the rebalancing happens at least every quarter.
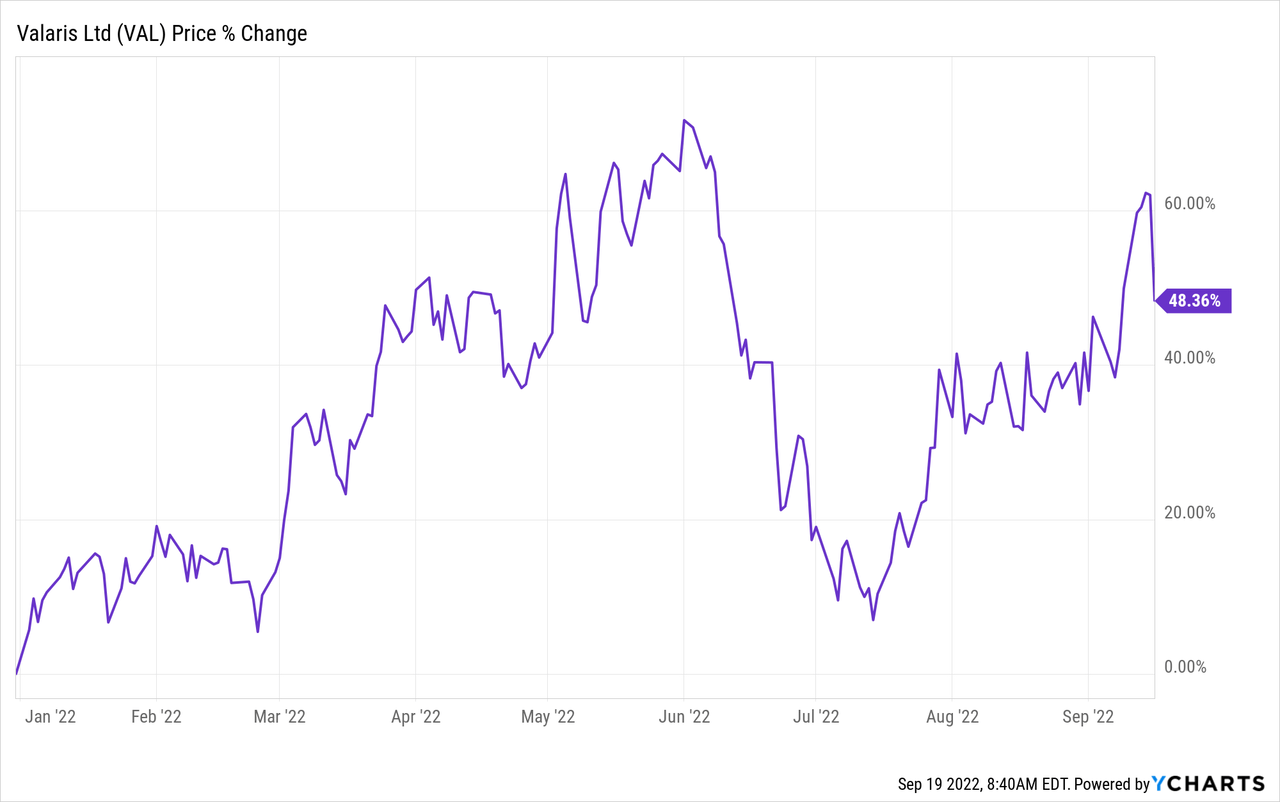
In the current iteration, we see 50 stocks, with Valaris Limited (VAL) as a primary holding sporting a 2.3% weight. Amid the oil price rally, the offshore contract drilling services provider has gained over 48% YTD and ~67% in the last twelve months.
Interestingly, even though it seems the fund does not target the profitability factor directly, its portfolio still has close to excellent quality. For example, it invested in just one EBITDA-negative company, namely iRhythm Technologies (IRTC), while around 81% of the portfolio has Quant Profitability grades of B- or higher.
When quality, a factor welcoming premium valuation, meets momentum, a high P/E equity mix is to be expected, to say the least. And what has surprised me here is the weighted-average Forward P/E, which comes at 12.6x, and the weighted-average EV/EBITDA multiple (which excludes two stocks from the financial sector) of around 11.8x, as of my calculations. IVV’s website shows a P/E of 19.17x.
This is a value territory, no doubt. On the downside, screening the portfolio for stocks with at least a B- Quant Valuation grade, I found that just around 24% of the net assets are deployed to such names, while close to 48% look comparatively overpriced (D+ or worse); in a still hawkish environment, this is a risk not to ignore.
It should also be noted that QMOM’s equity mix is fluid, and so does its sector allocation and exposure to underpriced/overpriced equities. At certain junctures, a few GICS sectors could even be absent. For example, the data saved by the Wayback Machine illustrate that as of March 11, 2022, the fund had exposure to 10 sectors out of 11, ignoring communication services; the energy sector was in the top spot with close to 24% weight, followed by industrials with 19.6%. Now, it is still overweight energy, but with a much larger allocation, over 47%. Industrials are no longer in the top trio, now with just ~6%, replaced by healthcare with 16.7%. One communication stock has finally qualified, but all the real estate sector plays were removed.
So in sum, the low-teens forward P/E and LTM EV/EBITDA are a direct consequence of the energy sector dominating the mix and should not be perceived as something permanent.
Above, we raised the question of whether QMOM’s strategy was similarly successful in the past as it has been this year. Unfortunately, QMOM’s outperformance was rare.
If we look at the table compiling the key performance metrics for most of its trading history (excluding December 2015), we will notice it struggled to keep pace with IVV, even despite its way stronger 2022. It also marginally underperformed MTUM, which had higher returns in the pre-Covid era, yet has been more afflicted this year owing to its greater sensitivity to the growth premia issue. Other points to dislike are higher standard deviation and lower risk-adjusted returns.
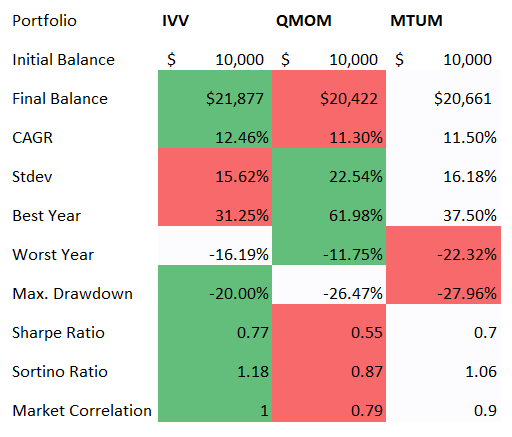
Created by the author using data from Portfolio Visualizer
Another table adds a bit more color, comparing monthly and yearly returns of QMOM and the bellwether ETF.
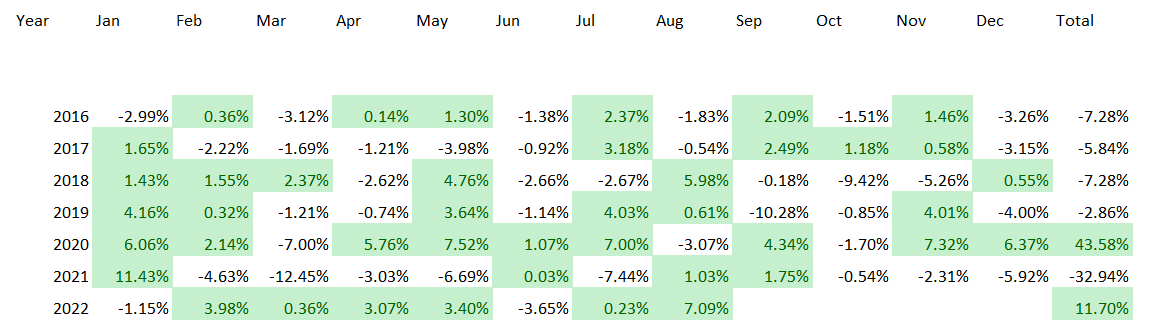
Created by the author using data from Portfolio Visualizer
As we can see, QMOM is a rare example of a momentum fund that beat IVV in the pandemic-torn 2020, which was especially remarkable for the dovish narrative, and in hawkish 2022. MTUM, for instance, reaped benefits of the pandemic rally capitalizing on the tech growth echelon and accommodative monetary policy, yet it lagged IVV in 2021 and especially in 2022.
Please also do note that QMOM became actively managed after 31 January 2022; before that, it tracked the Alpha Architect U.S. Quantitative Momentum Index, based on rules similar to its current strategy.
Final thoughts
QMOM leverages a proprietary quality momentum strategy, with a comparatively concentrated portfolio tilted toward high-quality large caps in the current version. An actively managed fund, it has an adequate expense ratio of 49 bps.
QMOM’s strategy undergirded around 62% total return in 2020, as well as immunized it from a decline similar to IVV this year, correctly identifying the stars of the 2022 market – the energy sector stocks, mostly from the exploration & production industry.
The issue we see here is that it was unable to beat IVV consistently in the past, finishing way behind it for four years in a row since inception, also failing to adapt to the capital rotation of 2021; a higher standard deviation compared to the S&P 500 fund and much weaker drawdowns are also to dislike. In this regard, a Hold rating is justified.
Be the first to comment