

Pgiam/iStock via Getty Images
After the six-month, 20%-plus market decline, bearish exchange-traded funds (“ETFs”) have become very popular. One of the best fund families for this is the ProShare group, with assets of $65 billion. They have 54 inverse ETFs designed to move opposite specific market indexes or sectors. They go up when markets decline. Thirty-one of these go short some American stock or market sector index.
List of 31 American Short Proshare ETFs (Michael McDonald)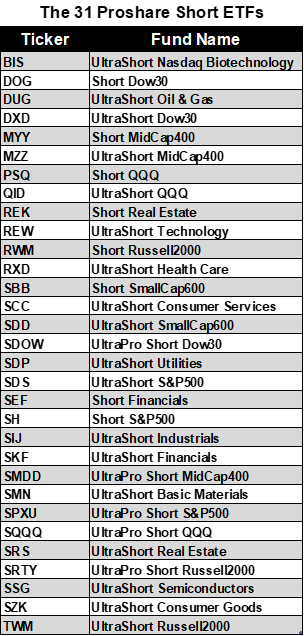
At the beginning of 2022, 7.9% of ProShare assets were in these 31 American, short ETFs. This ratio has now risen to 20%. Many would think this natural and not bother with it. However, a market technician, thinking of contrary opinion, would be alerted.
Total Assets in the 31 Bearish ETFs (Michael McDonald)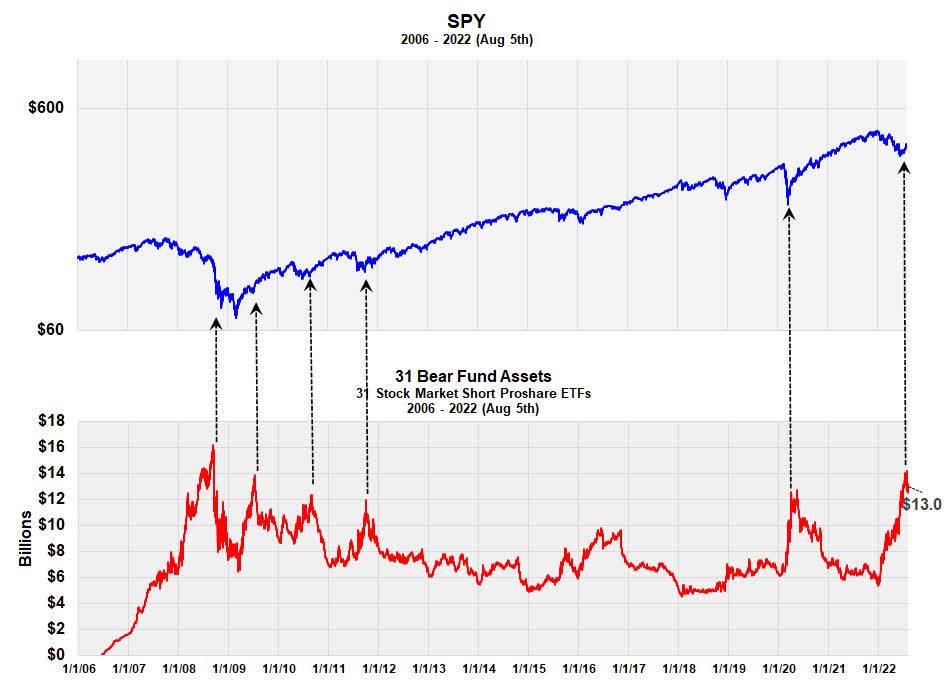
This graph shows total dollar assets in the 31 short Proshare ETFs. Notice that current assets of $13 billion exceed the level at the COVID 2020 bear market low and are approaching levels at the lows of the great bear market of 2008-09. Although not our primary contrary opinion indicator, this asset chart does suggest we’re at a critical, long term, market low. However, we feel a better indicator is one that measures total investor buying of these 31 ETFs.
Prior Research
In July, we wrote two SA articles (here and here) saying the level of buying of four, short Proshare ETFs – (SH), (PSQ), (DOG), and (SQQQ) – indicated we were at a major bear market low. We now present a new indicator based on all 31 short ETFs that we feel replaces the odd lot and total short selling indicators so popular in the 1960s, 70s and 80s.
Let me explain.
Short-Selling Indicators
During the heyday of technical analysis from 1960 to 1985, the best indicators of bear market bottoms were the odd lot and public short selling ratios. They were based on the “theory of contrary opinion,” the theory that says stock prices reach bottom when most investors are bearish and expecting further price declines. Periods of heavy investor short selling historically indicated these moments. After correctly signaling the bear market bottoms of 1962, 1966, 1970 and 1974, with no false signals in between, these short selling ratios became the primary tools of market technicians in that era when looking for the end of a bear market.
Unfortunately, with the emergence of index futures and arbitrage short selling in the mid-1980s, these short selling indicators became useless, as it became impossible to distinguish arbitrage short selling from short selling because of the expectation of lower prices. Very few market technicians today know this important history, but those who were around in the 1970s do.
Recreating Short Selling Indicators using Bear Market ETFs
This situation changed around 2007 with the creation of bearish ETFs. These funds made it possible to again measure investor “short selling.” In this instance, however, investors weren’t short selling directly but were buying ETFs that were. Once these funds were established, it was only necessary for the occurrence of a few bear markets to establish the levels of investor buying that represented extreme levels of bearishness and market lows. We now have that history; a history that includes both the 2007-09 bear market and the extreme market decline of 2020.
The Method
How do you measure investor buying in bearish ETFs? Looking at daily dollar sales like one does any stock is insufficient, since it doesn’t specify how much is from investor buying. With stocks, sales do represent the amount of buying, since buying and selling amounts are always equal. But with ETFs, they aren’t. If there are more buyers than sellers of an ETF, the fund creates more shares for the excess buyers. If there are more sellers than buyers, they retire the excess shares.
So, sales numbers alone don’t tell you how much money is going into or out of an ETF; you must combine sales with changes in the number of shares outstanding to determine that. Once this is done, multiplying the number of shares being purchased by the fund’s NAV yields how much money is going to each of the 31 ETFs on a daily basis. These are then summed, and a 20-day moving average is calculated to reduce random statistical variation.
Daily Purchase Rates in the 31 Short Proshare ETFs (Michael McDonald)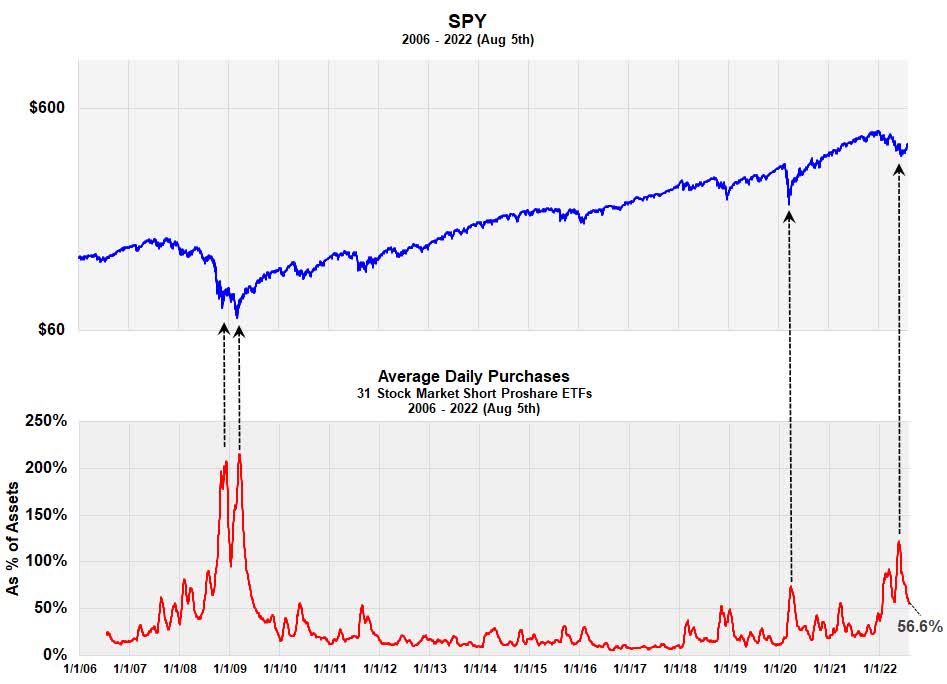
Measuring the dollar amount going into all 31 funds is not the best measure, however. What’s better is dividing this dollar amount by total assets in the 31 funds. That is what’s graphed above in red. Producing a ratio allows for historical comparisons; absolute values don’t. Making a ratio or percent is similar to the old short-selling indicators of the past, where the amount of short selling was divided by the amount of total selling.
Conclusion
As the chart clearly shows, the ratio of purchases to total assets in June reached its highest level since the bear market of 2008 and 09. With the stock market rally, the ratio has fallen to 56.6% of assets. This is still in the highest 10% of purchase rates since 2006. Although the June purchase levels did not reach those of the great bear market, we believe it went high enough to signal the end of this bear market.
We believe this because we think the historic ratios in 2008 and 09 are a little distorted. These bearish ETFs were started only two years prior and hadn’t attracted enough interest or assets by the time the great bear market started. This caused the ratio of purchases to assets to go higher than they would’ve had the ETFs been around longer.
Be the first to comment