

Michael M. Santiago/Getty Images News
By Rob Isbitts.
Summary
Pacer Trendpilot 100 ETF (NASDAQ:PTNQ) is based on a great risk-management concept. But it has a fatal flaw in its execution.
The PTNQ exchange-traded fund (“ETF”) is a hedged version of the Nasdaq 100 Index (NDX), and uses the 200-Day Simple Moving Average of that index to shift into defense mode when markets get rough. That sounds great, right? But the 200-Day Simple Moving Average is not as reliable an indicator than it used to be. That was quite obvious in early 2020. At that time, PTNQ missed its opportunity to shelter its investors from one of the worst market shocks in history. The ETF has done better in declining markets since then, but we think the basic risk-management mechanism makes PTNQ unattractive. We rate it a Sell.
Strategy
Pacer Trendpilot™ 100 ETF takes a unique approach to investing in the NASDAQ-100® Total Return IndexSM (which investors are likely familar with through the popular Invesco QQQ ETF, symbol QQQ). This approach is known in some corners of the investment world as a “systematic trend-following strategy.”
PTNQ is always invested in one of three ways: 100% in the Nasdaq 100, 50% in the Nasdaq 100 and 50% in 3-Month US T-Bills, or 100% in US T-Bills. That decision is automated, as this is an index ETF, not an actively-managed fund.
Which version of the strategy is in place at any point in time depends on the position of the Nasdaq 100 versus its 200 Day Simple Moving Average, which is considered by technical analysts to be a primary indicator of long-term stock market direction and valuation. There is also an “Extreme Valuation Trigger,” which, according to Pacer, the manager of PTNQ, works like this:
“If at close of business the (Nasdaq 100) Index is either 20% above or 20% below its 200 Day SMA, the exposure will automatically go to the 50/50 position. The Index will reset to the normal rules when the normal 50/50 Indicator is triggered from above the SMA or the Equity Indicator is triggered from below the SMA.”
Proprietary ETF Grades
-
Offense/Defense: Offense
-
Segment: Tactical
-
Sub-Segment: Trend-Following
-
Correlation (vs. S&P 500): High
-
Expected Volatility (vs. S&P 500): Low.
Holding Analysis
As noted above, the portfolio for PTNQ is either the stocks in the Nasdaq 100 Index, 3-Month U.S. T-Bills, or a mix of those two. The current holdings list shows more than 100 stocks, so that implies that there is no index replication going on here. They own all 100 stocks, plus any spinoffs or other holdings that are temporarily members of that index.
Strengths
PTNQ is a straightforward, risk-managed approach to volatile part of the stock market. The Nasdaq 100 has soared since the end of the Global Financial Crisis. In fact, from the end of 2009 through the end of 2021, the index appreciated by 875%. That’s not a misprint! So, having an ETF that can pursue the upside of that index, without catching a chunk of a downside, is one of the better investment concepts to risk-managed investors like us.
Weaknesses
Unfortunately, there’s a “but” coming. PTNQ has a great idea in concept. However, its fatal flaw is that it uses the 200-Day Simple Moving Average. Frankly, using any moving average as an automated decision-maker is not only less effective than in decades past, it can deliver the exact opposite trading signals than were intended.
For decades, there were classic technical indicators that worked very consistently. They were never perfectly accurate because nothing in investing it. However, they were strong investment decision-making inputs, and they represented what all investors hope to find: an edge.
However, the information age, plus the surge in interest in investing over the years, has created a situation where many indicators, technical and otherwise, are not as reliable as they once were. For instance, the 200-Day Moving Average turned into a “self-fulfilling prophesy.” That is, so many people were looking at, it was bound to take the next step in the evolution of so many investment methods that worked when they were relatively unknown: they get too popular, then big money players figure out a way to exploit that popularity. The edge is gone, except for those who were able to stay a step ahead.
The result for funds like PTNQ is a risk that the fancy back-tests used to promote the ETF in marketing material are prone to break when trying to operate in modern markets. They don’t break every time, but in 2020, this ETF’s main method of providing that “edge” to its shareholders failed. And, it failed miserably.
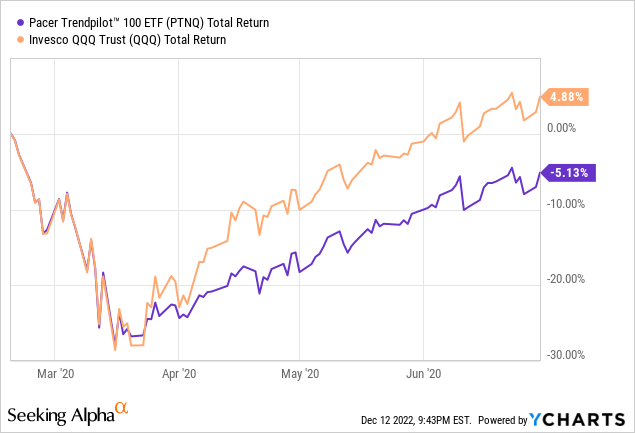
As you can see During the 5-week, 28% crash for the Nasdaq as the Covid pandemic shocked the stock market, PTNQ, with its automated 200-Day Simple Moving Average signal, moved down the Nasdaq 100, step for step. Why? Because neither of the risk-off signals triggered! That 200-day SMA was 20% above the price of the Nasdaq 100 when the market peaked. And it price of the Nasdaq 100 fell so quickly, the SMA was way behind. Mathematically and thus financially, it was the worst-case scenario for PTNQ. But actually, it got worse still. The opposite problem occurred on the way back up. As a result, PTNQ spend much of 2020 producing the opposite of what many might have expected. It lost money when the Nasdaq was up.
To Pacer’s credit, they made an adjustment. Look up at the last paragraph of the Strategy section of this report. That 20% feature was added to the process right after the 2000 mess. That’s helpful, but it still seems arbitrary and more like a band-aid. It is why we believe that as strong as any automated investment strategy is, end-decisions for portfolio management should still be made by humans. Anyone who just sat back and relied on Pacer’s process to handle that “tail risk” situation was hung out to dry, so to speak.
Opportunities
In many market environments, PTNQ can be a useful risk-management tool. This is particularly the case with T-Bill rates having rocketed higher in 2022. If one views this ETF as a way to invest in the Nasdaq 100 during good times, but wants a “just in case” hedging mechanism that is fully-transparent, it is here.
Threats
Oh, but PTNQ has that history, and it is hard (for us, at least) to un-see what we saw during 2020. And it begs the question, what other unique market price gyrations are out there that could come around for the first time, and given PTNQ shareholders a big, unwanted surprise?
Proprietary Technical Ratings
-
Short-Term Rating (next 3 months): Sell
-
Long-Term Rating (next 12 months): Hold
Conclusions
ETF Quality Opinion
Our concerns are more with these types of systematic strategies than with Pacer itself. Still, that firm has built many products around similar automated signals. So, our bottom-line is to consider the obvious benefits, but also the tail-risk situation discussed at length above.
ETF Investment Opinion
We rate Pacer Trendpilot 100 ETF a Sell. But we are a professional investment firm that uses technical indicators extensively in our research and portfolio model work. For an investor looking to identify a potential Nasdaq-100 ETF with the added potential to shed some of the downside risk, this is a consideration. Just know what you are getting, and that automatic investment signal strategies are not always as ideal or easy as they appear to be.
Be the first to comment