

cemagraphics
This article was first released to Systematic Income subscribers and free trials on June 28.
The current market environment presents an unusually uncertain picture for income investors. This is why, in our view, it makes sense to have some exposure to securities that feature decent quality at a margin-of-safety valuation. In this article we highlight the Cohen & Steers Tax-Advantaged Preferred Securities & Income Fund (NYSE:PTA), trading at a 12.2% discount and a 8.4% current yield. In addition to ticking these boxes, PTA has fixed most of its borrowing costs at an unusually low level in a period where borrowing costs for the majority of fixed-income funds are rising rapidly.
An Uncertain Environment
The only thing we know with any certainty is that short-term rates will continue to move significantly higher – the Fed policy rate is expected to top out around 3.6% from the current 1.5-1.75% level which we can see in the below dot plot.
Bloomberg
We also know that the macro picture has softened considerably in just the last couple of months due to the tightening of financial conditions and, which are all but certain, will tighten further as the Fed does its job. We can see this drop in the macro picture in the Atlanta Fed GDP nowcast shown below.
Atlanta Fed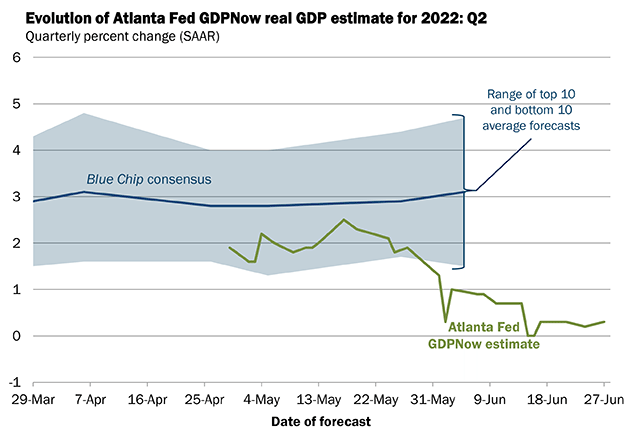
In this kind of environment, we think investors should find some room in a diversified income portfolio for a preferred fund like PTA. Within the broader fixed-income umbrella, PTA features a decent-quality profile, holding preferreds of primarily investment-grade household-name issuers.
Cohen & Steers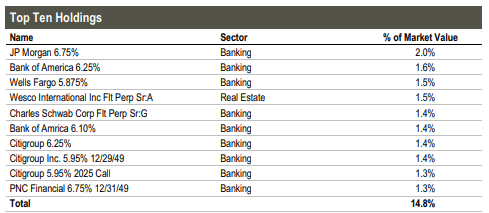
The fund’s preferred portfolio itself is about a third investment-grade with more than half allocated to securities rated BB+ (i.e., the highest sub-investment-grade rating) and above.
Cohen & Steers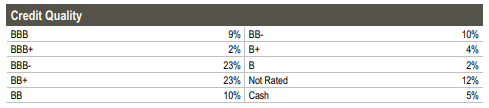
The fund trades at the widest discount in the sector – about 8% wider than the sector average, despite modest outperformance year-to-date.
Systematic Income Preferreds Tool
In the sections below we discuss in more detail why holding some higher-quality preferred exposure makes sense and why PTA looks attractive within its sector. Overall, our approach to the preferreds sector is to identify attractive fund families at any given time. Once identified, we tilt to the most attractive fund in that fund family.
Why Preferred CEFs
In our view, preferred securities are attractive components of income portfolios for a few reasons. First, their yields are trading not far from a decade high as the chart below shows.
UBS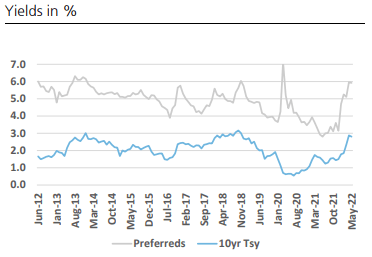
Two, preferreds, particularly as held by most CEFs, tend to be higher-quality than the more traditional “credit” assets such as high-yield corporate bonds and loans. For instance, the median rating for preferred CEF holdings is roughly BB+, i.e., the highest “junk” rating. This is actually not all that far from the median investment-grade rating and well above the median high-yield bond and loan rating.
Three, preferred securities tend to feature a high duration. This can be viewed as a liability in the current market given what has happened to Treasury yields. However, our view is that taking some duration risk at current valuations is much more attractive than it was in 2021. Other indicators of compensation for duration risk, apart from nominal Treasury yields, such as real yields and the term premium are all at pretty attractive levels.
FRED
Four, the preferreds sector is overweight Banks – something which can also be seen as a liability for investors who went through the GFC. However, bank capital buffers are much stronger than they were during the GFC as the following chart shows. The fact that no one really worried about banks during the COVID drawdown is a testament to their overall resilience.
BIS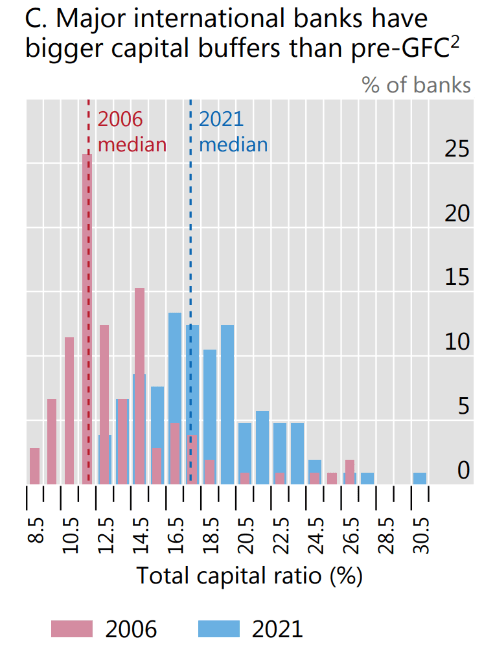
Why Cohen-Steers Funds Look Attractive Here
The reason we view the Cohen and Steers preferreds funds positively has to do primarily with their leverage resilience as well as their duration and borrowing cost hedge.
By leverage resilience we mean that a given fund does not deleverage as quickly as other funds in the sector. Because fixed-income markets tend to be fairly mean-reverting (over varying timeframes), funds that deleverage more readily tend to lock in economic losses for investors, in effect, selling low and buying back high. This topic is one we documented a number of times in the preferreds sector. The short of it is that the Nuveen and First Trust funds tend to deleverage fairly quickly while the Flaherty and Cohen funds try to avoid deleveraging.
The main reason for this is simple – Nuveen and First Trust funds have leverage caps (38% and 40% respectively) while Flaherty and Cohen funds don’t. What tends to happen is that over a drawdown-and-reversal period, Nuveen and First Trust funds tend to lag as they deleverage (i.e., sell assets) on the way down and try to catch up (i.e., buy back) on the way up. This normalized total NAV return chart over the COVID drawdown shows the Nuveen and First Trust fund lagged the other fund families due to their deleveraging in this period.
Systematic Income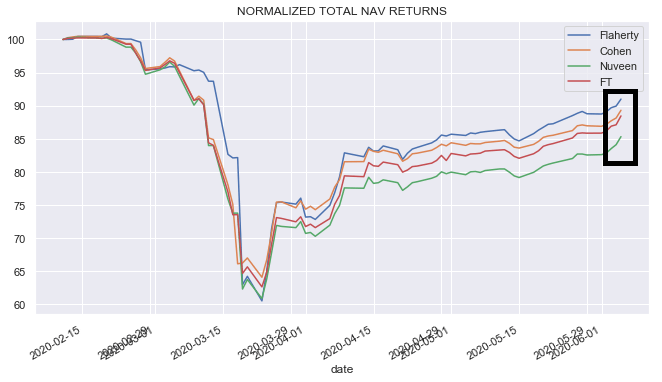
Obviously, it goes without saying that a big enough drop in asset prices (e.g., something akin to a GFC drop in preferreds when iShares Preferred and Income Securities ETF (PFF) had a 70% drawdown) will cause all funds to deleverage but for “polite” drawdowns such as what we saw during the COVID period should allow Flaherty and Cohen funds to outperform.
A quick look at the level of borrowings shows that First Trust Intermediate Duration Preferred & Income Fund (FPF) has been deleveraging for some time, starting even (weirdly) in December.
Systematic Income Preferreds Tool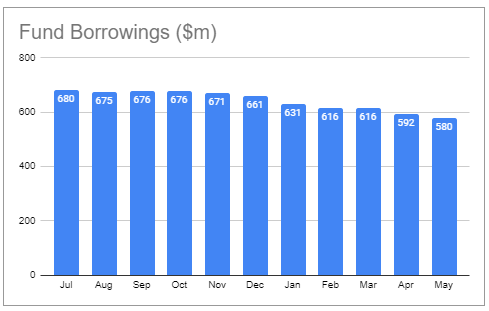
The Nuveen Preferred & Income Securities Fund (JPS) started to deleverage in February and kept going. Three of the four Nuveen funds have deleveraged this year.
Systematic Income Preferreds Tool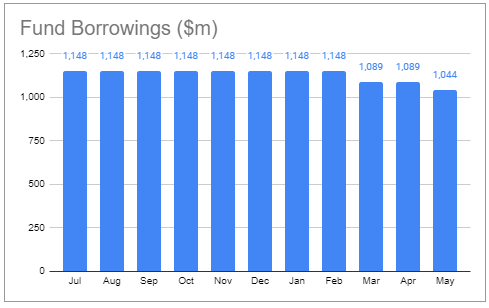
The second reason we like the Cohen funds here is due to their hedging profile. Specifically, the Cohen funds along with Nuveen funds hedge their duration (i.e., interest rate sensitivity) and hedge leverage costs (a pay-fixed interest rate swap does both at the same time).
On the duration side we show the empirical duration metric below which shows the implied duration of the given fund relative to 10Y Treasuries. We wouldn’t focus as much on the absolute numbers as on the relative numbers which show that the Cohen funds are less sensitive to changes in interest rates.
Systematic Income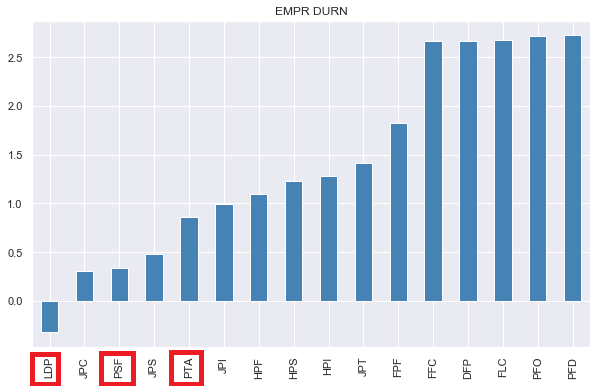
The more interesting aspect here is the leverage cost angle. To illustrate what’s going on, let’s compare PTA to a fund that is identical to it but doesn’t do any hedging. PTA (left-hand chart below) has fixed 85% of its leverage cost at an unusually low rate of just 1.2% (with the remaining 15% set to 1-Month Libor + 0.8%) over the next 4.5 years. We assume a portfolio yield of 6.5% which is what the preferreds market yield-to-worst was at the time of writing.
Systematic Income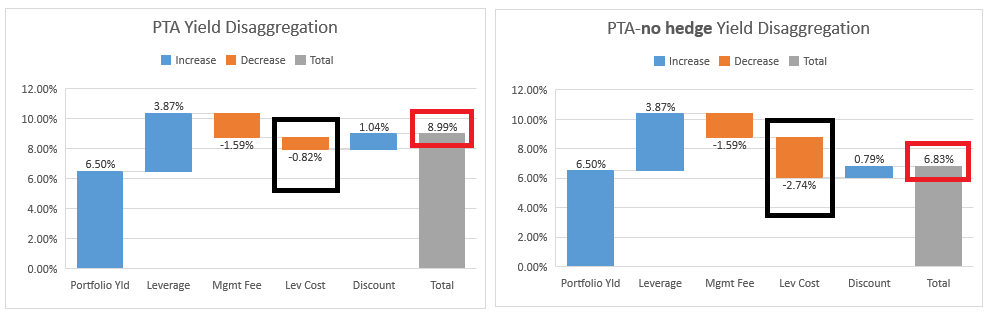
With the Fed expecting to take its policy rate to 3.8%, according to the June dot plot, the leverage cost of the non-hedging version of PTA (right-hand chart below) will have a leverage cost of 4.6% (i.e., 1-Month Libor of 3.8% + 0.8%). The impact of this is that PTA will be able to generate a net income yield of 8.99% or 2.5% above its portfolio yield of 6.5% while the non-hedging fund will only be able to generate a net yield of 6.83% or just 0.33% above its portfolio yield.
Overall, the way we would summarize this section is to say that Flaherty and Cohen funds give you leverage resilience while Nuveen and Cohen funds give you leverage cost hedging. In short, only the Cohen funds give you leverage resilience and leverage cost hedging.
Mind you, these two features are not desirable in all market environments. This is because in a stable market environment leverage resilience is fine but not critical (because the likelihood of a 20-30% drop in the market is unlikely until it has happened) and hedging leverage cost can be more expensive than not hedging (such as when short-term rates are near zero). However, the current environment of having gone through a sharp drawdown and short-term rates rising is a combination when the features of the Cohen funds are actually very useful.
Why We Like PTA In The Cohen Suite
The two key aspects we focus on in selecting within the suite of a fund family is the fund’s allocation profile and its income profile.
The allocation profile of the three funds is not identical, but it’s not hugely different. All three funds have a credit rating profile of 66-72% in securities rated BB and above. All three are overweight Banks (54-60%). All three are overweight U.S. securities (52-64%). Perhaps the biggest difference is in the retail preferred allocation with PTA having the largest at 26% versus 14% and 9% for the other 2 funds.
Overall, this hasn’t made a ton of difference to the performance of the three funds since 2021 (PTA launched in late 2020). Cohen&Steers Limited Duration Preferred&Income Fund (LDP) has outperformed by about 1% per annum since then, however that has only happened in the last few months – we suspect due to its slightly lower duration profile (which is literally in the name of the fund).
Systematic Income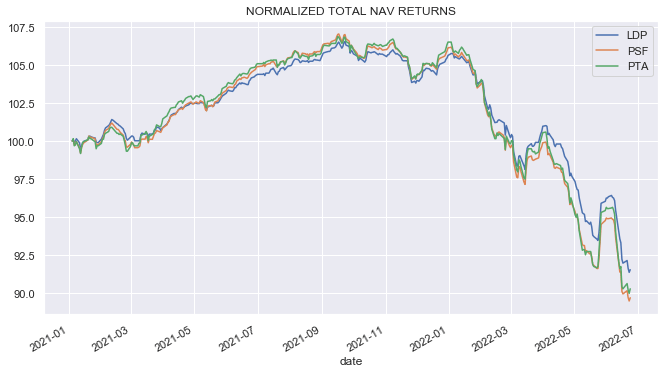
In short, the allocation differences do exist but they are not where we have particularly strong views. Where the real action is, in our view, is in the income profile.
The funds’ income profile is a function of their valuation and features. The key features in our view is that PTA has a 1% management fee while the other two funds have a 0.7% fee. However, PTA has fixed 85% of its leverage cost at just 1.2% versus 1.7% for the other two funds. PTA also has a slightly higher leverage than the other two funds. Plus, PTA trades at a slightly wider discount than LDP and a significantly wider discount than PTA.
A lot of investors get hung up on discounts, but they are just part of the puzzle. What we need to do is line everything up on an apples-to-apples basis and see how the CEF income sausage factory looks.
LDP and Cohen & Steers Select Preferred and Income Fund, Inc. (PSF) are quite similar to each other – they have the same management fee, similar leverage level and the same leverage cost so we pick LDP to go up against PTA given LDP is trading at a significantly wider discount than PSF.
This is how the net yield picture stacks up between the two funds. We assume a portfolio yield of 6.5% – again, we don’t need to get this exactly right since what we are after is a relative picture between the two funds.
Systematic Income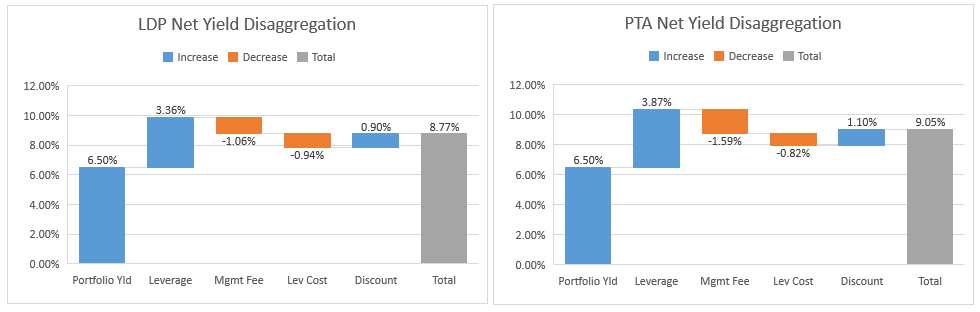
PTA generates a bit more additional yield due to its slightly higher leverage level. LDP has a lower yield drag of 1.06% (versus 1.59% for PTA) due to its lower management fee. PTA, as expected, has a lower leverage cost and also generates more yield due to its slightly wider discount. Net net PTA comes out ahead by a higher net yield of 0.28% which is the reason why it’s our pick in the suite at the moment. Outside of the Cohen suite, we estimate PTA to have the highest net yield in the sector due to its wide discount and low leverage cost.
Takeaways
We expect the macro and market environment to remain highly uncertain, at the very least until inflation convincingly peaks and begins to descend. This is why we view decent-quality fixed-income assets such as preferreds worth an allocation in diversified income portfolios. In addition, the margin-of-safety valuation of PTA as well as its mostly fixed and low leverage cost profile will allow it to maintain its income level at a stable and high level in the sector.
Be the first to comment