

Lemon_tm
Written by Nick Ackerman, co-produced by Stanford Chemist. This article was originally published to members of the CEF/ETF Income Laboratory on June 29th, 2022.
Cohen & Steers Tax-Advantaged Preferred Securities & Income Fund (NYSE:PTA) launched near the end of 2020. The fund enjoyed the continuing rebound of investments after the COVID pandemic. However, with interest rates rising, the fund began to fall considerably. The drop has been quite quick, but it isn’t alone, as equities and fixed-income more broadly have fallen quite sharply.
In the case of PTA, the fund’s share price has fallen much more rapidly than the actual underlying net asset value. For CEFs, that is when opportunities open up.
YCharts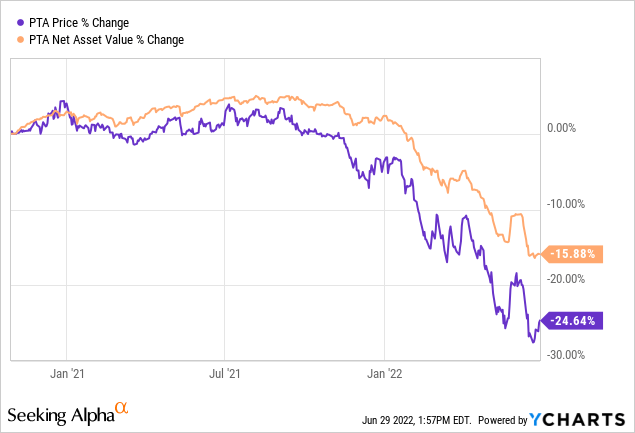
The above chart shows the price and NAV change percentage only. This isn’t factoring in the significant amount of distributions the fund has already paid during this time.
The fund’s latest report was also quite encouraging, with net investment income [NII] increasing. The fund’s total investment income rose due to the higher interest income generated on the portfolio.
Some of the increase was offset by higher interest expenses on their leverage. That being said, the fund’s interest expense due to its leverage also is largely fixed due to interest rate swaps. That means it could present a better opportunity than other preferred CEFs, where the leverage will be at the mercy of higher rates. That should also keep its net investment income relatively more stable going forward.
In connection with its use of leverage, the Fund pays interest on a portion of its borrowings based on a floating rate under the terms of its credit agreement. To reduce the impact that an increase in interest rates could have on the performance of the Fund with respect to these borrowings, the Fund used interest rate swaps to exchange a portion of the floating rate for a fixed rate. The Fund’s use of swaps contributed significantly to the Fund’s total return for the six-month period ended April 30, 2022.
Equities and fixed-income investments could fall further. However, it appears that PTA is an attractive value for a longer-term investor at this time.
The Basics
- 1-Year Z-score: -1.44
- Discount: 10.75%
- Distribution Yield: 8.31%
- Expense Ratio: 1.64%
- Leverage: 35.78%
- Managed Assets: $1.9 billion
- Structure: Term (anticipated liquidation date is October 27th, 2032)
PTA’s investment objective is quite simple, “high current income.” They also have a secondary objective that is similarly as simple, “capital appreciation.”
To achieve this, they will invest “at least 80% of its managed assets in a portfolio of preferred and other income securities issued by U.S. and non-U.S. companies, which may be either exchange-traded or available over-the-counter.” They also will “seek to achieve favorable after-tax returns for its shareholders by seeking to minimize the U.S. federal income tax consequences on income generated by the Fund.”
The fund’s objective in this regard to minimize taxes naturally occurs with preferred dividends. They generally account as qualified dividends. In addition, the fund’s leverage might seem a bit elevated here relative to other CEFs. However, for the sector, it is quite common. Preferreds are generally safer investments compared to their common stock counterparts. Therefore, ramping up leverage isn’t going to be usually as detrimental. It is certainly something to watch, though.
We touched on it above, but to reiterate, the majority of the fund’s leverage is fixed. This is still around 85% of the leverage and locked in at an average rate of 1.4% for the next four years.
PTA Semi-Annual Report (Cohen & Steers)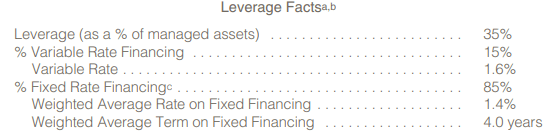
That might be a bit higher than what other funds are paying at this time, but those costs are rising as interest rates rise. That being said, this fund is quite highly leveraged at this time. That is a significant risk that should be considered before investing. The problem is that they’ve borrowed around $690 million. That figure hasn’t changed much, but the declines in the fund mean that the percentage goes up anyway.
When including the fund’s leverage expenses, the expense ratio comes to 2.17%.
Performance – Attractive Discount
Since the fund launched, it has come up a bit shy in terms of total return NAV performance relative to some other preferred comparisons. One fund we can compare is from Flaherty & Crumrine. This fund sponsor has consistently been one of the best-performing sponsors in the preferred CEF space. So we will include Flaherty & Crumrine Preferred and Income Securities Fund (FFC) below. We will also use the passive iShares Preferred and Income Securities ETF (PFF) as a non-leveraged comparison.
YCharts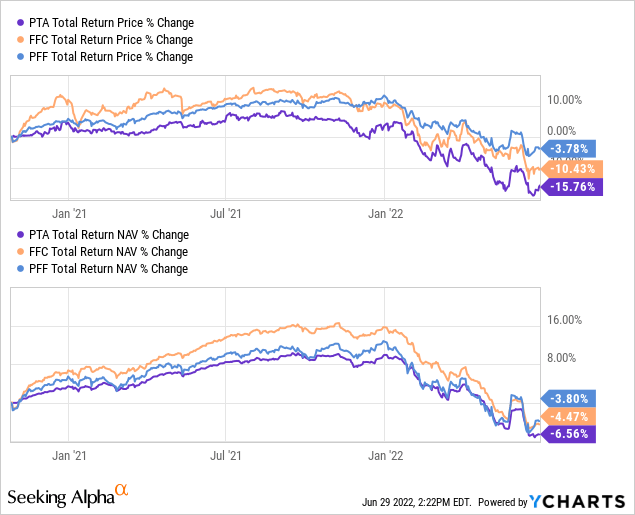
One of the most obvious points to note is that PFF, on a total share price return basis, has easily outperformed both. Both PTA and FFC have fallen due to the wildly swinging discount/premium mechanic in CEFs. On the other hand, PTA also underperformed on a total NAV return basis. While that isn’t what we generally want to see, it wasn’t to such a large degree that I wouldn’t consider the fund. After all, it is about the performance going forward and not really the past.
Where PTA might be able to perform better going forward is if they can gain some traction and reduce the fund’s discount. At this point, it’s much closer valued to its low point than its high. It is also firmly below its average. However, that’s less of a meaningful metric due to the relatively reduced history.
YCharts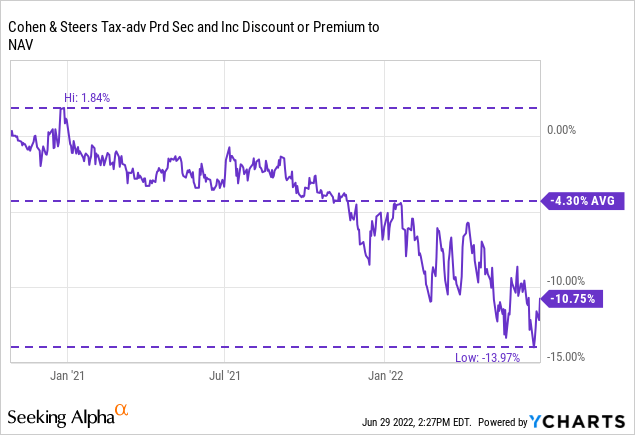
When looking at their own blended benchmarks that they picked, they have outperformed during the latest reporting period.
PTA Benchmark Performance For Period (Cohen & Steers)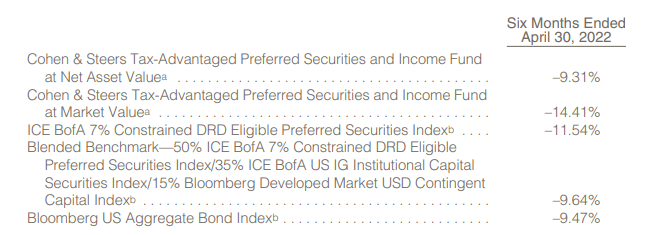
Distribution – Coverage Improves, But Isn’t Comfortable Yet
The fund launched with a payout of $0.13 per month. That currently works out to a distribution yield of 8.31%. On a NAV basis, it’s a bit lower at 7.42%. We even saw a special paid-out in 2021. The Q3 2022 distributions for the months of July, August, and September will also continue at the monthly $0.13 being delivered.
PTA Distribution History (CEFConnect)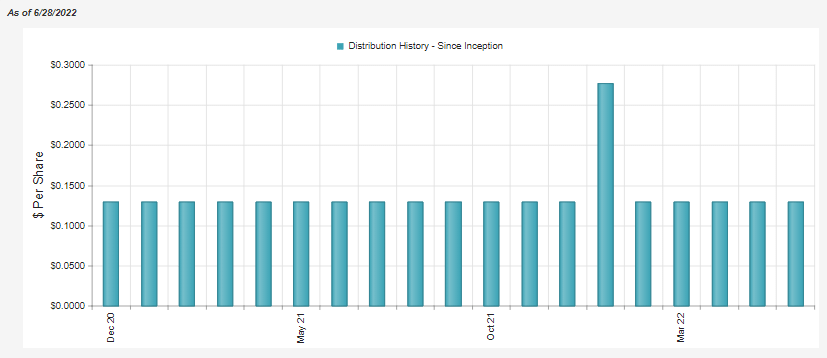
The increase in NII for the fund is nice to see. However, the coverage isn’t exactly in a comfortable range yet, in my opinion. That’s why the continuation of the same distribution is also nice to see, but I wouldn’t necessarily have been overly surprised to see a cut. The sister funds, Cohen & Steers Select Preferred and Income Fund (PSF) and Cohen & Steers Limited Duration Preferred & Income Fund (LDP), they already cut heading into this year. That was after each had also paid a special at the end of last year.
YCharts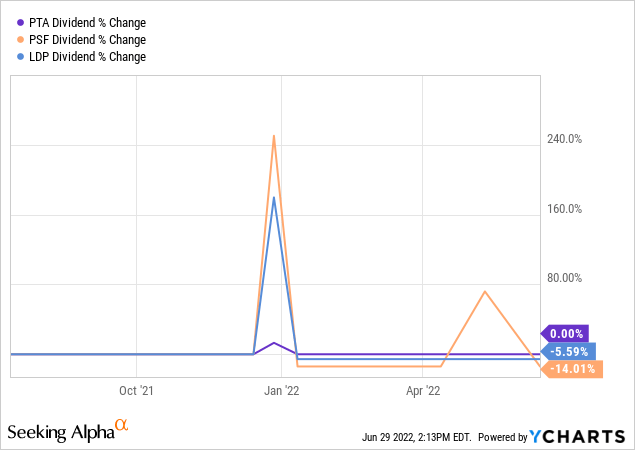
As interest rates head higher, the spread between their borrowings and the yields they can invest in goes up. So that’s another benefit of higher interest rates for the fund. I believe we’ve seen this play out to some extent as the fund’s investment income has already moved higher. At the same time, it’s hard to pinpoint exactly because the fund is actively managed. That means they are going to be constantly turning over their portfolio.
PTA Semi-Annual Report (Cohen & Steers)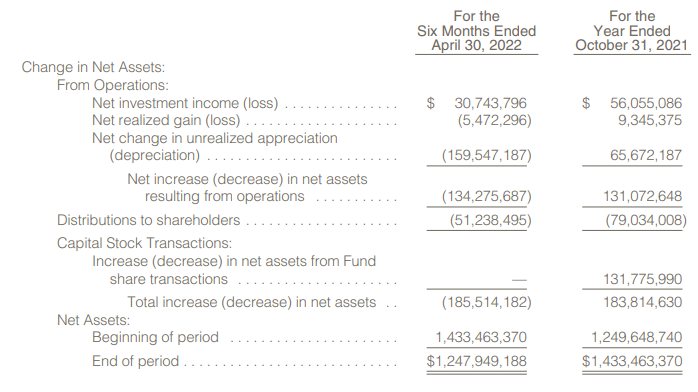
During the Semi-Annual Report from a year ago, they had reported around $26.134 million NII. The interest expense went from about $2.45 million to $3.632 million. However, the total investment income climbing to $45.390 million from $39.458 million improved the NII generation of the fund.
When factoring out the special that the fund paid, a year at the current distribution rate would require $86.227 million for shareholders. Even if we take the six-month figure and times it by two to get the equivalent period, coverage would come to around 71.3%. In the current environment, it wouldn’t seem that they’d be able to generate capital gains to offset this easily. Therefore, coverage is weak, but it was still positive to see NII improve.
For tax purposes, most of the distribution was considered qualified dividends. That’s what we would expect from a preferred fund, in general.
Cohen & Steers Tax Breakdown (Cohen & Steers)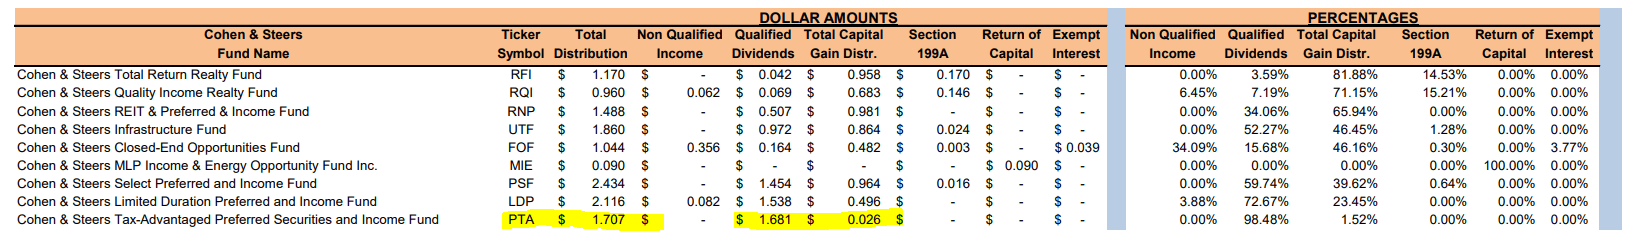
PTA’s Portfolio
Looking at PTA’s portfolio, we see that most of the preferreds are in the financial space (banking, insurance, and finance.) This isn’t that uncommon.
PTA Sector Weightings (Cohen & Steers)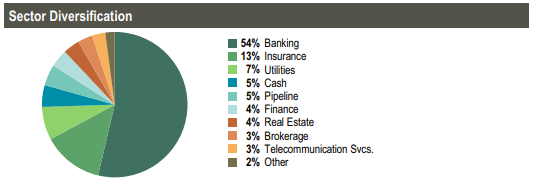
We also see that the portfolio is overweight in U.S. allocations. At the same time, it also leaves quite a bit of exposure outside the U.S. That can help add some further diversification to the fund. Flexibility can be a good thing for investors.
PTA Geographic Exposure (Cohen & Steers)
One important metric in the portfolio that they don’t share outright is what portion of the portfolio is fixed to floating. They don’t list this metric from anywhere that I could see. That being said, if you go through their portfolio, they have a considerable number of holdings with “b” after the name with the footnote “Security converts to floating rate after the indicated fixed-rate coupon period.”
Here’s a sample portion of the listing of holdings as an example.
PTA Holdings (Cohen & Steers)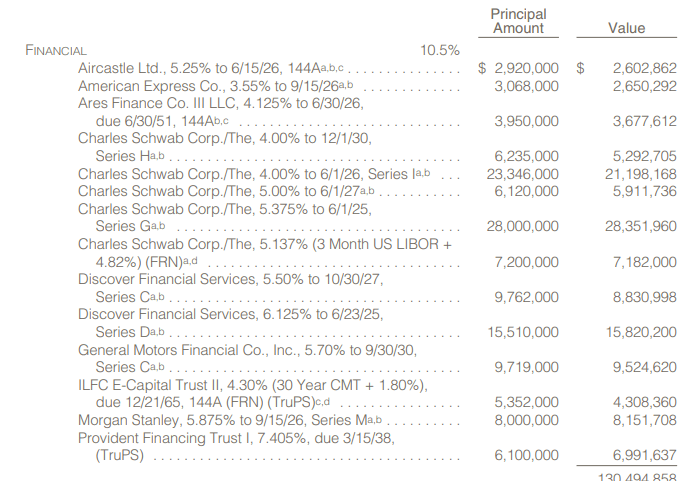
As we can see, just about every position is a fixed-to-floating position. Two of them that aren’t on this list are already variable rates; “Rate shown is in effect at April 30, 2022.”
That leaves the Provident Financing Trust I, 7.405%, due 3/15/38, as the only position of this sample that isn’t variable and never will be variable.
So while the actual figure isn’t provided for shareholders, I would be pretty comfortable saying, at minimum, 70 to 80% of the portfolio will be variable or is already.
That doesn’t mean we immediately see higher income necessarily because rates are rising. The fixed-to-floating is just that; they have a period where they are fixed before going floating. With hundreds of holdings in PTA, it will take place over the next several years to a decade even.
Conclusion
PTA has been beaten up along with the rest of the preferred space (and basically most of the broader market.) The fund’s discount has expanded quite rapidly. When we last touched on the fund, it was at a 6.28% discount. This has now climbed to over 10% and even expanded out to almost 14% recently. Though, valuations across the board have come down in terms of discounts/premiums from CEFs. If interest rates continue to rise rapidly, PTA could be better positioned with most of their leverage being fixed rate compared to other peers.
Be the first to comment