

Athitat Shinagowin/iStock via Getty Images
Earnings of Provident Financial Services Inc. (NYSE:PFS) will most probably dip this year on the back of higher provisioning for expected loan losses amid a heightened interest-rate environment. On the other hand, decent loan growth and slight margin expansion will likely support the bottom line. Overall, I’m expecting Provident Financial to report earnings of $2.04 per share for 2022, down 7% year-over-year. The year-end target price suggests a small upside from the current market price. Based on the total expected return, I’m maintaining a buy rating on Provident Financial Services.
Pipelines, Strong Job Markets Signal a Continuation of Loan Growth
The management mentioned in the first quarter’s conference call that its pipelines remained healthy at around $1.4 billion at the end of the first quarter. Therefore, it’s safe to assume that loan growth must’ve remained robust during the second quarter. To put the pipeline amount in perspective, $1.4 billion is 14% of the loans outstanding at the end of March.
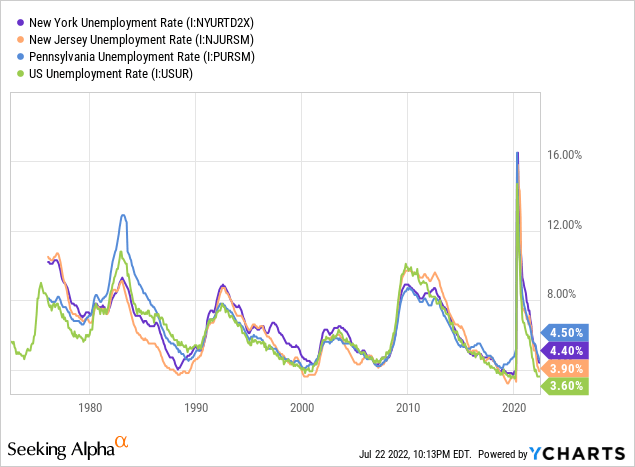
The management was positive about maintaining strong loan growth throughout 2022, as mentioned in the conference call. Given the strong regional job markets, the management’s target appears achievable. Provident Financial operates in New York, New Jersey, and Pennsylvania. All three states have worse job markets than the national average, but they’re still doing extremely well from a historical perspective.
However, the anticipated interest rate trend is likely to drag down loan growth. The Federal Reserve projects interest rates to peak later this year or next year. As a result, customers whose borrowing requirements are not time sensitive may want to postpone their borrowing plans till late next year.
Overall, I’m expecting the loan portfolio to grow by 2.3% in the last nine months of 2022 leading to full-year loan growth of 3.2%. Meanwhile, other balance sheet items will likely grow more or less in line with loans for the last nine months of 2022. The following table shows my balance sheet estimates.
| FY17 | FY18 | FY19 | FY20 | FY21 | FY22E | ||
| Financial Position | |||||||
| Net Loans | 7,266 | 7,195 | 7,277 | 9,721 | 9,501 | 9,804 | |
| Growth of Net Loans | 4.7% | (1.0)% | 1.1% | 33.6% | (2.3)% | 3.2% | |
| Other Earning Assets | 1,567 | 1,600 | 1,487 | 1,745 | 2,736 | 2,681 | |
| Deposits | 6,714 | 6,830 | 7,103 | 9,838 | 11,234 | 11,624 | |
| Borrowings and Sub-Debt | 1,743 | 1,442 | 1,125 | 1,210 | 671 | 460 | |
| Common equity | 1,299 | 1,359 | 1,414 | 1,620 | 1,697 | 1,678 | |
| Book Value Per Share ($) | 20.1 | 20.9 | 21.8 | 21.1 | 22.2 | 22.1 | |
| Tangible BVPS ($) | 13.6 | 14.5 | 15.1 | 15.0 | 16.1 | 16.0 | |
|
Source: SEC Filings, Author’s Estimates (In USD million unless otherwise specified) |
|||||||
Deposit Mix is Poorly Positioned for Rate Hikes
Provident Financial Services’ deposit mix is not conducive to a rising interest-rate environment. This is because deposits that re-price quickly make up an overwhelming majority of total deposits. Savings, negotiated order of withdrawal (“NOW”), and money market accounts made up a whopping 69.3% of total deposits at the end of March 2022.
However, due to excess liquidity in the banking industry, banks currently have greater-than-usual pricing power when it comes to deposits. Therefore, there’s a good chance Provident Financial will be able to constrain its deposit costs despite the frequent re-pricing. The management also mentioned in the conference call that the overall deposit beta is only 23%, which is quite low. (Deposit beta of 23% means that every hundred basis points rise in rates could increase the average deposit cost by only 23 basis points.)
The management’s interest-rate sensitivity analysis shows that the net interest margin’s sensitivity to interest rate hikes is moderate-to-low. According to the results of the analysis, a 200-basis points hike could boost the net interest income by only 3.3% over twelve months, as mentioned in the first quarter’s 10-Q filing.
1Q 2022 10-Q Filing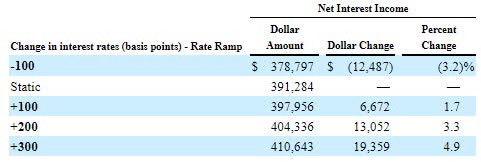
Considering these factors, I’m expecting the margin to grow by 18 basis points in the last nine months of 2022 from 3.02% in the first quarter of the year.
Higher Provision Expense to Result in an Earnings Decline
As mentioned in the conference call, Provident Financial relies on Moody’s U.S. baseline forecast to determine the provisioning needed for expected loan losses. In July, Moody’s revised lower its GDP growth estimates for 2022 and 2023, as mentioned in its latest report. This downward revision is partly attributable to the interest rate trend. Due to Moody’s baseline forecast revision, it’s very likely that Provident Financial will significantly increase its provisioning for the remainder of the year. Further, the anticipated loan additions discussed above will require further provisioning for expected loan losses.
Overall, I’m expecting the provisioning expense to be slightly above normal for the last three quarters of 2022. I’m expecting Provident Financial to report a net provision expense of 0.18% of total loans in 2022. In comparison, the net provision expense averaged 0.13% of total loans in the last five years.
Expecting Earnings to Dip by 7%
The anticipated growth in provisioning expenses will likely be the chief contributor to an earnings decline this year. On the other hand, decent loan growth and margin expansion will likely support the bottom line. Overall, I’m expecting Provident Financial to report earnings of $2.04 per share for 2022, down 7% year-over-year.
The company is scheduled to announce its second quarter’s results on July 29, 2022. I’m expecting Provident Financial to report earnings of $0.50 per share for the quarter. The following table shows my income statement estimates for the full year.
| FY17 | FY18 | FY19 | FY20 | FY21 | FY22E | ||
| Income Statement | |||||||
| Net interest income | 278 | 301 | 298 | 313 | 366 | 394 | |
| Provision for loan losses | 6 | 24 | 13 | 30 | (24) | 18 | |
| Non-interest income | 56 | 59 | 64 | 72 | 87 | 86 | |
| Non-interest expense | 188 | 192 | 202 | 228 | 250 | 255 | |
| Net income – Common Sh. | 94 | 118 | 113 | 97 | 168 | 155 | |
| EPS – Diluted ($) | 1.45 | 1.82 | 1.74 | 1.39 | 2.19 | 2.04 | |
|
Source: SEC Filings, Earnings Releases, Author’s Estimates (In USD million unless otherwise specified) |
|||||||
In my last report on Provident Financial, I estimated earnings of $1.91 per share for 2022. I have increased my earnings estimate because I’ve tweaked all income statement line items a little bit. The variance in the earnings estimates is not attributable to any main factor.
Actual earnings may differ materially from estimates because of the risks and uncertainties related to inflation, and consequently the timing and magnitude of interest rate hikes. Further, the threat of a recession can increase the provisioning for expected loan losses beyond my expectation. The new Omicron subvariant also bears monitoring.
Maintaining a Buy Rating Due to Decent Total Expected Return
Provident Financial is offering a dividend yield of 4.1% at the current quarterly dividend rate of $0.24 per share. The earnings and dividend estimates suggest a payout ratio of 47% for 2022, which is below the five-year average of 56%. Despite the room for a dividend hike, I haven’t incorporated any dividend change in my investment thesis to stay on the safe side.
I’m using the historical price-to-tangible book (“P/TB”) and price-to-earnings (“P/E”) multiples to value Provident Financial. The stock has traded at an average P/TB ratio of 1.48 in the past, as shown below.
| FY18 | FY19 | FY20 | FY21 | Average | ||
| T. Book Value per Share ($) | 14.5 | 15.1 | 15.0 | 16.1 | ||
| Average Market Price ($) | 25.9 | 25.1 | 15.6 | 22.8 | ||
| Historical P/TB | 1.79x | 1.66x | 1.04x | 1.42x | 1.48x | |
| Source: Company Financials, Yahoo Finance, Author’s Estimates | ||||||
Multiplying the average P/TB multiple with the forecast tangible book value per share of $16.0 gives a target price of $23.6 for the end of 2022. This price target implies a 2.0% upside from the July 22 closing price. The following table shows the sensitivity of the target price to the P/TB ratio.
| P/TB Multiple | 1.28x | 1.38x | 1.48x | 1.58x | 1.68x |
| TBVPS – Dec 2022 ($) | 16.0 | 16.0 | 16.0 | 16.0 | 16.0 |
| Target Price ($) | 20.4 | 22.0 | 23.6 | 25.2 | 26.8 |
| Market Price ($) | 23.2 | 23.2 | 23.2 | 23.2 | 23.2 |
| Upside/(Downside) | (11.8)% | (4.9)% | 2.0% | 8.8% | 15.7% |
| Source: Author’s Estimates |
The stock has traded at an average P/E ratio of around 12.6x in the past, as shown below.
| FY18 | FY19 | FY20 | FY21 | Average | ||
| Earnings per Share ($) | 1.82 | 1.74 | 1.39 | 2.19 | ||
| Average Market Price ($) | 25.9 | 25.1 | 15.6 | 22.8 | ||
| Historical P/E | 14.3x | 14.4x | 11.2x | 10.4x | 12.6x | |
| Source: Company Financials, Yahoo Finance, Author’s Estimates | ||||||
Multiplying the average P/E multiple with the forecast earnings per share of $2.04 gives a target price of $25.7 for the end of 2022. This price target implies a 10.7% upside from the July 22 closing price. The following table shows the sensitivity of the target price to the P/E ratio.
| P/E Multiple | 10.6x | 11.6x | 12.6x | 13.6x | 14.6x |
| EPS – 2022 ($) | 2.04 | 2.04 | 2.04 | 2.04 | 2.04 |
| Target Price ($) | 21.6 | 23.6 | 25.7 | 27.7 | 29.8 |
| Market Price ($) | 23.2 | 23.2 | 23.2 | 23.2 | 23.2 |
| Upside/(Downside) | (6.9)% | 1.9% | 10.7% | 19.5% | 28.4% |
| Source: Author’s Estimates |
Equally weighting the target prices from the two valuation methods gives a combined target price of $24.7, which implies a 6.3% upside from the current market price. Adding the forward dividend yield gives a total expected return of 10.5%. Hence, I’m maintaining a buy rating on Provident Financial Services.
Be the first to comment